


Key takeaways
- WTI crude oil is on track for its worst monthly performance since April 2025, down 16% in May as easing US-Iran tensions reduce geopolitical risk premium.
- Technical signals remain bearish, as WTI trades below its 20-day and 50-day moving averages within a descending channel.
- Further downside risks remain in play toward the US$87.60 and US$81.94/85 support zones unless WTI breaks above the key US$95.10 resistance.
The former red-hot West Texas crude oil is looking to end the month of May 2026 on a bearish footing, an intra-session monthly decline of 16% (at this time of writing), its first negative month after four months of consecutive gains, and on the verge of recording its worst monthly performance since April 2025.
WTI Crude from Outperformer to Underperformer
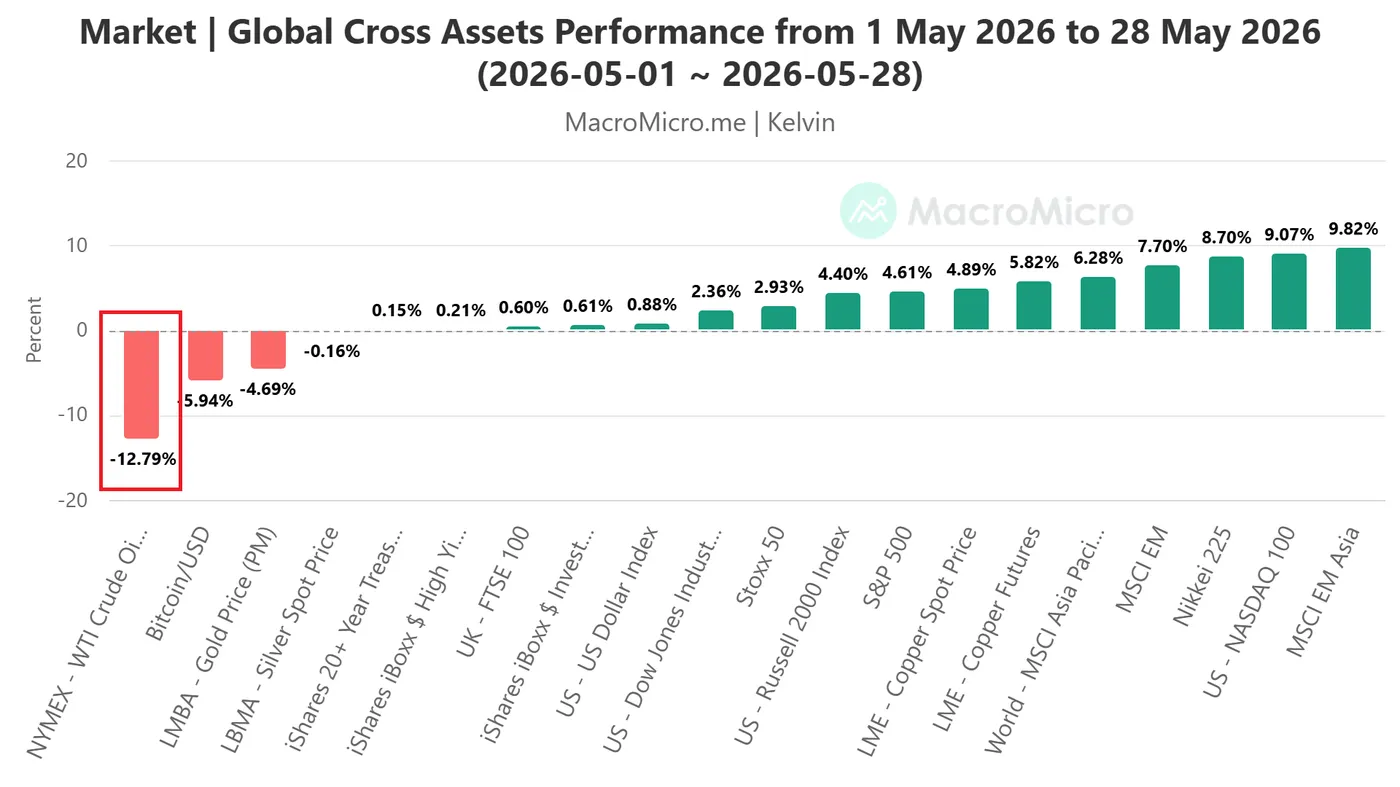
Fig. 1: Major cross-asset performances from 1 May 2026 to 28 May 2026 (Source: MacroMicro).
The ongoing weakness in crude oil prices has been primarily due to a potential end to the current three-month US-Iran conflict, which is likely to lead to the reopening of the Strait of Hormuz, reinforced by a tentative deal to extend a ceasefire by 60 days and, separately, to launch further talks on Tehran’s nuclear program. This sticky point caused the breakdown in US-Iran negotiations over the past month.
West Texas Intermediate (WTI) crude oil has now become the worst performer among major cross-asset classes in May, with WTI crude oil futures notching a double-digit loss of 13% from 1 May 2026 to Thursday, 28 May 2026 (see Fig. 1).
Let’s now focus on the 1 to 3 days trajectory of WTI crude oil from a technical analysis perspective.
WTI Crude – Oscillating Within a Minor Descending Channel
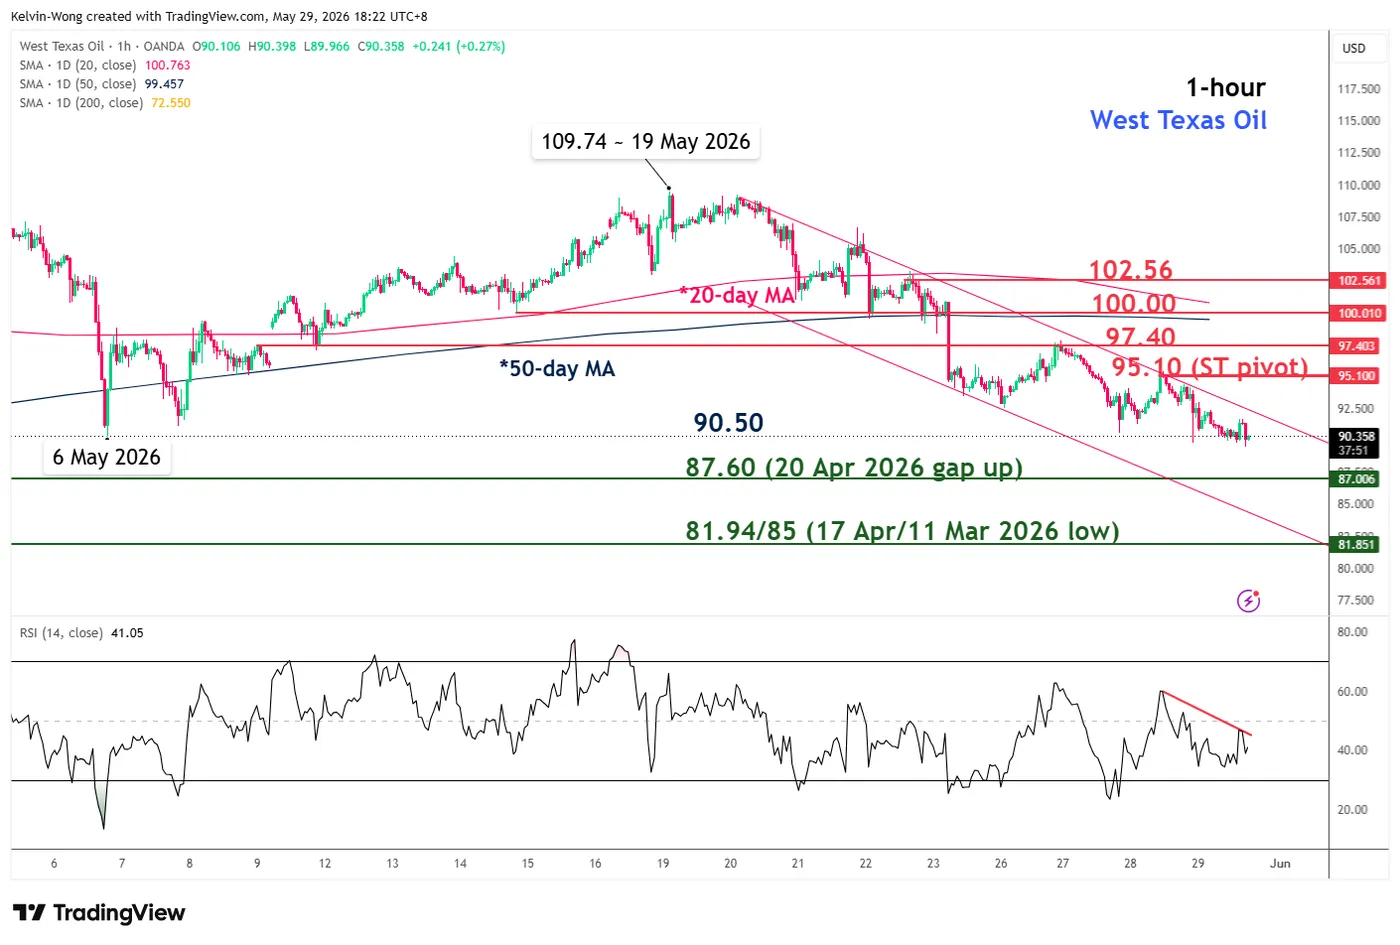
Fig. 2: West Texas crude oil CFD minor trend as of 29 May 2026 (Source: TradingView).
Trend bias: Minor downtrend within medium-term range configuration with 95.10 key short-term pivotal resistance (see Fig. 2).
Supports: 87.60 (20 Apr 2026 gap), and 81.94/85 (17 Apr/11 Mar 2026 low & minor descending channel’s lower boundary).
Next resistances: 97.40 (26 May 2026 high), 100.00 (psychological, 20-day & 50-day Mas), and 102.56 (22 May 2026 high & 61.6% Fibonacci retracement from 19 May 2026 high to 29 May 2026 intraday low).
Key Elements to Support the Near-Term Bearish Bias on the WTI Crude
- Price actions have formed a minor descending channel since the 20 May 2026 high
- Price actions remain below the 20-day and 50-day moving averages since 25 May 2026.
- The hourly RSI momentum indicator has continued to flash out bearish momentum conditions below the 50 level and has not reached its oversold region (below the 30 level).





