


On 3 July, Japan’s Finance Minister, Satsuki Katayama, stated that the Ministry of Finance remains in close contact with US authorities regarding developments in USD/JPY as the yen traded near its weakest level in almost 40 years. Similar verbal warnings have become increasingly common whenever the pair approaches the 162.00 area, although no direct intervention has been announced so far.
At the same time, weaker-than-expected US inflation data added pressure to the dollar. On 14 July, June’s Consumer Price Index came in below forecasts, significantly reducing expectations of a Federal Reserve rate hike at the July meeting and pushing US Treasury yields lower. The combination of increasingly cautious rhetoric from Japanese officials and softer US inflation expectations may keep USD/JPY range-bound, preventing buyers from establishing a sustained break above its multi-decade highs.
Technical Picture
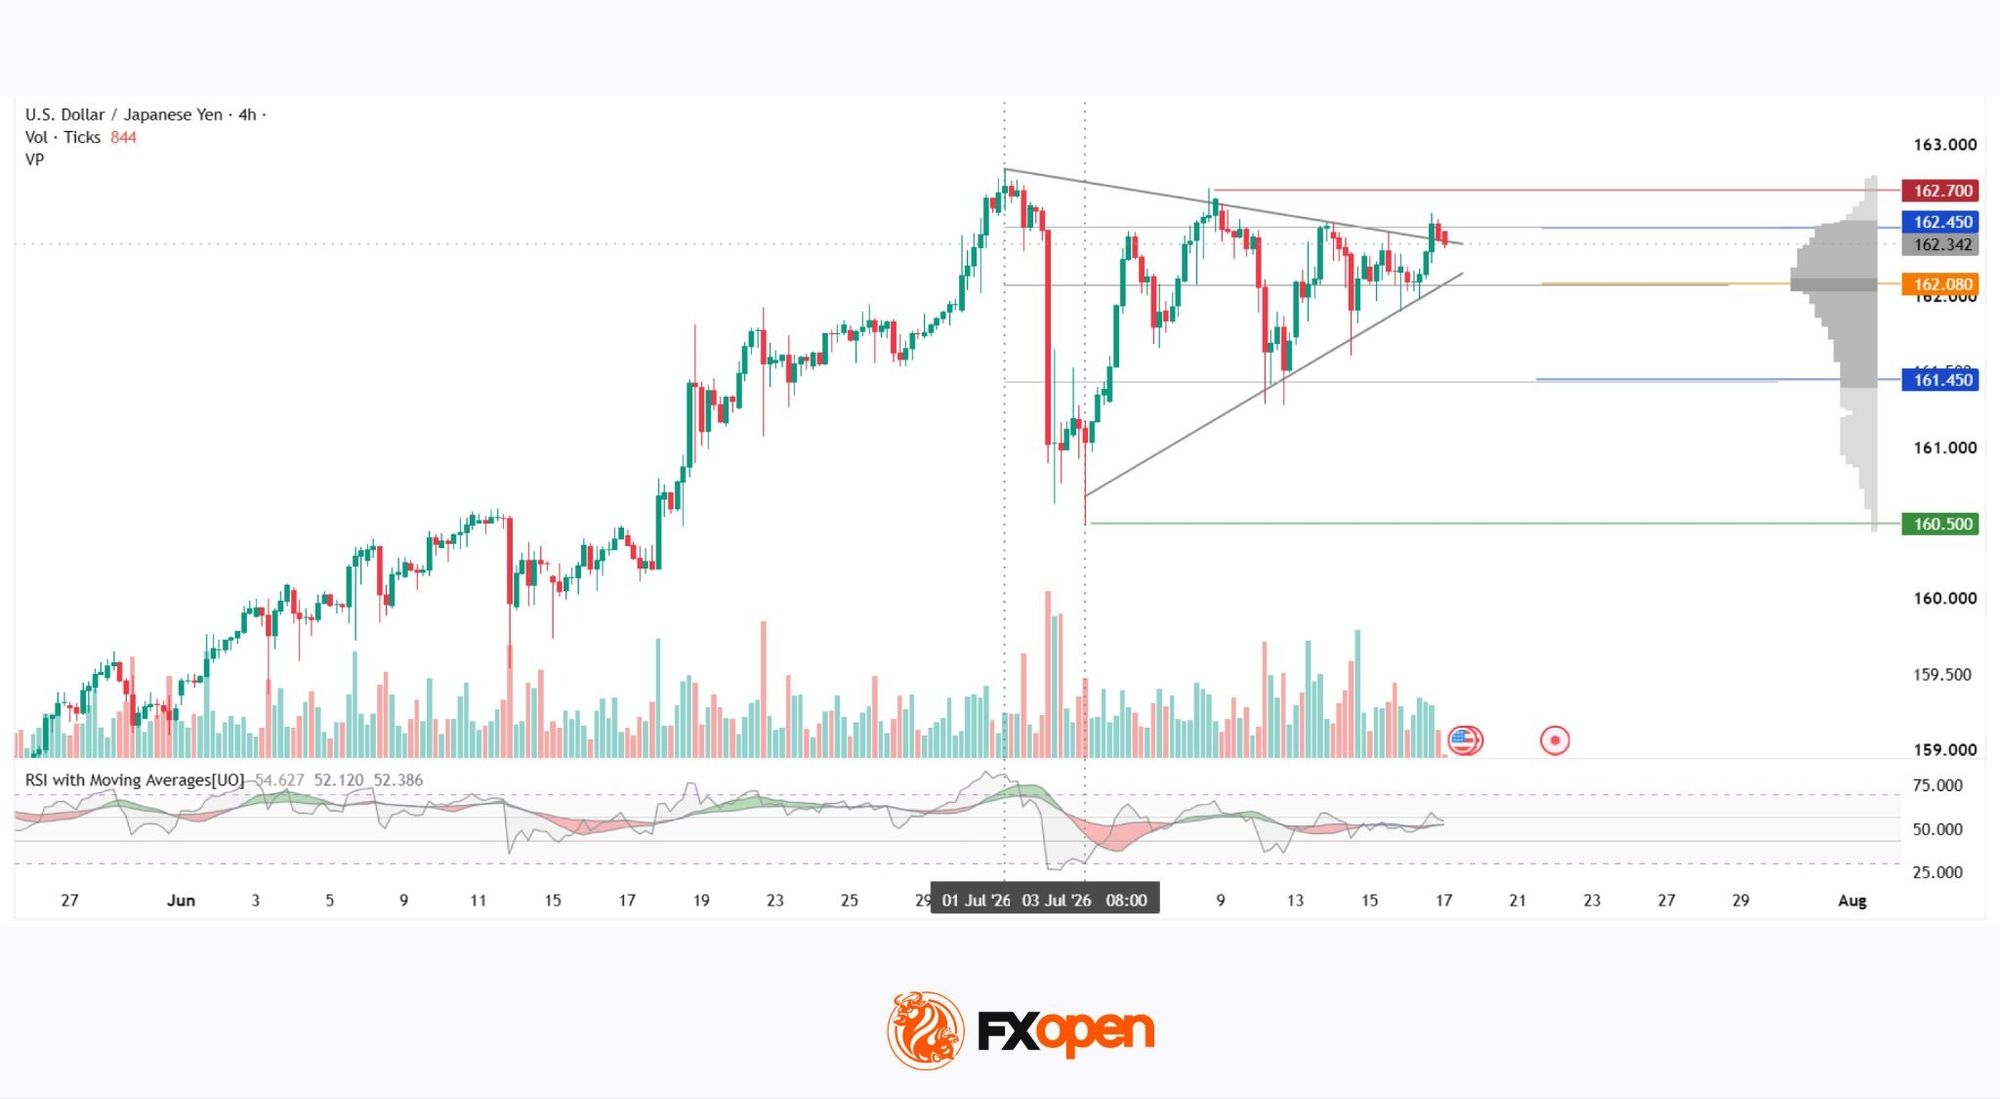
On the four-hour chart, USD/JPY advanced steadily throughout June, reaching a peak near 162.80 on 1 July. A sharp reversal followed, with the pair dropping rapidly to the 160.50 area, where the green support zone is currently located. The decline coincided with market speculation about a possible currency intervention by the Japanese authorities.
After rebounding from the 3 July low, the pair began forming a triangle pattern. Price is now testing the upper boundary of the formation, although the attempted upside breakout is currently being capped by the upper edge of the current volume profile at 162.45. Just above this level lies the red resistance zone at 162.70.
The Point of Control (POC) is located around 162.08 and could become a key magnet if the pair moves back towards the lower part of the range, where two additional important technical levels are visible: the lower boundary of the volume profile at 161.45 and the green support zone at 160.50.
Volume behaviour also deserves attention. The break above the triangle’s upper boundary was not supported by strong bullish volume, indicating limited buying conviction and increasing the risk that the breakout could soon reverse. Meanwhile, the RSI + MAs oscillator stands at 54, 52 and 52 respectively, with all three readings remaining firmly in neutral territory, reinforcing the current lack of directional conviction.
Key Takeaways
USD/JPY is testing the upper boundary of its current market structure while momentum indicators remain neutral. The lack of bullish volume at the breakout adds uncertainty, while the Point of Control around 162.08 could be the key reference level if price begins to move lower.
Trade over 50 forex markets 24 hours a day with FXOpen. Take advantage of low commissions, deep liquidity, and spreads from 0.0 pips (additional fees may apply). Open your FXOpen account now or learn more about trading forex with FXOpen.
This article represents the opinion of the Companies operating under the FXOpen brand only. It is not to be construed as an offer, solicitation, or recommendation with respect to products and services provided by the Companies operating under the FXOpen brand, nor is it to be considered financial advice.





