


Sterling enters this week on firmer footing, with political uncertainty fading fast after Andy Burnham’s confirmation as Labour leader eased investor concerns over the succession to Keir Starmer. Markets reacted further to reports pointing to Shabana Mahmood as the frontrunner for Chancellor, viewed as the more fiscally disciplined choice. On the policy front, the Bank of England remains firmly in tightening mode, with markets fully pricing a rate hike by year-end, reinforced by renewed Middle East tensions pushing oil to one-month highs and stoking fresh inflation risks.
The Swiss franc, meanwhile, continues to play its familiar dual role. Domestically, the picture argues for weakness—the SNB holds its policy rate at zero, inflation sits near zero, and growth remains subdued after Bern trimmed its 2026 GDP forecast due to elevated US tariffs. Yet globally, the franc keeps drawing so-called safe-haven demand from the same conflict fueling GBP’s hawkish repricing, with the SNB explicitly flagging renewed willingness to intervene against excessive appreciation.
Technical Analysis
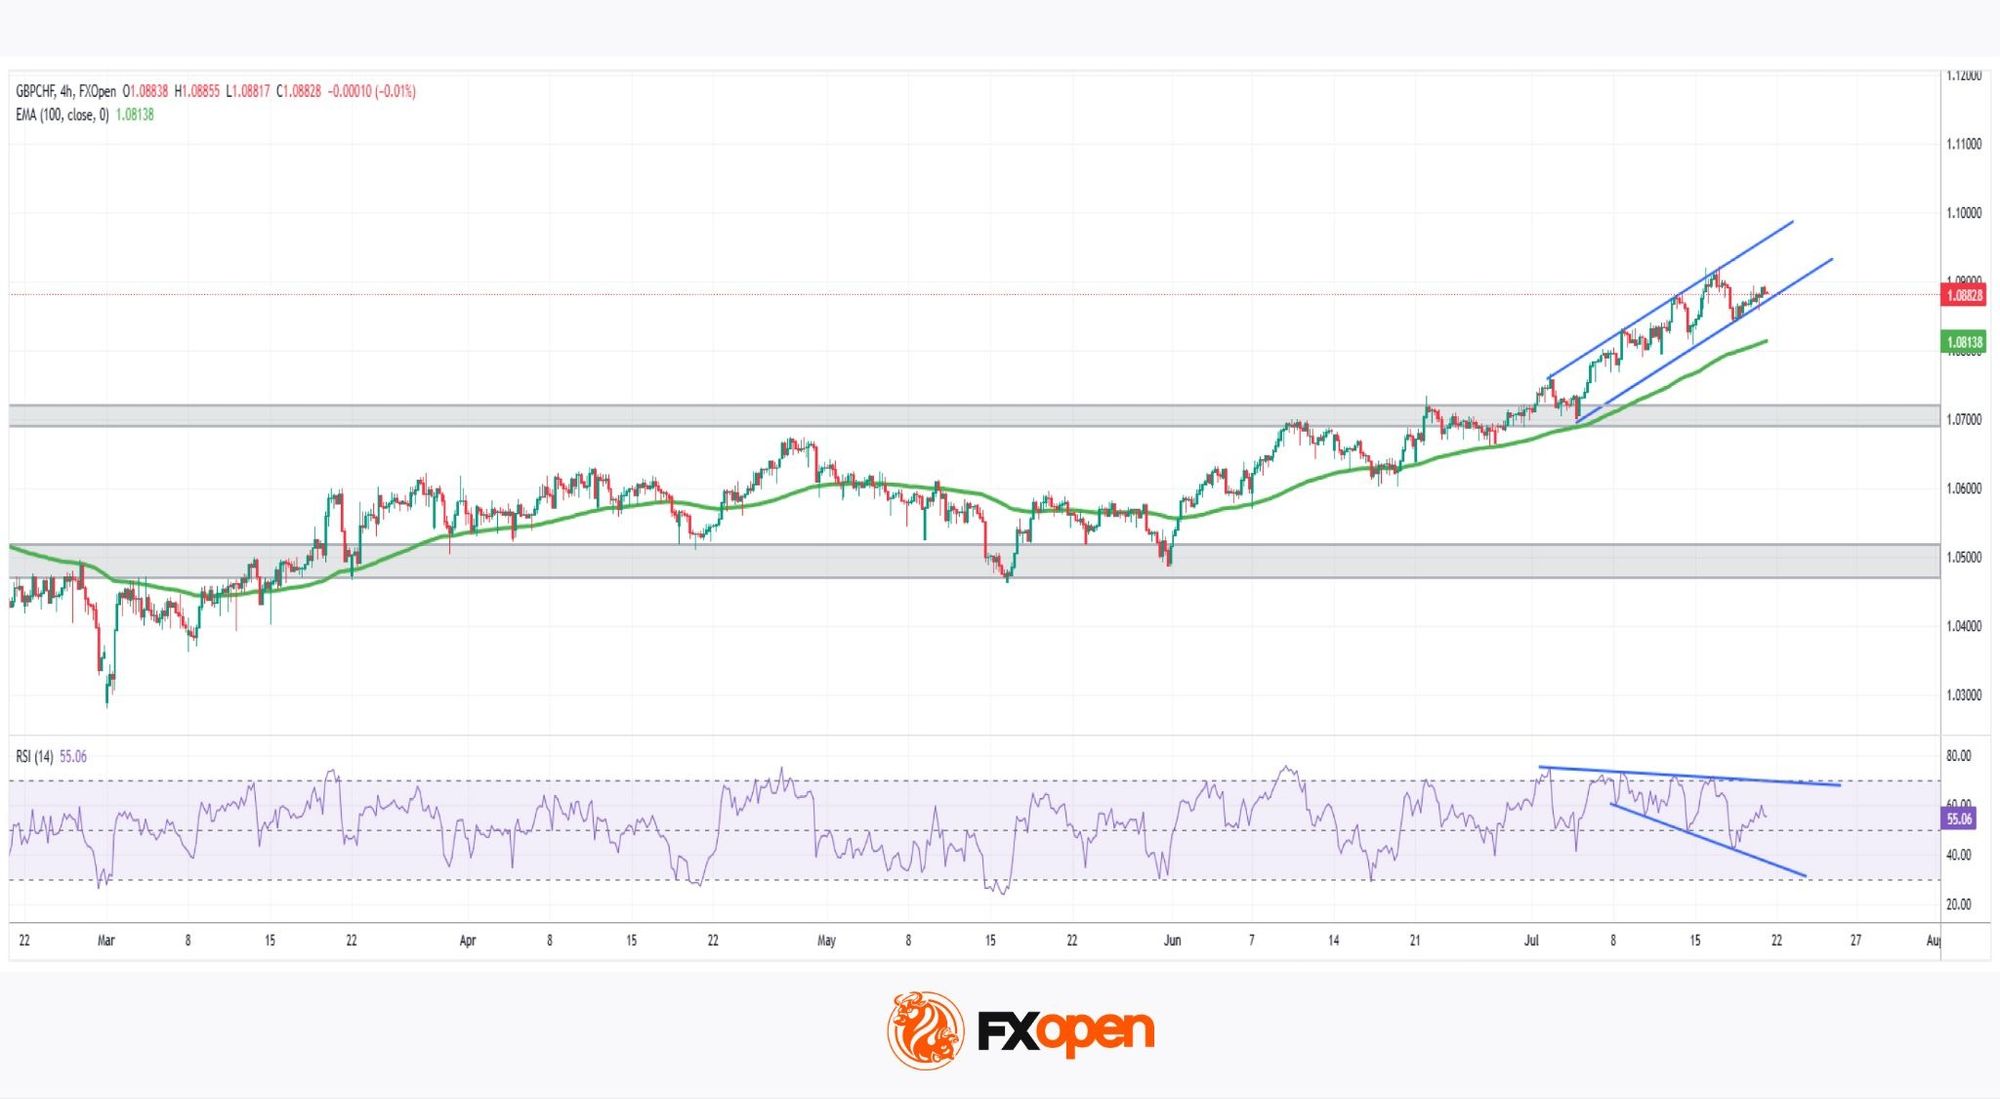
As the 4-hour chart of GBP/CHF shows, price broke decisively higher in early July after nearly three months of consolidation, a move fueled by these same political and macro drivers. The breakout has since evolved into a clear uptrend, though price action is now showing early signs of exhaustion beneath the surface.
Bullish Scenario
Having broken above 1.0700, price has held firmly above this level, forming a consistent pattern of higher highs and higher lows within an ascending parallel channel. The 100-period EMA sits comfortably below price, reinforcing the case that buyers remain in control, ready to defend any dip toward the channel’s lower boundary or the moving average.
Bearish Scenario
Not everything lines up with this bullish picture, however. The RSI is forming lower highs and lower lows even as price prints higher highs, creating a persistent bearish divergence that hints at fading momentum. However, sellers would need a confirmed break below the ascending trendline and the 100-period EMA to gain real conviction—a breakdown that could send price back to retest the pivotal 1.0700 zone, and potentially back into the broader 1.0500–1.0700 range.
So which signal is telling the truth: the rising channel and supportive EMA, or the quiet warning building in the RSI?
Trade over 50 forex markets 24 hours a day with FXOpen. Take advantage of low commissions, deep liquidity, and spreads from 0.0 pips (additional fees may apply). Open your FXOpen account now or learn more about trading forex with FXOpen.
This article represents the opinion of the Companies operating under the FXOpen brand only. It is not to be construed as an offer, solicitation, or recommendation with respect to products and services provided by the Companies operating under the FXOpen brand, nor is it to be considered financial advice.





