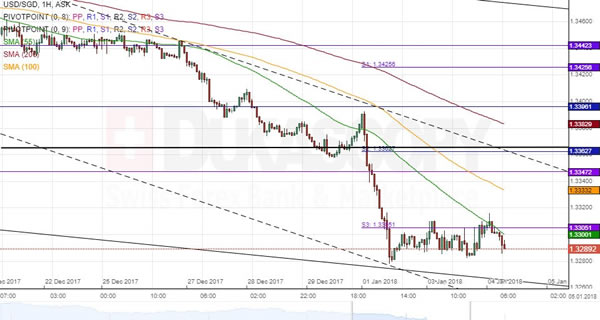
The US Dollar has depreciated substantially against the Singapore Dollar during the previous ten weeks. As a result, the pair tested its 2016/2017 low on Tuesday.
As apparent on the chart, the Greenback has failed to demonstrate a distinctive movement either direction. This situation does suggest that the prevailing bearish sentiment could change soon. Thus, even though the 55-hour SMA, the weekly S2 and the monthly S1 are providing strong resistance in the 1.3300/15 area, the pair is likely to edge higher during the following trading sessions.
In case the US Dollar weakens, the combined support of the weekly R3 and the monthly S2 circa 1.3250 is expected to halt any further decline.