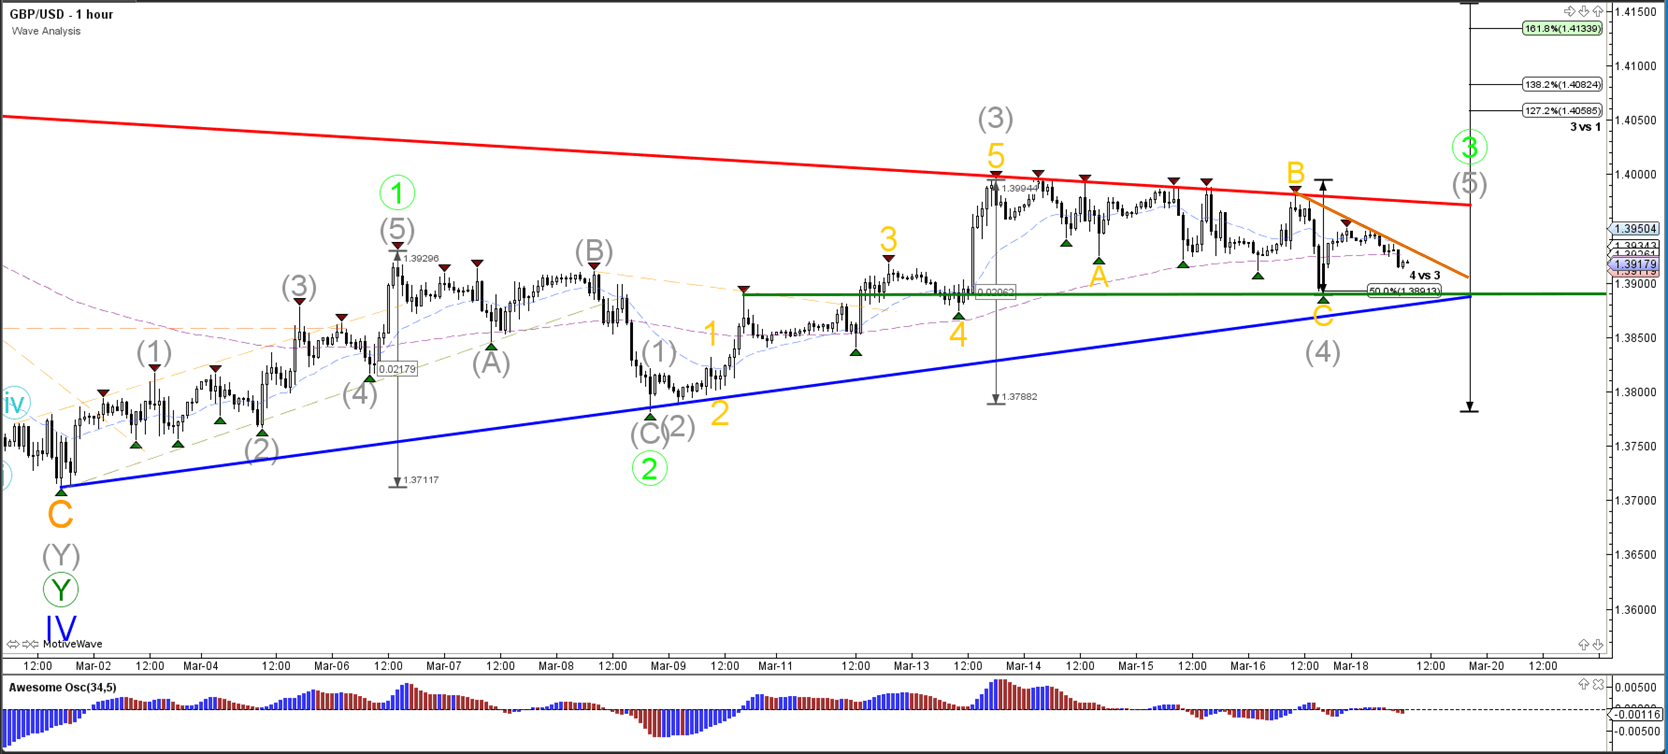
Currency pair GBP/USD
The GBP/USD remains stuck in between support (blue) and resistance (red) and a breakout is needed to indicate the new direction. A bullish breakout above resistance (red) could spark the continuation of wave 5 (blue) within wave C (purple) whereas a bearish break could indicate a change in wave patterns and a bearish continuation.
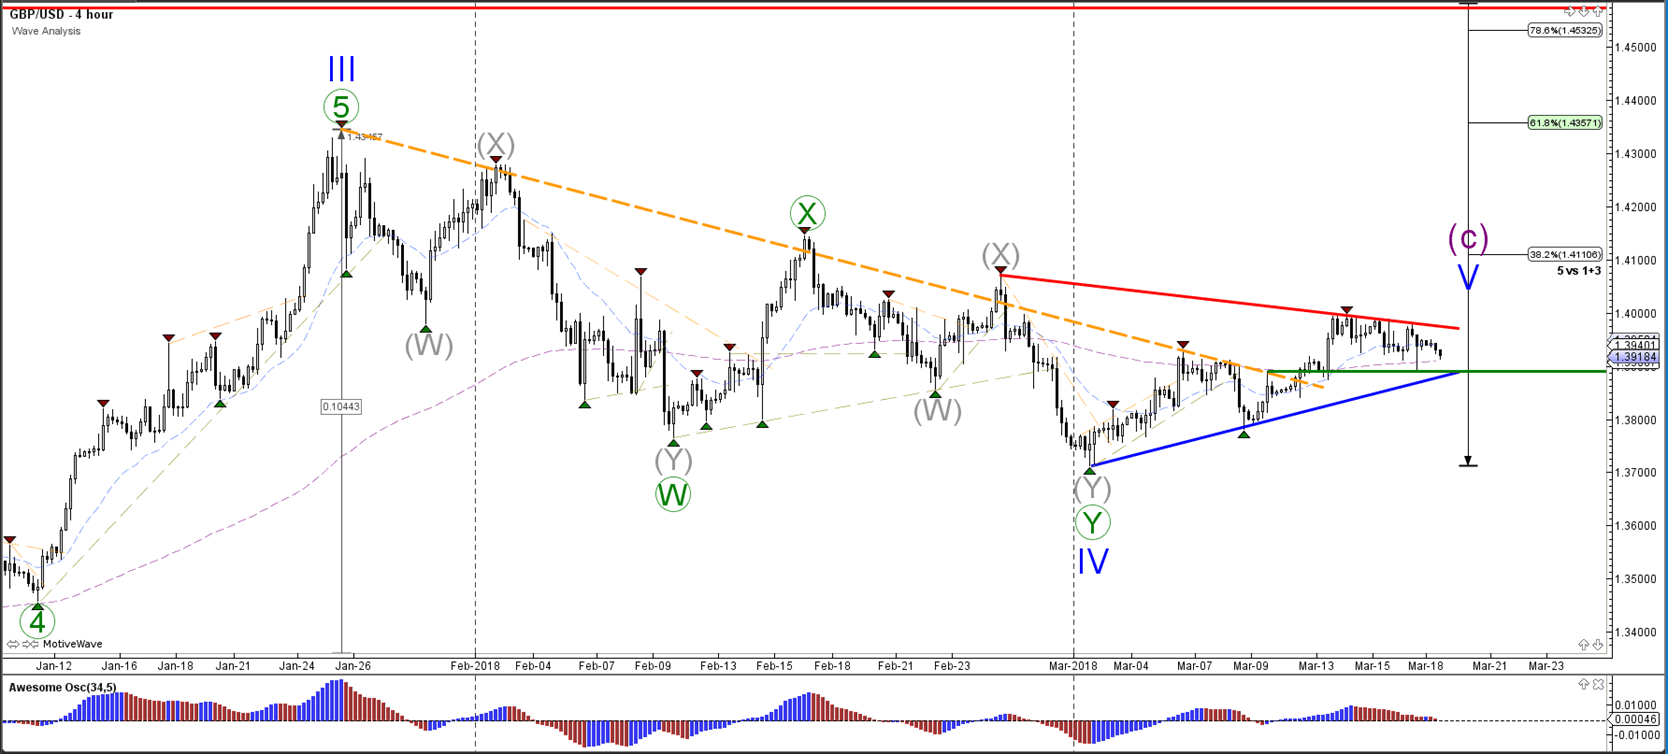
The GBP/USD bounced at the 50% Fibonacci support level of potential wave 4 (grey). The trend lines are key factors for the next breakout.
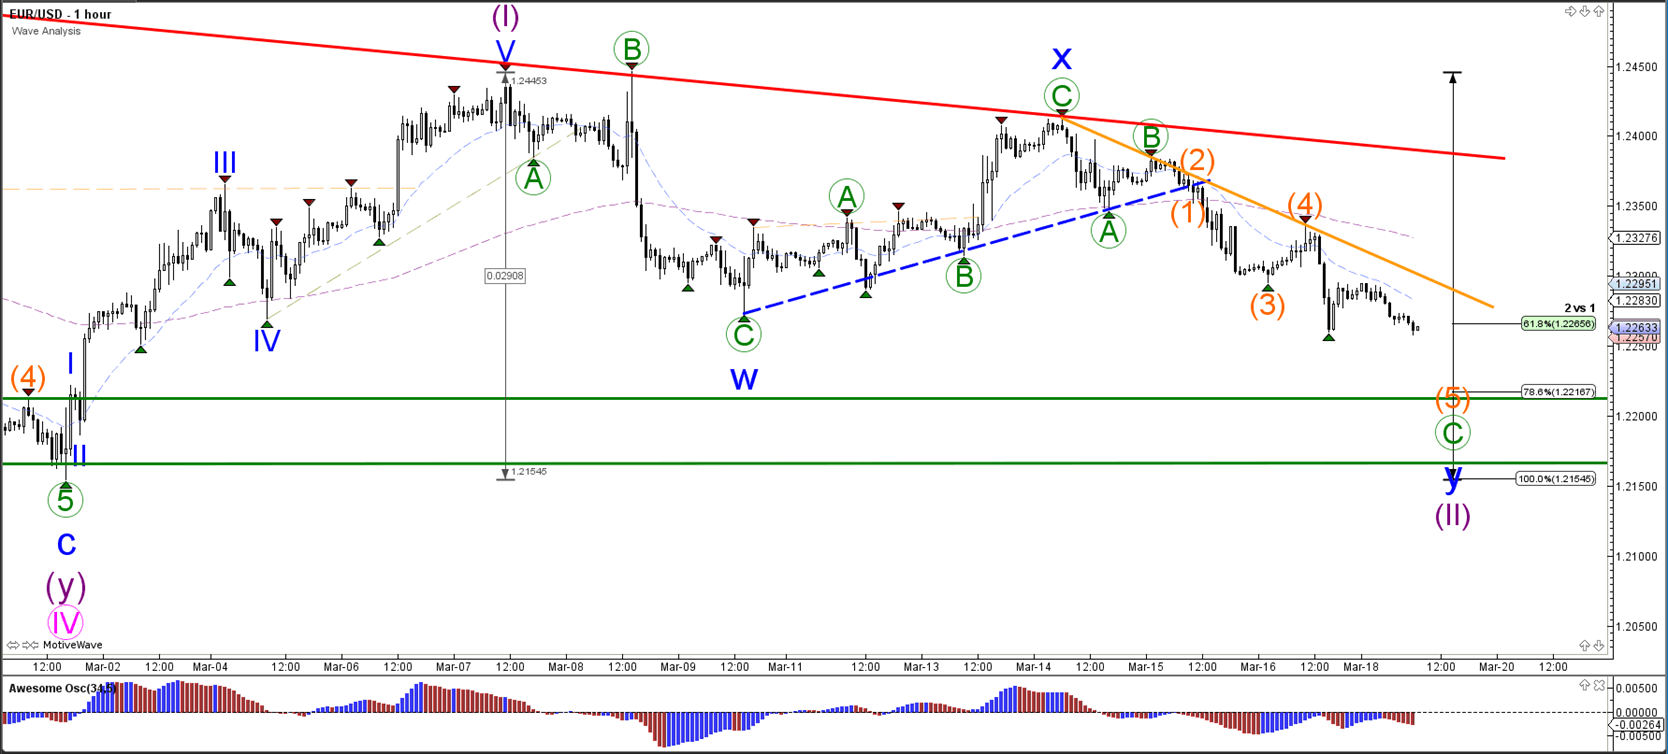
Currency pair EUR/USD
The EUR/USD is testing the 61.8% Fibonacci support level of wave 2 vs 1 (purple). A break below the Fib could see price retest the support zone (green). A break below the 100% Fib invalidates the wave 2 whereas a bullish bounce could see price continue with the bullish waves 5 (pink/purple).
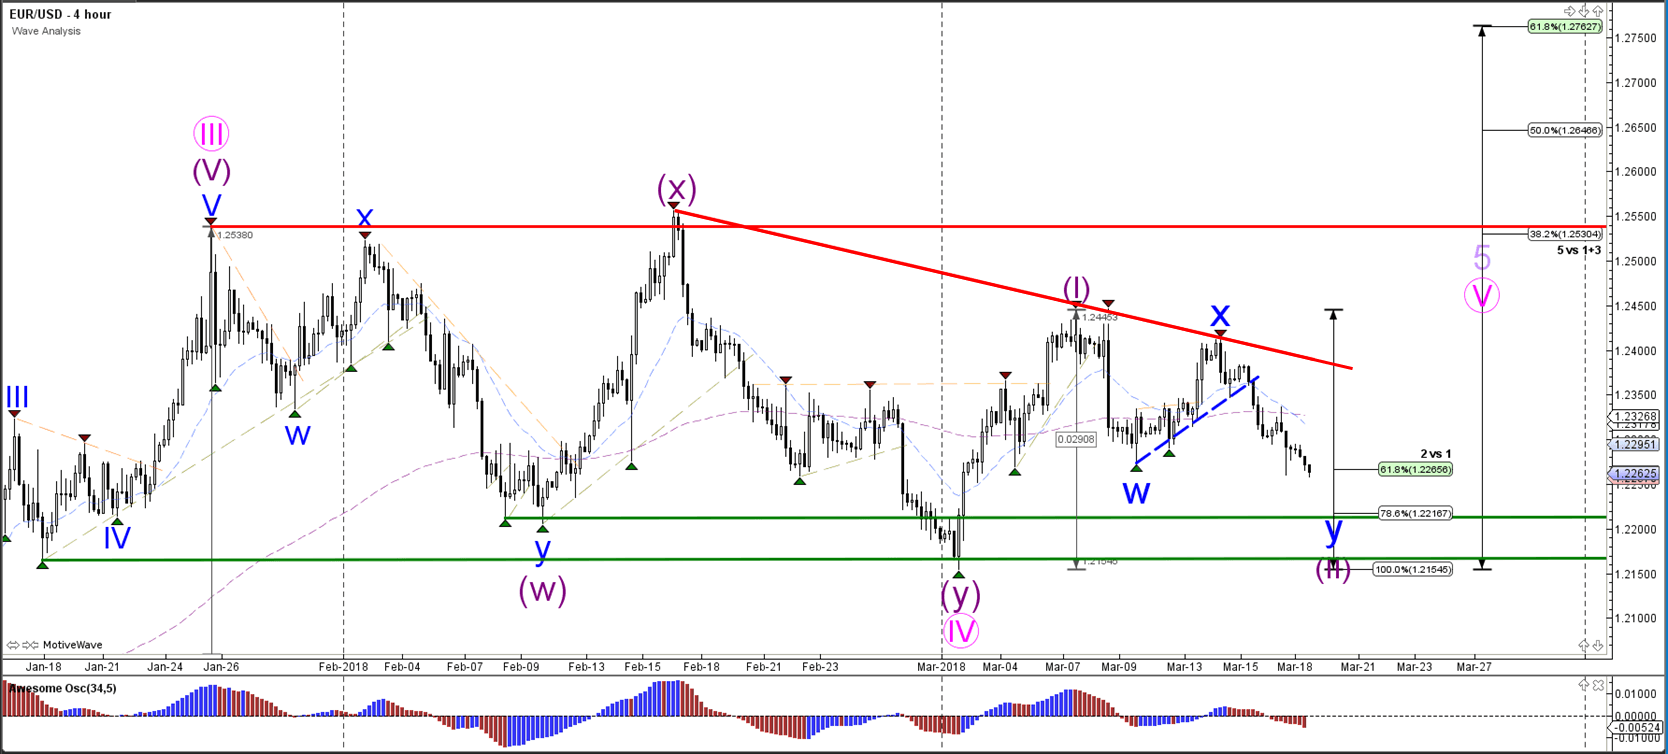
The EUR/USD is building a bearish wave C (green) within a larger WXY (blue) correction.
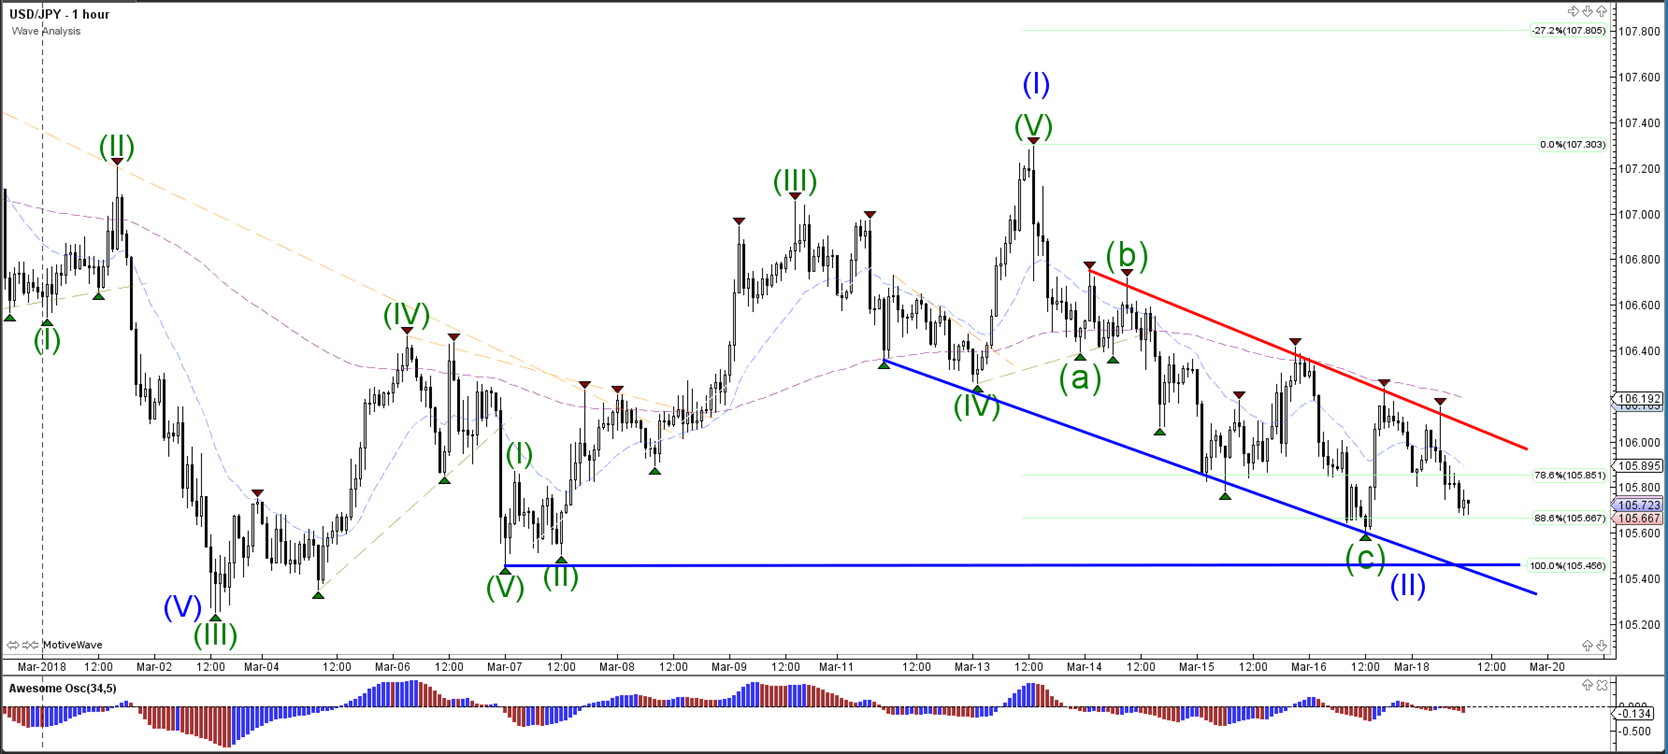
Currency pair USD/JPY
The USD/JPY trying to break below the support (blue) zone of the bigger triangle chart pattern. A bearish breakout could see the continuation of the downtrend.
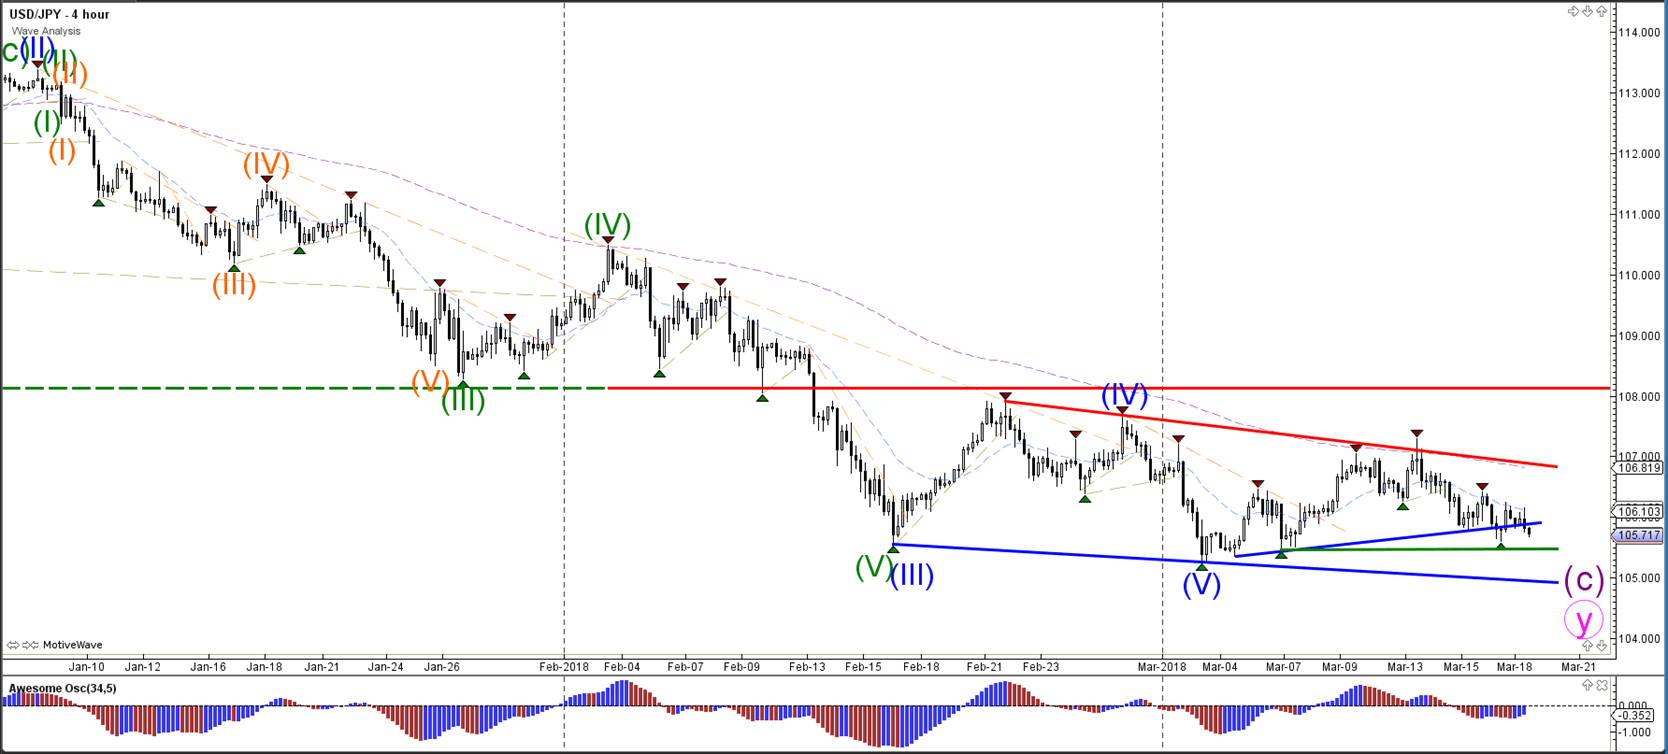
The USD/JPY is testing the 88.6% Fibonacci support level of wave 2 (blue). A break below the 100% Fib invalidates this wave 2 (blue).