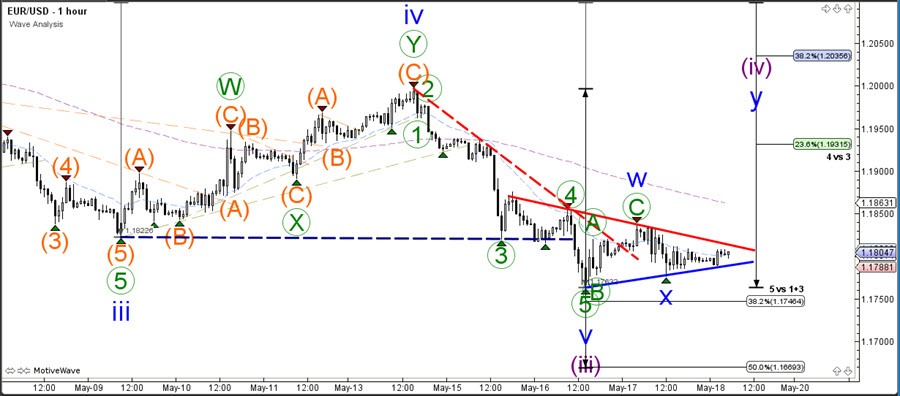
The EUR/USDfailed to break the bottom yesterday. Price action is now building a larger triangle chart pattern and the next move will depend on the breakout direction.
A bullish bounce could indicate the start of a wave 4 (purple) correction whereas a bearish breakout could see an expansion of the wave 3 (purple) momentum towards the Fibonacci targets of wave 5. For the moment a wave 4 seems to be more likely.
The EUR/USD is building a triangle chart pattern. A break above the resistance (red) could see a bullish breakout take price up to the Fibs of wave 4 whereas a break below the support (blue) could see price test the Fib target of wave 3.