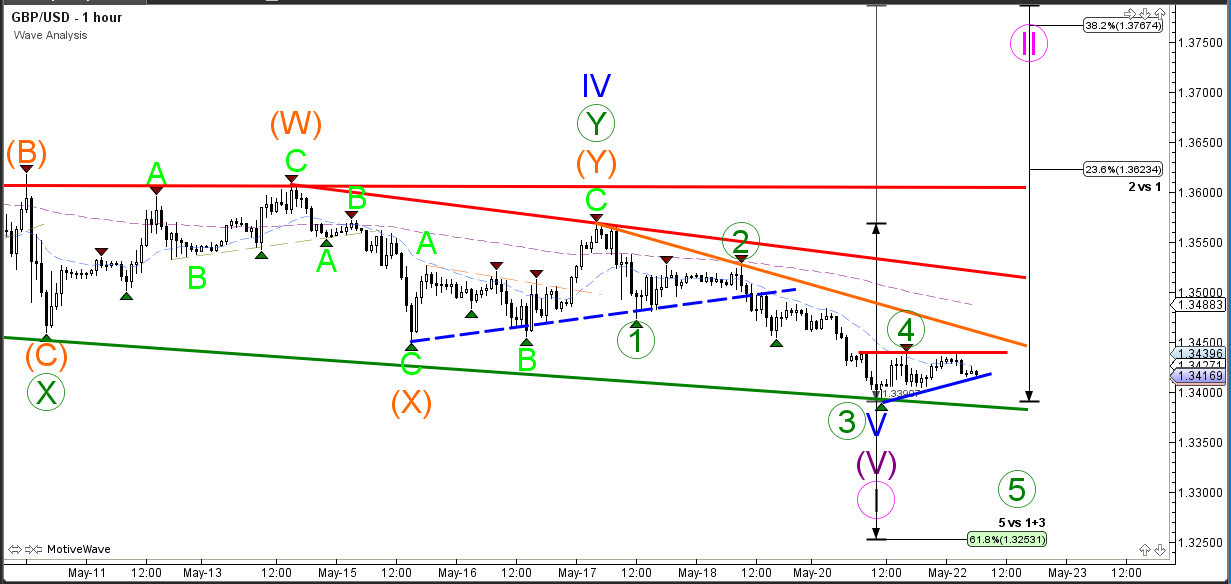
The GBP/USD broke below the support trend lines and the downtrend continued with a new lower low. The Cable is now approaching a key Fibonacci support zone (green) around 1.34. Price will need to break below the support trend line (green) before a bearish breakout could occur whereas a bullish break could indicate a retracement within wave 2.
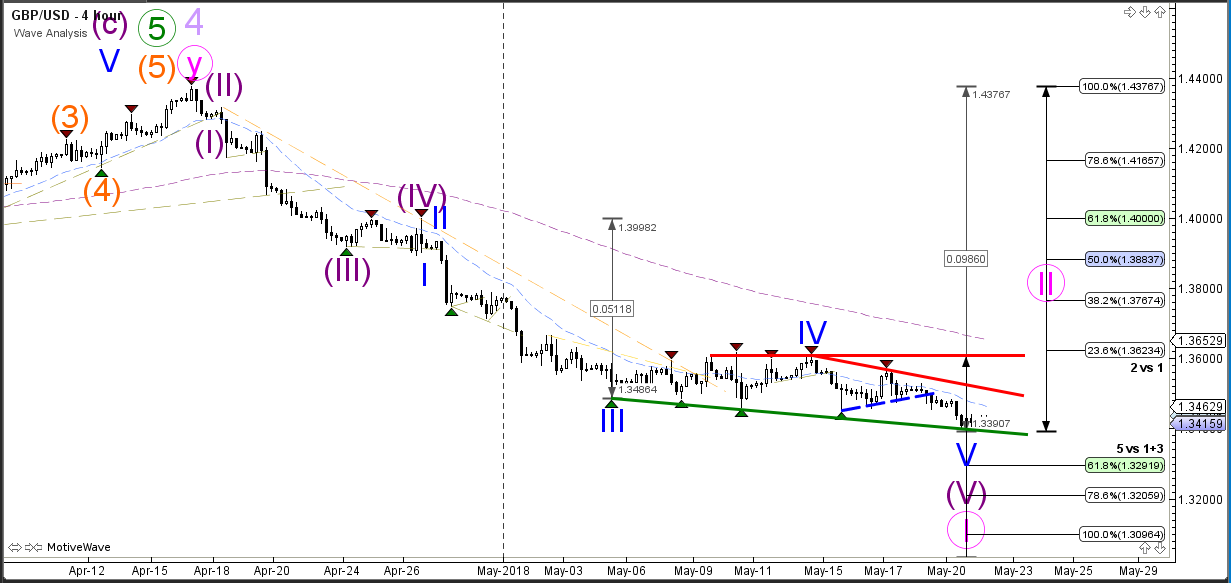
The GBP/USD is now building a corrective chart pattern which could be a wave 4 (green). A bearish breakout aims for the Fibonacci targets of wave 5 (blue/purple) whereas a bullish breakout could retrace back to the Fibonacci retracement levels of wave 2 (pink)