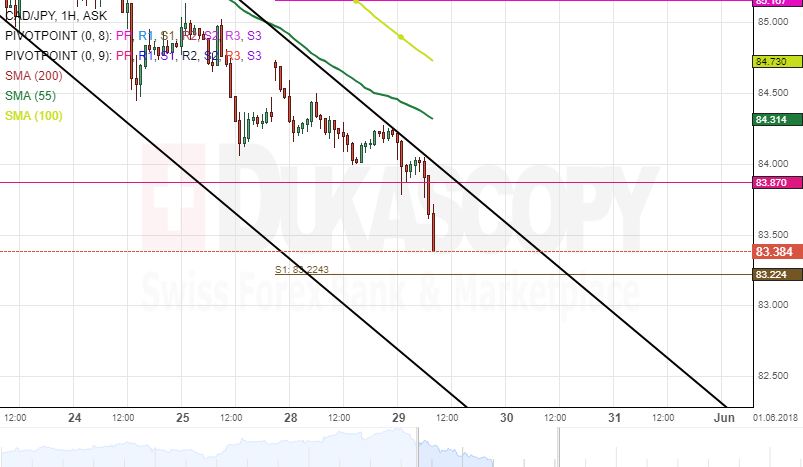
Following a reversal from the upper boundary of a dominant descending channel on May 22, the Canadian Dollar began a new move in a channel down against the Japanese Yen.
This move down could be considered to be a brief retracement. Also, the 55– hour simple moving average has been guiding the currency pair further south since the pair hit the up border of a junior pattern.
Given that the SMAs have crossed over above the price movement, this could signal a long-term decline for the CAD/JPY currency exchange rate. Meanwhile, traders should look for opportunities to trade the signals at SMA crossovers.