
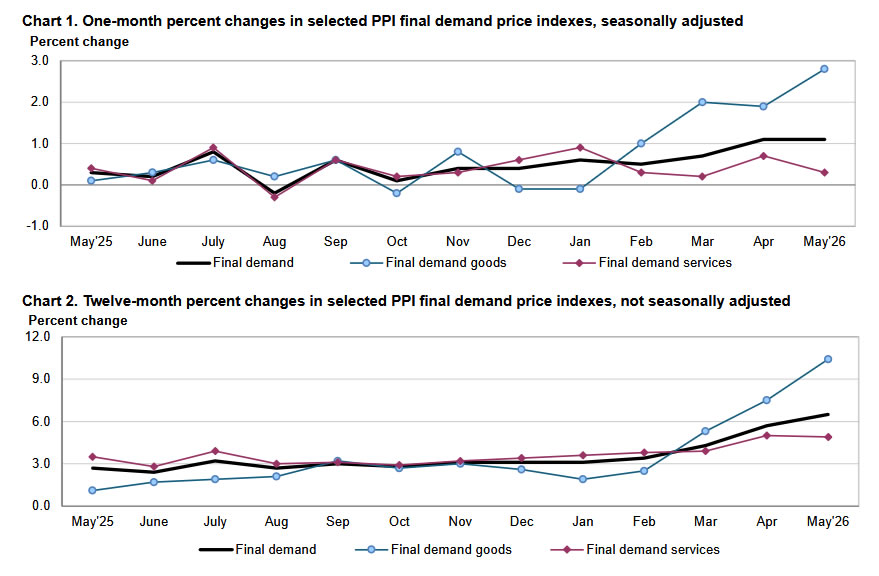
US producer prices surged far more than expected in May, highlighting that inflation pressures continue to build beneath the surface of the economy despite Wednesday’s relatively reassuring consumer inflation report. PPI rose 1.1% mom, matching April’s increase and exceeding expectations of 0.7% mom. Annual producer inflation accelerated from 5.9% yoy to 6.5% yoy, the strongest pace since November 2022.
The increase was overwhelmingly driven by energy costs. Final demand goods prices jumped 2.8% mom, the largest increase since the series began in 2009, with a 10.7% surge in energy prices accounting for most of the gain. Gasoline prices alone soared 23.4%, while diesel fuel, jet fuel, industrial chemicals and natural gas liquids also recorded sharp increases.
However, the report was not purely an energy story. Core producer prices excluding food, energy and trade services rose 0.8% mom, the largest increase since March 2022, lifting the annual rate to 5.1% yoy.
The data reinforces a theme increasingly confronting policymakers around the world: the energy shock is beginning to move beyond oil markets and into broader production chains.
| Indicator | May 2026 | Notes |
|---|---|---|
| Headline PPI M/M | 1.1% | Above expectations |
| Headline PPI Y/Y | 6.5% | Highest since Nov 2022 |
| Core PPI* M/M | 0.8% | Highest since Mar 2022 |
| Core PPI* Y/Y | 5.1% | Highest since Oct 2022 |
| Final Demand Goods M/M | 2.8% | Record increase since series began in 2009 |
| Energy Prices M/M | 10.7% | Main inflation driver |
| Gasoline Prices M/M | 23.4% | More than half of goods increase |
| Final Demand Services M/M | 0.3% | Slower than April |
| Transportation & Warehousing | 2.6% | Strong increase |
| Trade Services | -1.1% | Partial offset |


