Sample Category Title
Trump Threatens Tariff on Japan as Deadline Looms, Yen Dips
The Japanese yen is negative ground on Thursday. In the North American session, USD/JPY is trading at 144.06, up 0.47%.
US-Japan trade talks stumble over .... rice
The US and Japan are racing to reach a trade deal before a deadline of July 9. There are some serious roadblocks to a deal, including the current US tariff of 25% on Japanese cars and opening Japan's agricultural sector, particularly rice. President Trump has insisted that Japan import American-grown rice, but the Japanese government says that is unacceptable.
Japan's Economy Minister Ryosei Akawaza said earlier this week that Japan would not "sacrifice the agricultural sector", while Farm Minister Shinjiro Koizumi said that foreign rice imports would threaten Japan's food security.
US nonfarm payrolls expected to drop to 110 thousand
It's a shortened week in the US due to the Fourth of July holiday on Friday. The US will release the June employment report on Thursday, with all eyes on nonfarm payrolls.
Nonfarm payrolls eased slightly in May to 137 thousand from 147 thousand and the downward trend is expected to continue, with a consensus of 110 thousand for June. This would mark the weakest pace of job growth since 2020, with the exception of a meltdown in job growth in Oct. 2024.
The Federal Reserve will also be monitoring the nonfarm payroll report. The US labor market has been weakening and the Fed is concerned that the jobs market could show a sharp deterioration. Currently, the most likely date for the next Fed rare cut is September, but a soft NFP reading south of 90 thousand would boost the case for a cut at the July 30 meeting.
The Fed has maintained a wait-and-see stance since Nov. 2024 but that is expected to change in the fourth quarter, where we could see up three rate cuts.
USD/JPY Technical
- There is support at 142.64 and 141.86
- 143.45 and 144.23 are the next resistance lines
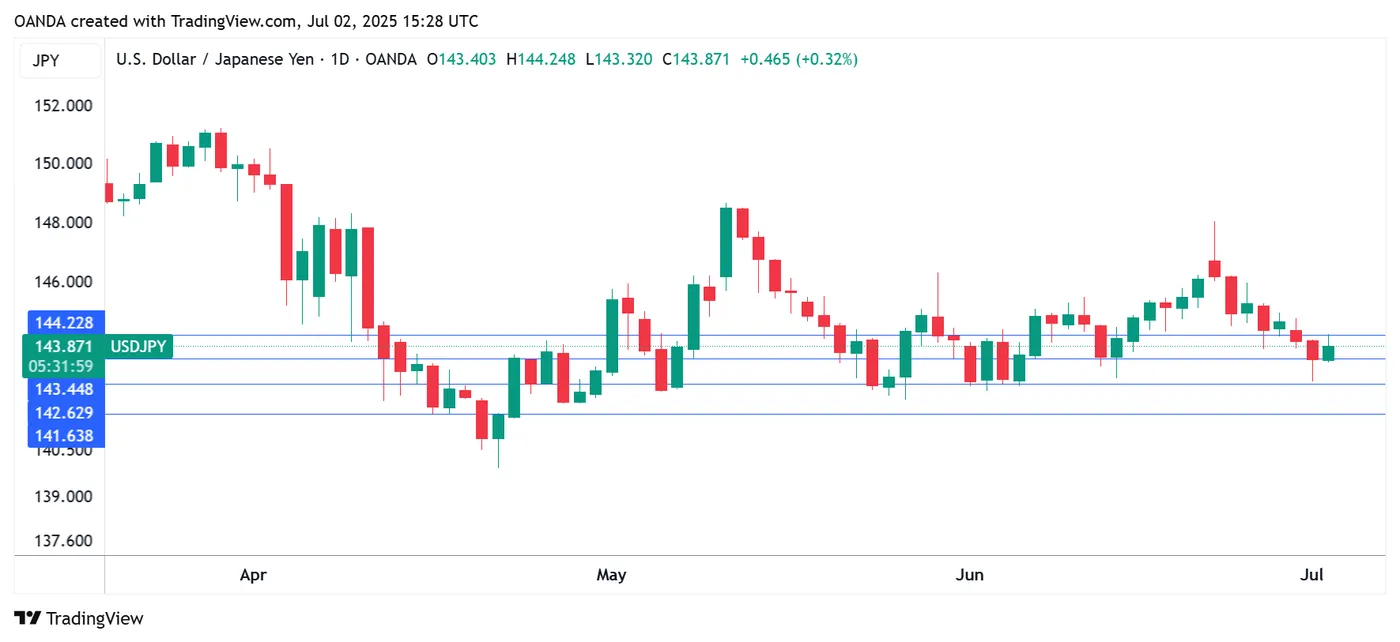
USDJPY 1-Day Chart, July 2, 2025
GBP/USD: Cable Falls Sharply on Political Turmoil in UK
British pound fell across the board on Wednesday following fresh political storm in the UK, after finance minister Reeves’ budget plan was strongly hurt by a series of significant changes in welfare reform bill that undermined the position of the fin min Reeves, as well as PM Starmer, who gave his full support to the finance minister.
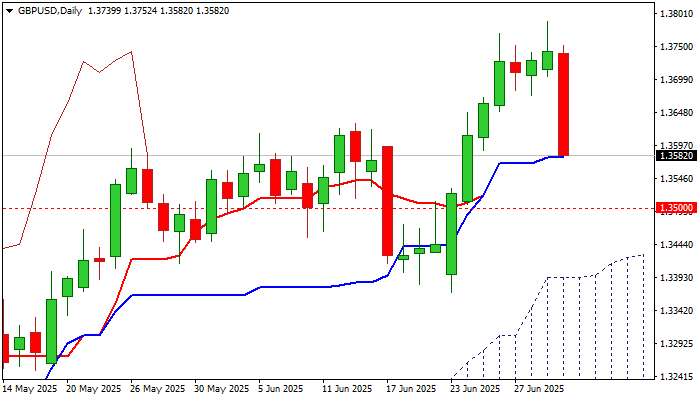
Fresh weakness (Cable was down almost 1% for the day) adds to reversal signal that is developing on daily chart, as today’s action was shaped in long bearish candle, after the pair has registered six consecutive daily gains.
Technical picture weakens on daily chart as south-heading 14-d momentum is cracking the centreline, in attempts to break into negative territory and bears pressure important support at 1.3579 (50% retracement of 1.3370/1.3788, reinforced by converged daily Tenkan/Kijun-sen) while situation on 4-hr and hourly charts shows that bears gained control.
Break of 1.3579 trigger to open way for further weakness and expose targets at 1.3530 (Fibo 61.8%) and 1.3500 (psychological) guarding more significant support at 1.3397 (top of ascending and thickening daily cloud).
Broken 200HMA (1.3642) offers solid resistance, along with 1.3674 (low of recent range).
Res: 1.3618; 1.3642; 1.3674; 1.3712.
Sup: 1.3530; 1.3500; 1.3469; 1.3397.
US Stocks Point to Muted Reaction at Open Despite Big ADP Jobs Miss
This morning's ADP release was not enough to trigger large volatility in Markets. The data came in at -33K vs a consensus of 95K, a consequential miss that led to a subdued market reaction.
US Equity futures had gone up in the overnight session with the S&P 500 just grazing new all-time highs (6,229 on its CFD) and markets are now correcting, with however a slow but steady grind.
ADP Employment measures private employment by US Firms and concerns around 30 millions of Americans , which represents a bit less than 10% of the US Population – Its correlation to the Non-Farm Payrolls data is not significant, a reason why reactions to ADP releases are less accentuated than the more global US NFP.
The miss is nonetheless quite large and it will be interesting to see in the upcoming months how Trump's policies influence the difference in Private and Public US Employment, if there are disparities and how much of a difference in the economy this potential disparity generates.
The current picture in US Indices point to similar rebalancing flows from Tech to Consumer Defensive/Manufacturing with the Nasdaq again leading on the downside (-0.40%) and the Dow Jones on top of Indices (-0.10%) – Futures point towards a small gap down at the 9:30 opening Bell.
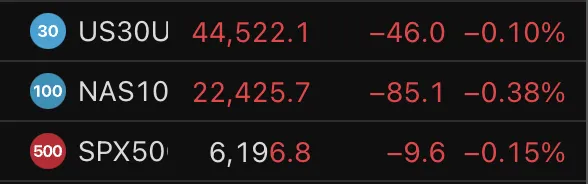
US Indices CFD performance, July 2, 2025 – Source: TradingView
Nasdaq vs Dow Jones Relative strength in the past 10 years
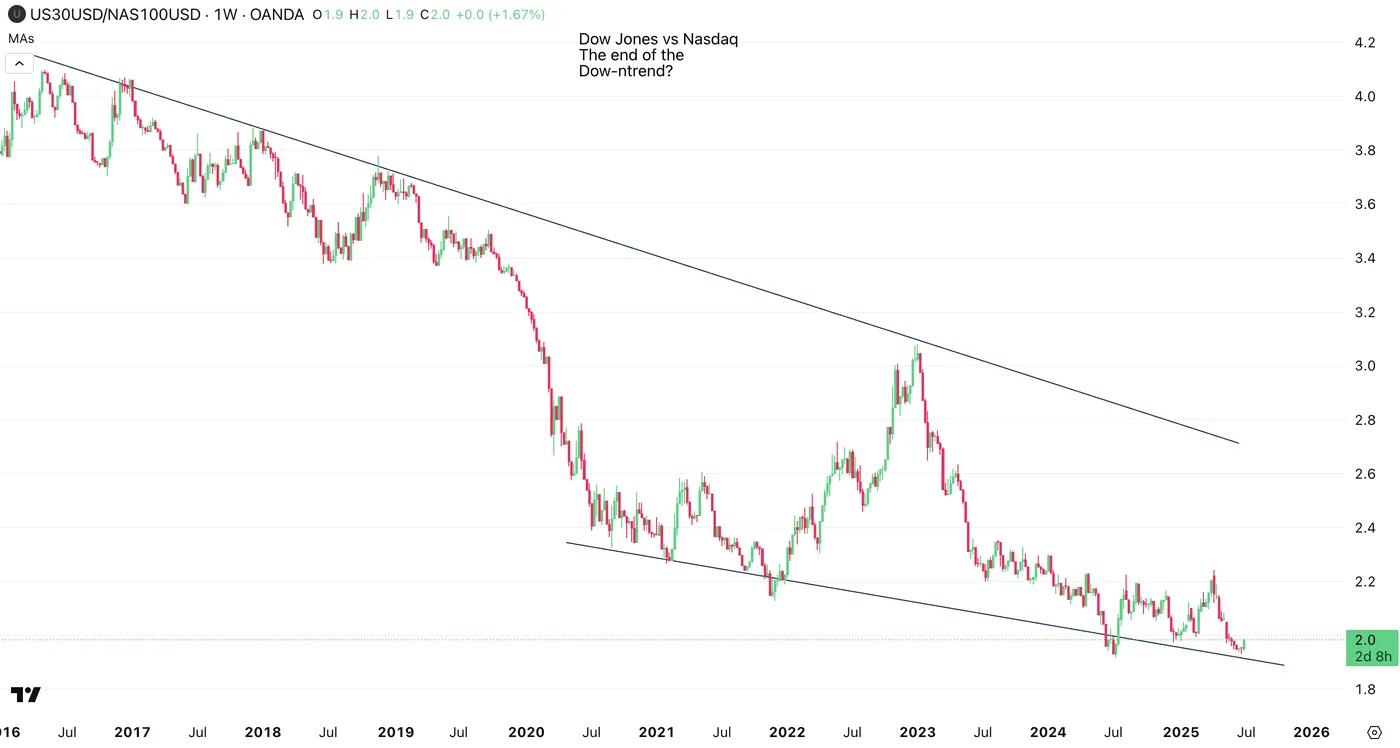
Dow Jones vs Nasdaq, July 2, 2025 – Source: TradingView
This chart takes a peak at a comparison from Nasdaq prices relative to the Dow Jones – Since its advent in 1971, the Tech-Focused index has quite largely overperformed the more defensive Industrial Dow.
Prices in both indices are not calculated the same way, however the idea stays the same – The downtrend is slowing down, but still active, a bottom might be getting formed.
The ratio is now only 2 to 1 in terms of pure pricing and it seems that markets might start to change their appetite from the Nasdaq to the Dow – It is still very early to say this but might be worth taking a look.
Dow Jones and Nasdaq 4H Charts
Dow Jones 4H
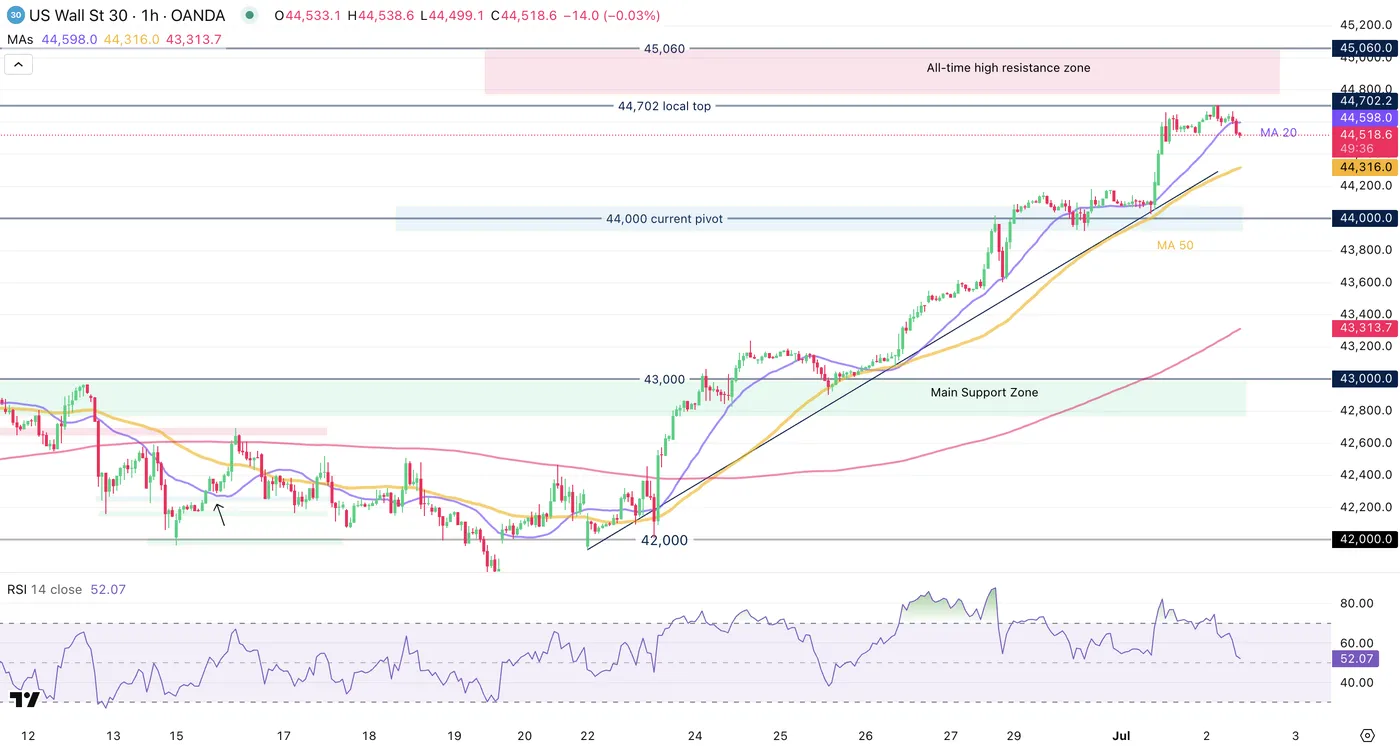
Dow Jones 4H Chart, July 2, 2025 – Source: TradingView
Momentum is back to neutral after yesterday's overbought conditions stopped the bulls in their charge upwards.
Look for immediate support around 44,315 to 44,330, a confluence with the 4H MA 50 and the upwards trendline that is leading current flows.
For bears, look at either a failure to hold the trendline mentioned right before, or at a rejection of the local top at 44,702, which may not be reached if tomorrow's data comes in with a negative surprise.
Nasdaq 4H Chart
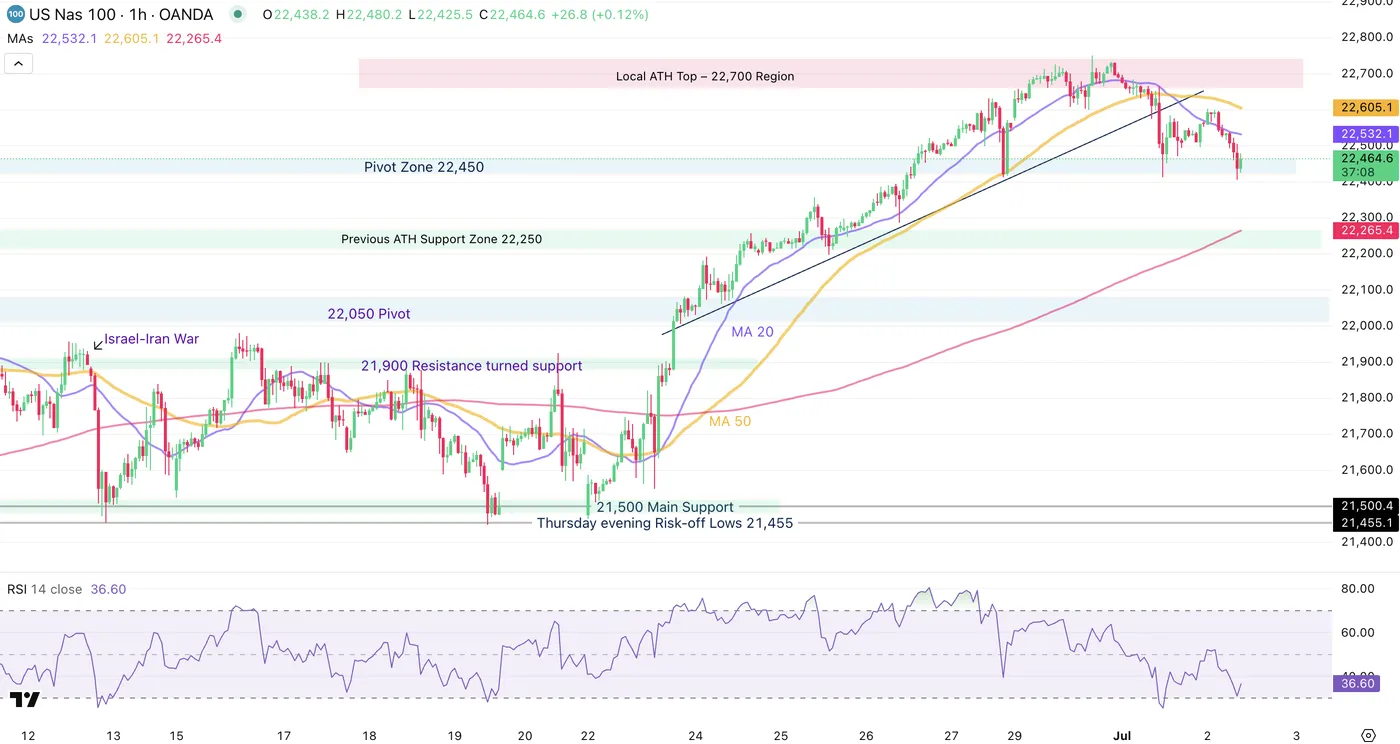
Nasdaq 4H Chart, July 2, 2025 – Source: TradingView
The Nasdaq chart looks more balanced, subject to bear strenght compared to the US 30 chart seen right before.
Prices broke through the upwards trendline that lead to the new All-time high price discovery (22,751 on the CFD) and have started to form what resembles a Head and Shoulders pattern – To supplement that, both the MA 20 and 50 are acting as immediate resistance and are starting to slope downwards.
RSI Momentum is also in the same direction but close to oversold, therefore it will be key to see how markets react to the upcoming Opening Bell.
Levels to watch for the Nasdaq:
- Local ATH Top – 22,700 Region Resistance
- Pivot Zone 22,450
- Previous ATH Support Zone 22,250 (confluence with 4H MA 200)
Safe Trades!
Sunset Market Commentary
Markets
Today was expected to bring market interludium with investors looking forward to the key US payrolls report to be released tomorrow, the One Big Beautifull Bill Act (OBBBA) now being debated for approval in the US House of Congress and first trade agreements between the US and trading partners expected/hoped of to be struck before the July 9 deadline. However trading wasn’t as quite as one could have expected. The approval of the OBBBA in the Senate (admittedly with the thinnest majority possible), after recent bond rally apparently was a good reason for markets to again give some bigger weight to the rising probability of big unsustainable US deficit spending and even higher debt ratios. At the start of US dealings, US ST yields briefly dropped as the ADP job report indicated that the US private sector in June lost 33k jobs, the first negative reading since July 2020. The report temporarily made markets reconsider when the Fed would be able/forced to resume its easing cycle. However, the decline in yields was limited and short-lived. US yields are currently rising between 0.5 bps (2-y) and 7.0 bps (30-y). The German curve follows this broader move with yields rising between 1.5 bp (2-y) and +8.0 bps (30-y; 10-y +9.0 bps includes a benchmark change). Some dovish ECB members (Rehn, Centeno) mentioned the risk of inflation undershooting the target, but for now a wait-and-see approach remains the preferred line of communication. On FX markets, the euro this time doesn’t profit from the softer than expected ADP. ECB comments on a (too) fast rise of the single currency maybe caused a short-term breather on the recent EUR/USD rally. Even so, we still see few reason for a U-turn in the overall USD decline of the dollar (EUR/USD currently near 1.177). DXY also rebounds slightly but just below 97, the technical picture remains fragile going into tomorrow’s payrolls report.
Drama and tears in the UK House of Commons and on UK (bond & FX) markets. UK yields are jumping between 6 bps (2-y) and 20+ bps (30-y) as speculation is growing whether UK Chancellor of the Exchequer will be able to politically survive after the government scrapped deficit-reducing welfare spending cuts, making it impossible for the UK Chancellor to meet her self-imposed budget rules. It also consumes the room for an active growth supportive policy. At the Prime Minister’s questions in Parliament this afternoon, Starmer initially failed to explicitly support his Chancellor, who clearly turned emotional. Whatever her political fate, current developments are a high profile reminder of the fragility of UK public finances, even with some (market) reminiscences to the September 2022 Truss-Kwarteng bond sell-off. Sterling also shows ‘emotional weakness’ with EUR/GBP surpassing the 0.8650 area.
News & Views
Head of the IMF’s European Department Alfred Kammer said the ECB should keep its main policy rate at the current 2% unless new shocks materially change the inflation outlook. Kammer said they are not seeing anything of such magnitude. What they do see instead are two-sided inflation risks, which warrants a cautious monetary approach. They also expect price pressures to be stronger next year than the ECB (1.9% vs 1.6%), in part due to a different view on energy prices. The IMF view contrasts with that of the market, which expects one more cut to 1.75% by the end of the year.
The recently appointed Hungarian central bank (MNB) vice governor Zoltan Kurali was clear as crystal in an interview with news agency Reuters: as long as inflation exceeds the MNB’s tolerance band (3% + 1ppt), rate cuts are off the table. That hasn’t been the case since December 2024 and isn’t pencilled in in the June forecast for all of 2025 either. And even if it would in the near term, for example due to government price caps on food and forcing other sectors including telecom to forego planned fee hikes, Kurali said that there needs to be a sustained – not a single – return towards the 3% midpoint target. Evidence from earlier such caps furthermore suggests that it hits like a boomerang when companies are allowed to adjust prices again. Kurali blamed elevated inflation expectations for price pressures being too strong despite the economy stagnating. A relatively stable forint in the past few weeks should dampen inflation and inflation expectations, he added. EUR/HUF recently returned sub 400 for the first time since March.
EUR/USD Mid-Day Outlook
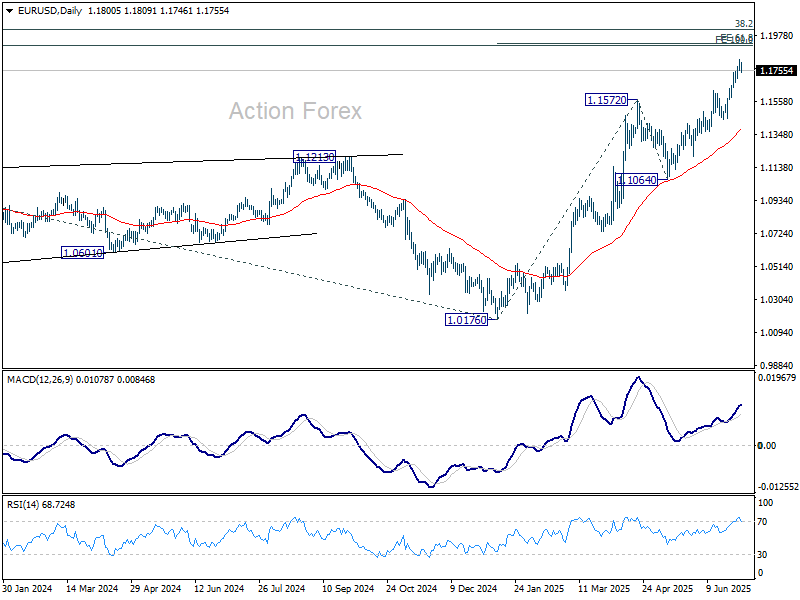
Daily Pivots: (S1) 1.1768; (P) 1.1799; (R1) 1.1837; More...
Intraday bias in EUR/USD is turned neutral with current retreat, and some consolidations could be seen below 1.1829 temporary top. Downside of retreat should be contained by 1.1630 resistance turned support to bring another rally. On the upside, break of 1.1829 will target 61.8% projection of 1.0176 to 1.1572 from 1.1064 at 1.1927.
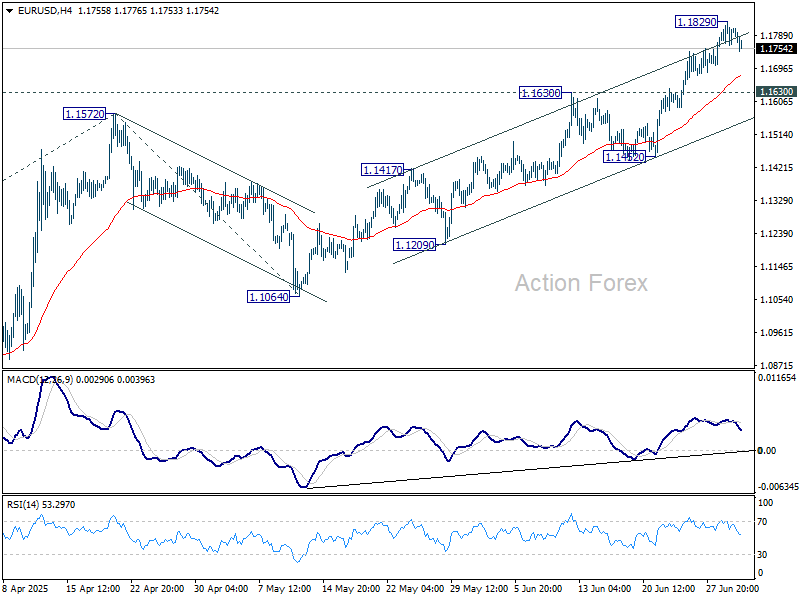
In the bigger picture, rise from 0.9534 long term bottom could be correcting the multi-decade downtrend or the start of a long term up trend. In either case, further rise should be seen to 100% projection of 0.9534 to 1.1274 from 1.0176 at 1.1916. This will now remain the favored case as long as 1.1604 support holds.
GBP/USD Mid-Day Outlook
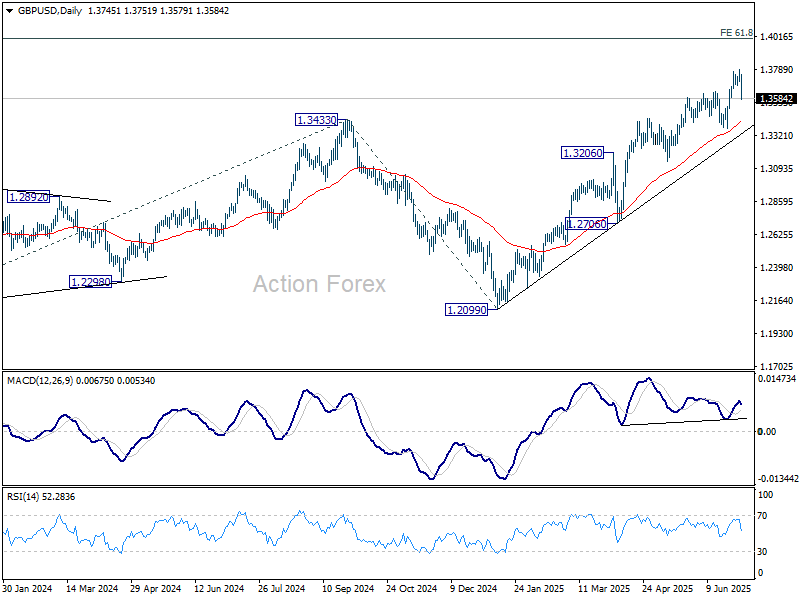
Daily Pivots: (S1) 1.3704; (P) 1.3746; (R1) 1.3789; More...
A temporary top is formed at 1.3787 in GBP/USD with break of 1.3673 minor support. Intraday bias is turned neutral for consolidations. But downside should be contained above 1.3369 support to bring another rally. Firm break of 1.3787 will resume larger rise to 1.4004 projection level next.
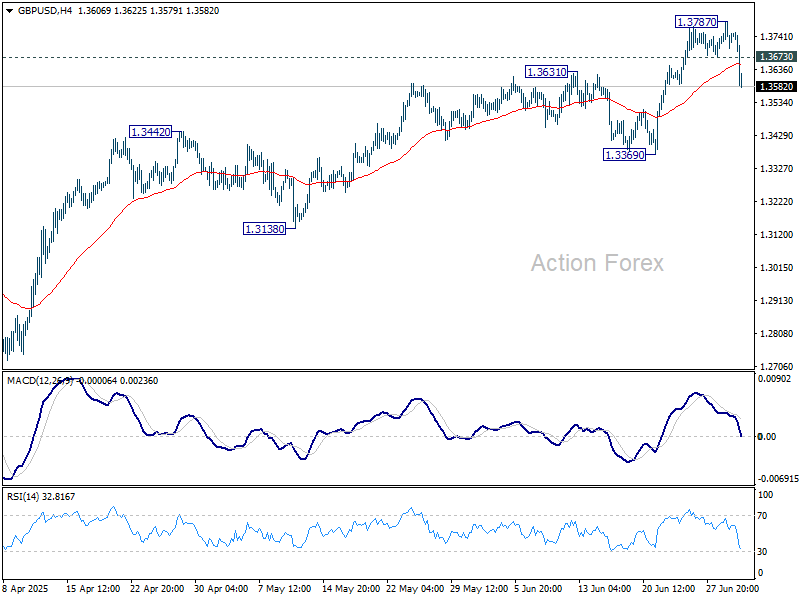
In the bigger picture, up trend from 1.3051 (2022 low) is in progress. Next medium term target is 61.8% projection of 1.0351 to 1.3433 from 1.2099 at 1.4004. Outlook will now stay bullish as long as 55 W EMA (now at 1.2983) holds, even in case of deep pullback.
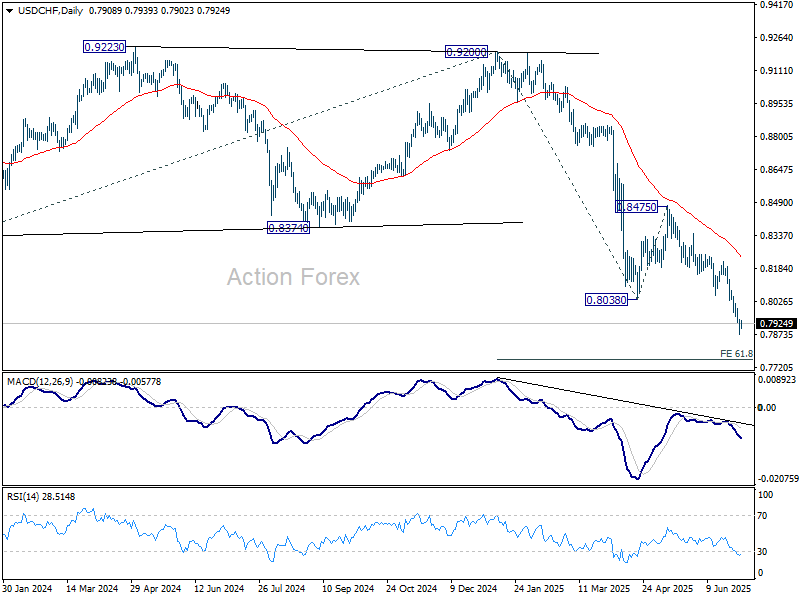
USD/CHF Mid-Day Outlook
Daily Pivots: (S1) 0.7876; (P) 0.7910; (R1) 0.7947; More….
Intraday bias in USD/CHF is turned neutral with current recovery, and some consolidations could be seen. But recovery should be limited by 0.8054 support turned resistance to bring another fall. Below 0.7871 will extend the larger down trend to 61.8% projection of 0.9200 to 0.8038 from 0.8475 at 0.7757. Firm break there will pave the way to 100% projection at 0.7313 next.
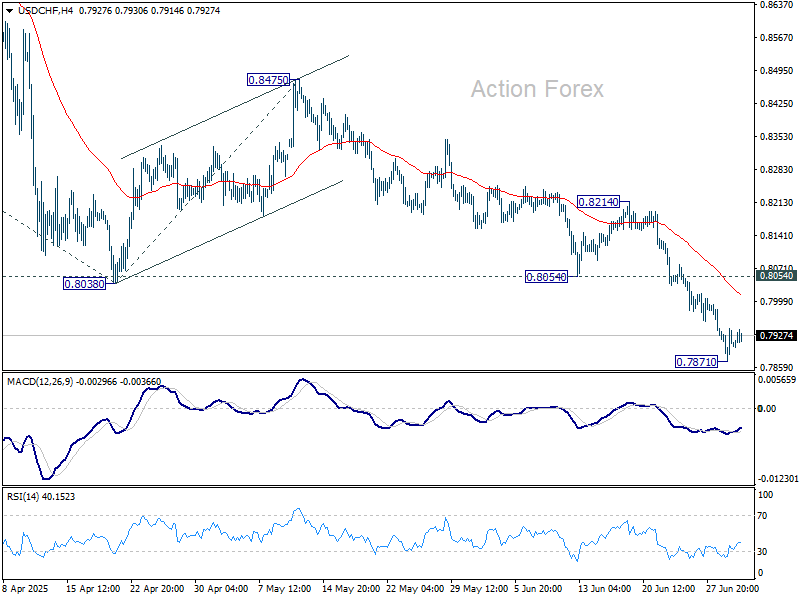
In the bigger picture, long term down trend from 1.0342 (2017 high) is still in progress. Next target is 100% projection of 1.0146 (2022 high) to 0.8332 from 0.9200 at 0.7382. In any case, outlook will stay bearish as long as 0.8475 resistance holds.
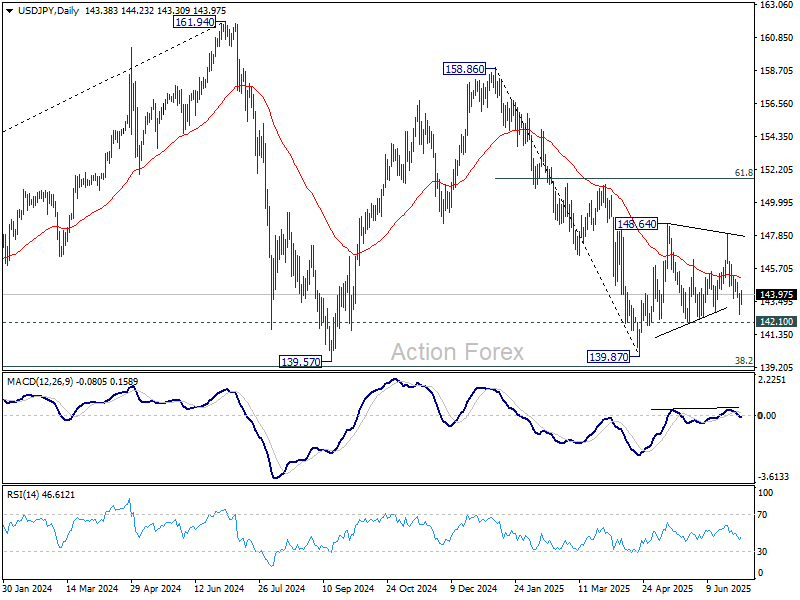
USD/JPY Mid-Day Outlook
Daily Pivots: (S1) 142.64; (P) 143.45; (R1) 144.23; More...
Intraday bias in USD/JPY remains neutral as range trading continues. On the upside, firm break of 148.01 resistance will resume the rise from 139.87 to 61.8% retracement of 158.86 to 139.87 at 151.22. However, break of 142.10 will bring deeper fall back to retest 139.87 low.
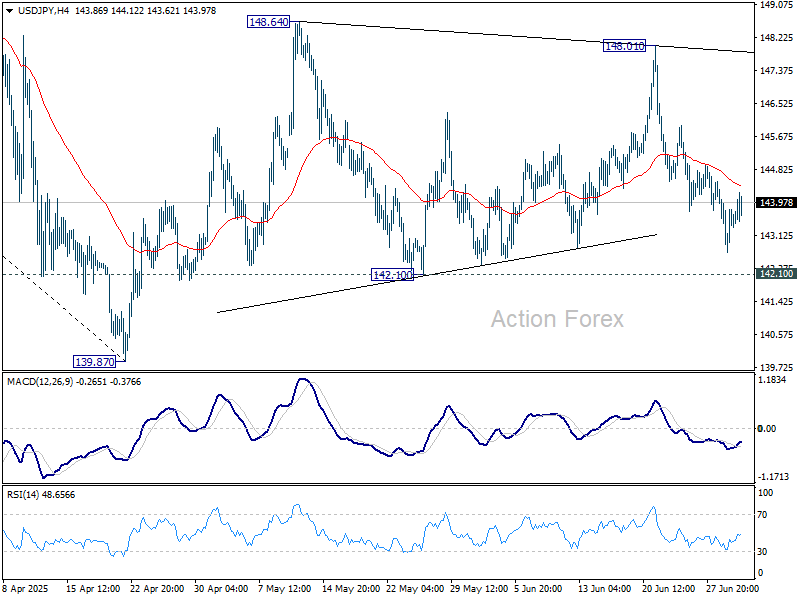
In the bigger picture, price actions from 161.94 are seen as a corrective pattern to rise from 102.58 (2021 low), with fall from 158.86 as the third leg. Strong support should be seen from 38.2% retracement of 102.58 to 161.94 at 139.26 to bring rebound. However, sustained break of 139.26 would open up deeper medium term decline to 61.8% retracement at 125.25.
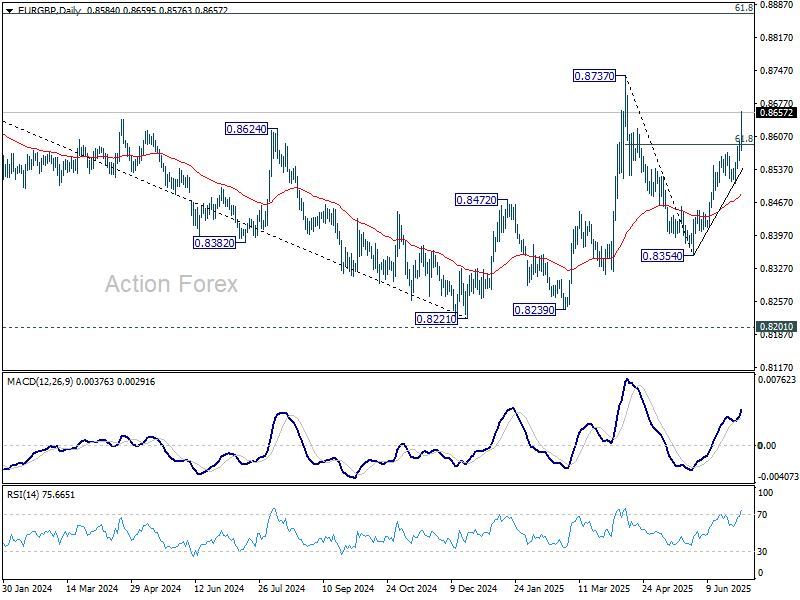
EUR/GBP Mid-Day Outlook
Daily Pivots: (S1) 0.8565; (P) 0.8581; (R1) 0.8605; More...
EUR/GBP's rally from 0.8354 accelerated higher today and powered through 61.8% retracement of 0.8737 to 0.8354 at 0.8591. Intraday bias stays on the upside for retest 0.8737 high. Decisive break there will resume the whole rise from 0.8221 low. On the downside, below 0.8576 minor support will turn intraday bias neutral first.
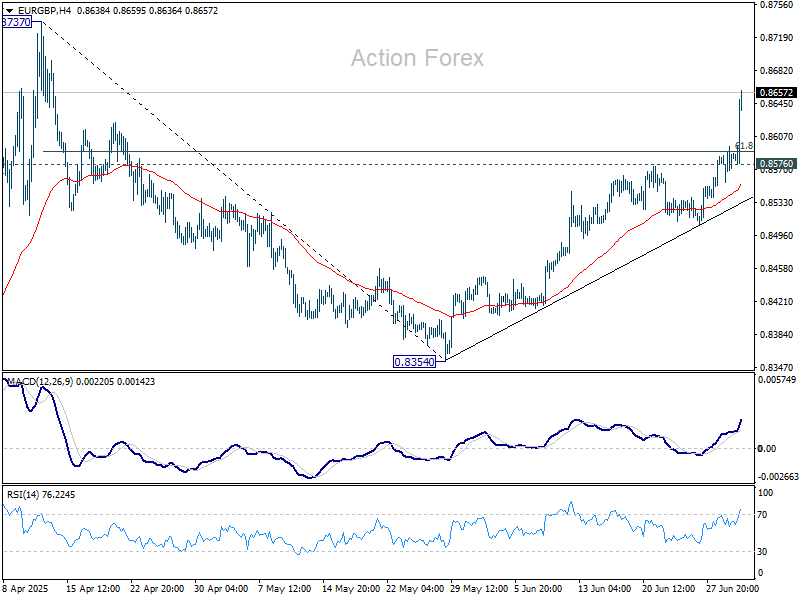
In the bigger picture, the structure from 0.8221 medium term bottom are not impulsive enough to suggest that it's reversing the downside from 0.9267 (2022 high). But even if it's a correction, firm break of 0.8737 will still pave the way to 61.8% retracement of 0.9267 to 0.8221 at 0.8867.