Sample Category Title
USD/JPY Mid-Day Outlook
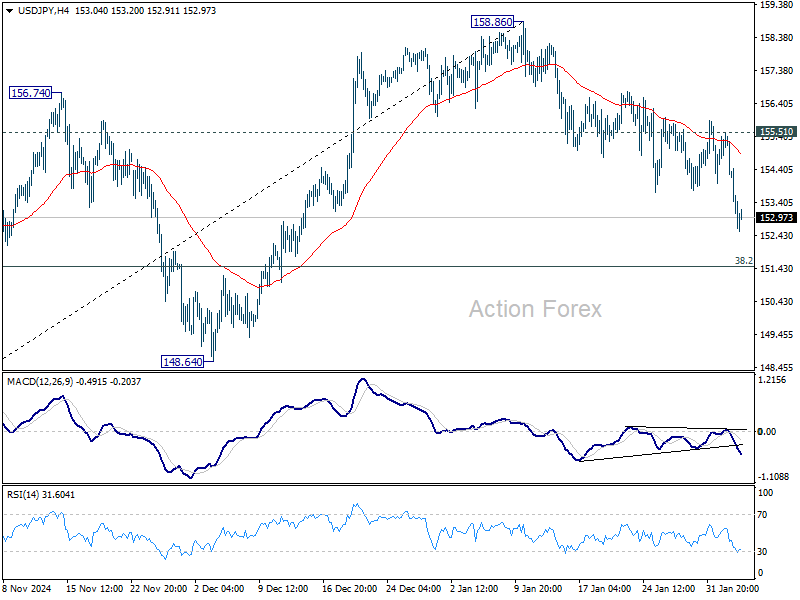
Daily Pivots: (S1) 153.84; (P) 154.68; (R1) 155.18; More...
Intraday bias in USD/JPY remains on the downside for 38.2% retracement of 139.57 to 158.86 at 151.49. Strong support could be seen from there to complete the corrective fall from 158.86 and bring rebound. But further fall will remain in favor as long as 155.51 resistance holds, in case of recovery. Sustained break of 151.49 will raise the chance of bearish reversal.
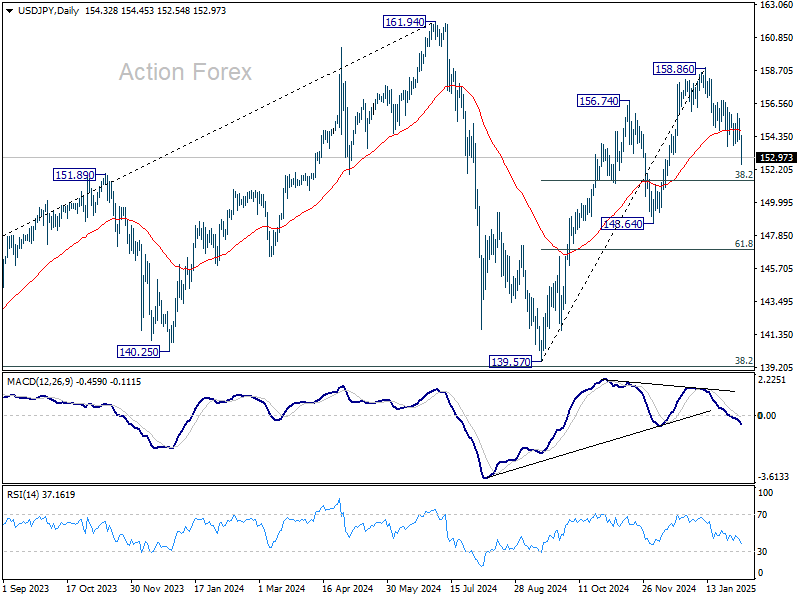
In the bigger picture, price actions from 161.94 are seen as a corrective pattern to rise from 102.58 (2021 low). The range of medium term consolidation should be set between 38.2% retracement of 102.58 to 161.94 at 139.26 and 161.94. Nevertheless, sustained break of 139.26 would open up deeper medium term decline to 61.8% retracement at 125.25.
USD/CHF Mid-Day Outlook
Daily Pivots: (S1) 0.9015; (P) 0.9082; (R1) 0.9117; More…
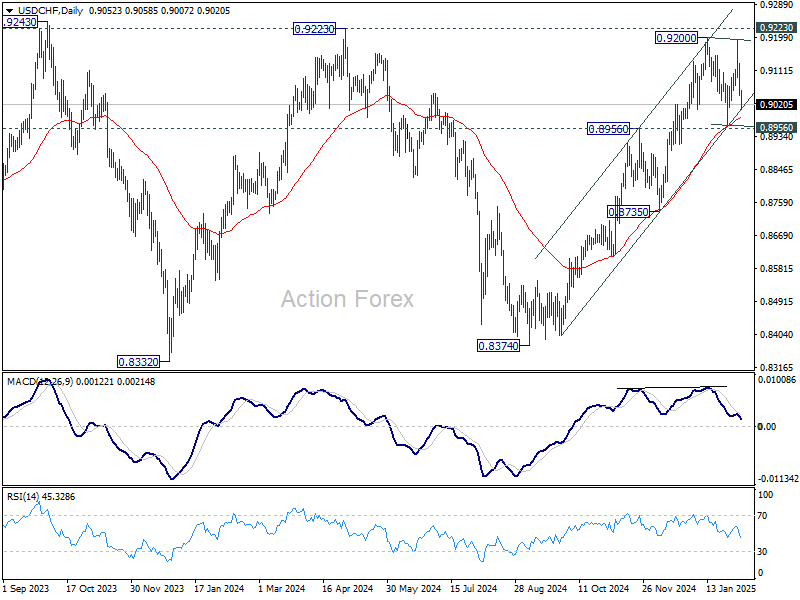
USD/CHF dips further today as consolidation from 0.9200 extends, but stays well above 0.8956/64 support. Intraday bias stays neutral first. Outlook will remain bullish as long as 0.8956/64 support holds. Firm break of 0.9200/9223 will resume the whole rally from 0.8374 and carry larger bullish implication. However, sustained break of 0.8964 will complete a double top reversal pattern, and turn bias to the downside for deeper decline.
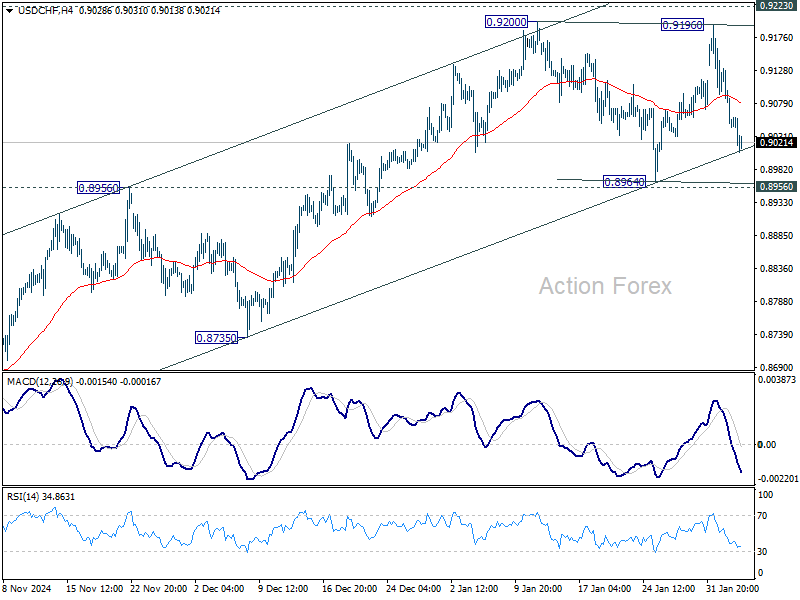
In the bigger picture, decisive break of 0.9223 resistance will argue that whole down trend from 1.0342 (2017 high) has completed with three waves down to 0.8332 (2023 low). Outlook will be turned bullish for 1.0146 resistance next. Nevertheless, rejection by 0.9223 will retain medium term bearishness for another decline through 0.8332 at a later stage.
GBP/USD Mid-Day Outlook
Daily Pivots: (S1) 1.2410; (P) 1.2451; (R1) 1.2524; More...
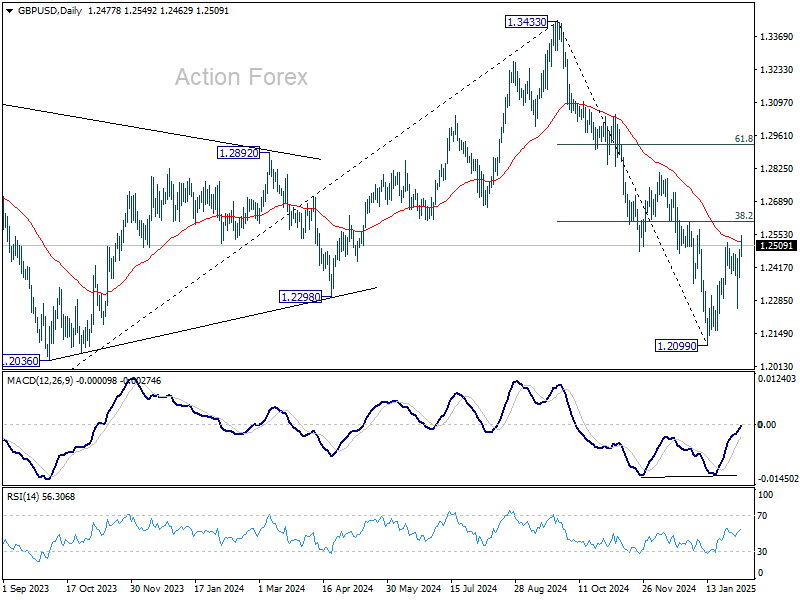
GBP/USD's corrective rebound from 1.2099 extends through 1.2522. But upside is still expected to be limited by 38.2% retracement of 1.3433 to 1.2099 at 1.2609. On the downside, break of 1.2248 support will bring retest of 1.2099 first. Firm break there will resume whole decline from 1.3433. However, decisive break of 1.2609 will raise the chance of near term reversal, and target 61.8% retracement at 1.2923.
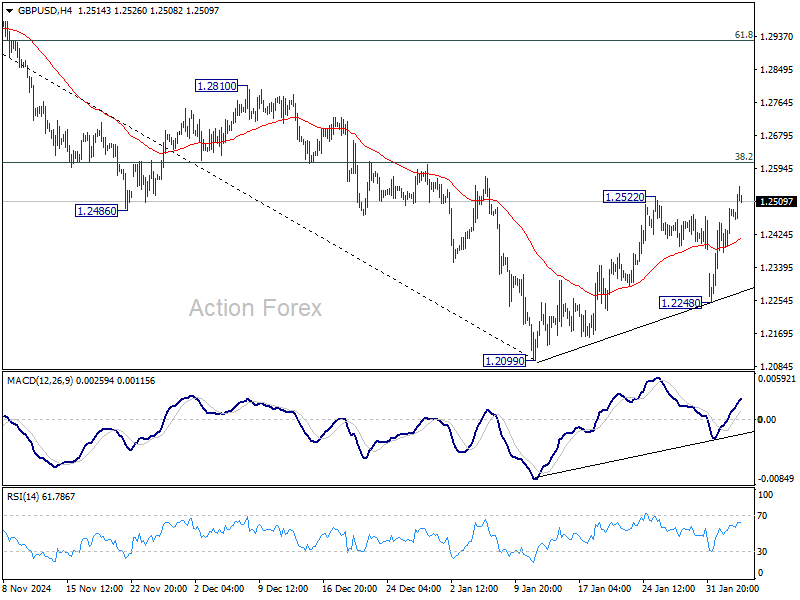
In the bigger picture, rise from 1.0351 (2022 low) should have already completed at 1.3433 (2024 high), and the trend has reversed. Further fall is now expected as long as 1.2810 resistance holds. Deeper decline should be seen to 61.8% retracement of 1.0351 to 1.3433 at 1.1528, even as a corrective move. However, firm break of 1.2810 will dampen this bearish view and bring retest of 1.3433 high instead.
Canada: December Nrings the First Trade Surplus Since February 2024
Canada's merchandise trade balance tallied a first-in-ten-month surplus of $708 million in December. November's deficit was revised higher to $986 million (from $323 million reported earlier).
Merchandise exports accelerated to 4.9% month-on-month (m/m) from 1.9% in November, with gains reported by 8 out of 11 sectors. Energy exports, driven by higher crude oil prices, were once again the biggest driver of exports, accelerating to 9.5% m/m. Exports of metal and non-metallic mineral products (+9.2% m/m) and motor vehicles and parts (+3.9% m/m) also added admirably to the headline tally.
Merchandise imports also moved higher for a third straight month, up by 2.3% m/m in December. The biggest gains came from consumer goods (+4.7% m/m), metal and non-metallic mineral products (+8.7%) and industrial machinery (+5.0% m/m).
In volume terms, merchandise exports rose by 2.6% m/m while imports edged higher by 0.2% m/m.
Canada's merchandise trade surplus with the United States widened to $11.3 billion in December from $8.2 billion the month prior.
Key Implications
Trade finished the quarter on a strong note, with goods likely providing an improved trajectory for Q4 GDP growth. Trade-related uncertainty has likely led companies to stockpile inventories, temporarily boosting trade. Note, Statistics Canada's ongoing transition in trade-related data means these figures should be interpreted with caution.
While the immediate threat of tariffs on Canadian exports has been delayed until next month, the outlook remains uncertain as tariffs are still on the table. Any future tariffs will have negative consequences for economic growth, though the ultimate effect will depend on depth, breadth, duration and retaliation.
EUR/USD Mid-Day Outlook
Daily Pivots: (S1) 1.0305; (P) 1.0346; (R1) 1.0421; More...
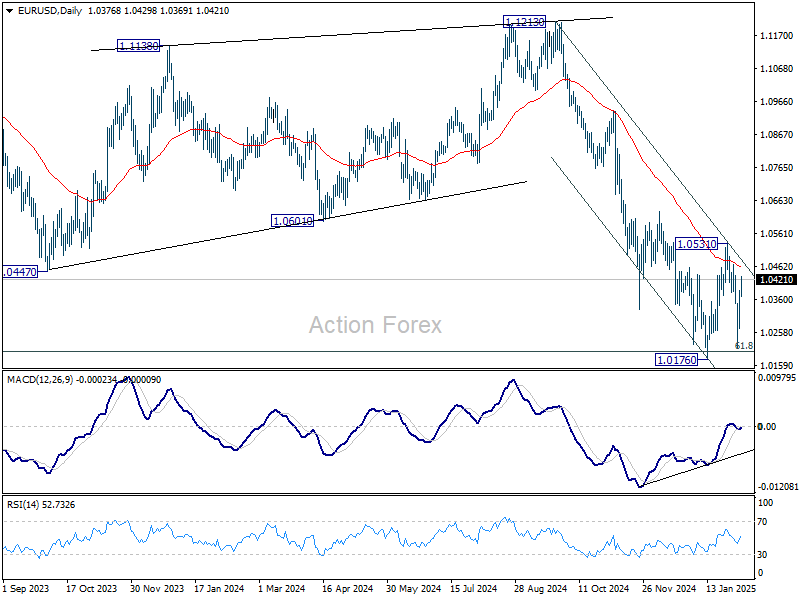
While EUR/USD's recovery from 1.0210 continues today, upside is still limited below 1.0531 resistance. Intraday bias remains neutral and further decline is expected. On the downside, break of 1.0176 will resume whole fall from 1.1213. However, sustained break of 1.0531 will rise the chance of bullish reversal and turn bias back to the upside for stronger rally.
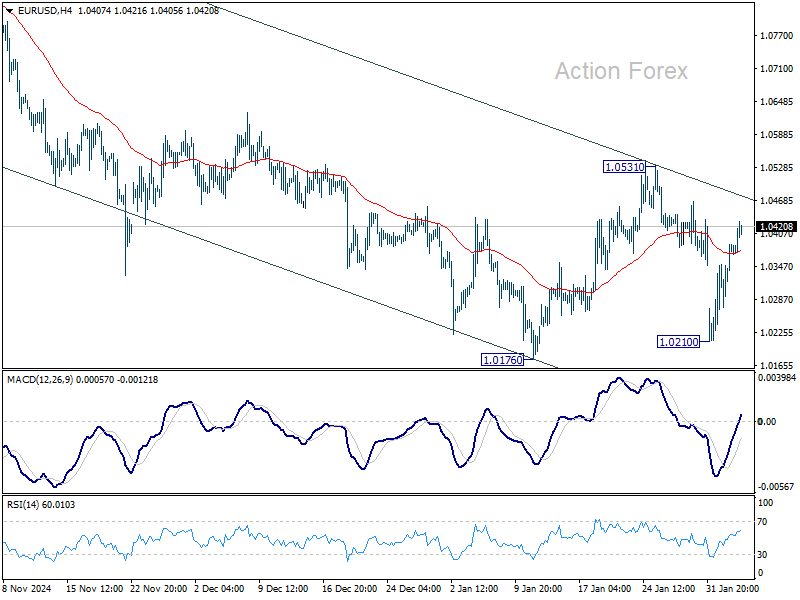
In the bigger picture, immediate focus is back on 61.8 retracement of 0.9534 (2022 low) to 1.1274 (2024 high) at 1.0199. Sustained break there will solidify the case of medium term bearish trend reversal, and pave the way back to 0.9534. However, strong support from 1.0199 will argue that price actions from 1.1274 are merely a corrective pattern, and has already completed.
Dollar Struggles Continue Despite Strong ADP, Caution Prevails
Dollar remains on the backfoot in early US session, despite the strong ADP private employment report. The data highlights continued resilience in the labor market, with services-driven job growth and sustained wage pressures. While this should theoretically reinforce the case for Fed to maintain its pause in easing for longer, traders appear reluctant to react decisively ahead of Friday’s Non-Farm Payroll report, which will provide a more comprehensive labor market picture.
Beyond economic data, uncertainty surrounding US-China trade relations is another key factor keeping traders from placing larger bets on the greenback. The additional 10% duties on Chinese goods remain firmly in place. Traders are monitoring the anticipated phone call between US President Donald Trump and Chinese President Xi Jinping, but no official timeline has been set. The lack of diplomatic engagement has kept market caution elevated.
Adding to the confusion, the US Postal Service reversed its earlier suspension of inbound packages from China and Hong Kong. Instead, it will now work closely with US Customs and Border Protection to enforce the new tariff collection measures more effectively. This aligns with Trump’s decision to close the “de minimis” trade loophole, which previously allowed Chinese e-commerce giants like Temu and Shein to ship goods into the US duty-free in high volumes.
Overall in the forex markets, Canadian Dollar continues to lead gains this week, supported by the avoidance of US tariffs. Japanese Yen follows closely, buoyed by strong wage growth data, which is raising expectations for further rate hikes from BoC. Australian Dollar has also shown some resilience too. Dollar remains the weakest performer, followed by Euro and New Zealand Dollar. Sterling and Swiss Franc are positioned in the middle of the pack.
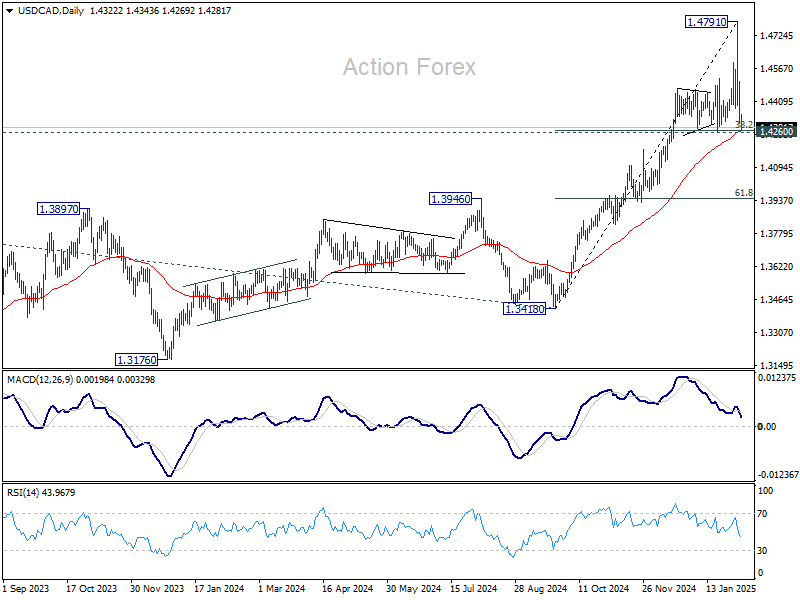
Technically, USD/CAD is now pressing an important cluster support level at 1.4260, with 38.2% retracement of 1.3418 to 1.4791 at 1.4267, and 55 D EMA at 1.4267. Strong support is expected there to complete the pull back from 1.4791 and bring rebound. However, decisive break of 1.4260 will be a sign of broad-based weakness in Dollar for the near term. USD/CAD could dive further to 618% retracement at 1.3942, along with extended selloff in Dollar elsewhere.
In Europe, at the time of writing, FTSE is up 0.37%. DAX is up 0.15%. CAC is down -0.21%. UK 10-year yield is down -0.061 at 4.464. Germany 10-year yield is down -0.0391 at 2.364. Earlier in Asia,Nikkei rose 0.09%. Hong Kong HSI fell -0.93%. China Shanghai SSE fell -0.65%. Singapore Strait Times fell -0.20%. Japan 10-year JGB yield rose 0.0076 to 1.284.
US ADP jobs beats expectations with 183k gain, led by services
US ADP private employment report showed a stronger-than-expected job gain of 183K in January, surpassing market forecasts of 149K.
Service sector was the clear driver of employment, adding 190K jobs, while goods-producing industries shed -6K positions. By company size, small businesses contributed 39K jobs, medium-sized firms led with 92K, and large corporations added 69K.
Wage growth remained elevated, with annual pay increases for job-stayers at 4.7% yoy, while job-changers saw an even stronger 6.8% yoy rise.
According to Nela Richardson, Chief Economist at ADP, the report reveals a "dichotomy" in the labor market, with consumer-facing industries leading the way, while business services and production lag behind.
Eurozone PPI rises 0.4% in Dec, flat annually
Eurozone PPI increased by 0.4% mom in December, slightly below market expectations of 0.5% MoM. On a year-over-year basis, PPI was unchanged, above expectations of a -0.1% yoy decline.
Breaking down the monthly price changes in Eurozone, energy prices saw the biggest increase at 1.4%, followed by durable consumer goods (+0.2%). Capital goods, intermediate goods, and non-durable consumer goods all edged up by 0.1%.
At the EU level, PPI rose 0.4% mom and 0.1% yoy. The biggest price gains were seen in Bulgaria (+5.1%), Croatia (+2.4%), and Slovakia (+1.5%). On the other hand, Ireland (-1.5%), Romania (-1.3%), and the Netherlands (-0.4%) saw the largest declines.
Eurozone PMI services finalized at 51.3, no major growth leap expected
Eurozone Composite PMI was finalized at 50.2 in January, up from 49.6 in December, marking the first month of economic expansion since August. However, PMI Services Index was finalized at 51.3, down from prior month's1.6, suggesting that while the services sector remains in growth territory, momentum is fading.
Among individual countries, Spain led the expansion with a Composite PMI of 54.0. Germany’s index climbed to 50.5, hitting an eight-month high, signaling tentative stabilization. Italy remained in contraction at 49.7, while France improved slightly to 47.6.
According to Cyrus de la Rubia, Chief Economist at Hamburg Commercial Bank, the services sector has been instrumental in preventing a broader economic contraction in the Eurozone. Modest but accelerating new orders and employment offer some optimism that the sector could gain momentum in Q1 2025. However, rising costs in services, particularly due to wage pressures, remain a concern for the ECB.
The services outlook is "modest", with business expectations declining slightly and staying below historical averages since mid-2024. Political uncertainties in the Eurozone, including Germany’s upcoming elections and France’s fragile government, continue to weigh on sentiment.
"No major growth leaps are expected in this sector for now," de la Rubia added.
UK PMI services finalized at 15-month low, stagflation concerns rise
UK PMI Services was finalized at 50.8 in January, slipping from December’s 51.1, marking its joint-lowest level in 15 months. PMI Composite edged up slightly to 50.6, indicating that overall economic activity remains stagnant, with minimal expansion.
According to Tim Moore, Economics Director at S&P Global Market Intelligence, "stagflation conditions appeared to take a firmer hold", with weak output growth coupled with persistent cost pressures. Input cost inflation accelerated for the fifth consecutive month, reaching its highest level since April 2024.
Renewed decline in new business volumes adds to signs that the UK’s economic outlook remains weak, as firms report softening demand conditions. Business confidence has also taken a hit, with expectations for future activity dropping to their lowest level since December 2022.
The most concerning development is the sharp deterioration in employment trends, as service providers cut jobs at the fastest pace in four years. The "twin perils" of shrinking workloads and rising payroll costs has forced many firms to halt recruitment.
Japan’s nominal wage growth surges 4.8% yoy in Dec, real wages rise for second month
Japan’s labor market showed strong wage growth in December, with labor cash earnings surging 4.8% yoy, significantly above expectations of 3.8% yoy and accelerating from 3.9% yoy in the prior month. This marks the 36th consecutive month of annual wage increases.
Regular pay, which includes base salaries, rose 2.7% yoy, while special cash earnings—mainly reflecting winter bonuses—jumped 6.8% yoy, providing an additional boost to workers' disposable income.
Real wages, which adjust for inflation, climbed 0.6% yoy, marking the second straight month of positive growth. This improvement comes despite a notable acceleration in consumer inflation, with the price index used to calculate real wages—excluding rent but including fresh food—rising 4.2% yoy, up from 3.4% yoy in November and reaching the highest level since January 2023.
China’s Caixin PMI services PMI drops to 51.0
China’s Caixin Services PMI slipped to 51.0 in January, down from 52.2 and below expectations of 52.3. PMI Composite also edged lower from 51.4 to 51.1, marking a four-month low, as both manufacturing and services sectors struggled to gain momentum.
According to Caixin Insight Group, while supply and demand conditions showed improvement, services growth lagged behind, pointing to weaker consumer activity.
Wang Zhe, Senior Economist added, "Employment in both sectors fell significantly, and overall price levels remained subdued, particularly factory-gate prices in manufacturing."
New Zealand’s unemployment rate rises to 5.1%
New Zealand’s labor market softened further in Q4, with unemployment rate climbing from 4.8% to 5.1%, in line with expectations and marking the highest level since 2016, excluding the brief spike following the 2020 Covid lockdown.
Employment fell by -0.1% in the quarter, slightly better than the expected -0.2% decline, but still reflecting ongoing weakness in job creation. Meanwhile, wage growth continued to moderate, with the labor cost index rising 0.6% qoq, bringing the annual rate down to 3.3% from 3.8%.
The latest data supports the case for further monetary easing by RBNZ, which remains committed to swiftly bringing the OCR down from the current 4.25% toward neutral level. A 50bps rate cut is still widely anticipated at the upcoming policy meeting this month.
EUR/USD Mid-Day Outlook
Daily Pivots: (S1) 1.0305; (P) 1.0346; (R1) 1.0421; More...
While EUR/USD's recovery from 1.0210 continues today, upside is still limited below 1.0531 resistance. Intraday bias remains neutral and further decline is expected. On the downside, break of 1.0176 will resume whole fall from 1.1213. However, sustained break of 1.0531 will rise the chance of bullish reversal and turn bias back to the upside for stronger rally.
In the bigger picture, immediate focus is back on 61.8 retracement of 0.9534 (2022 low) to 1.1274 (2024 high) at 1.0199. Sustained break there will solidify the case of medium term bearish trend reversal, and pave the way back to 0.9534. However, strong support from 1.0199 will argue that price actions from 1.1274 are merely a corrective pattern, and has already completed.
US ADP jobs beats expectations with 183k gain, led by services
US ADP private employment report showed a stronger-than-expected job gain of 183K in January, surpassing market forecasts of 149K.
Service sector was the clear driver of employment, adding 190K jobs, while goods-producing industries shed -6K positions. By company size, small businesses contributed 39K jobs, medium-sized firms led with 92K, and large corporations added 69K.
Wage growth remained elevated, with annual pay increases for job-stayers at 4.7% yoy, while job-changers saw an even stronger 6.8% yoy rise.
According to Nela Richardson, Chief Economist at ADP, the report reveals a "dichotomy" in the labor market, with consumer-facing industries leading the way, while business services and production lag behind.
Gold: Stagflation Fears Supporting Fresh New All-Time Highs
- 5-year and 10-year US breakeven inflation rates have just staged a major bullish breakout from a two-year plus of basing formation.
- Trade War 2.0 involves the US and other major trading partners that may disrupt international trade and dampen global economic growth.
- The resurgence of stagflation risk has triggered bullish movements on Gold (XAU/USD).
- Watch the US$2,716 key medium-term support on Gold (XAU/USD).
The recent three weeks of sideways movements of the US Dollar Index since its 52-week high of 110.18 printed on 13 January had a positive knock-on effect on gold prices.
Gold (XAU/USD) has staged a bullish breakout from its prior two-month range configuration on 21 January and rocketed by 4.4% to print a fresh intraday current all-time high of US$2,865 at this time of the writing.
Global trade tensions have triggered stagflation fears
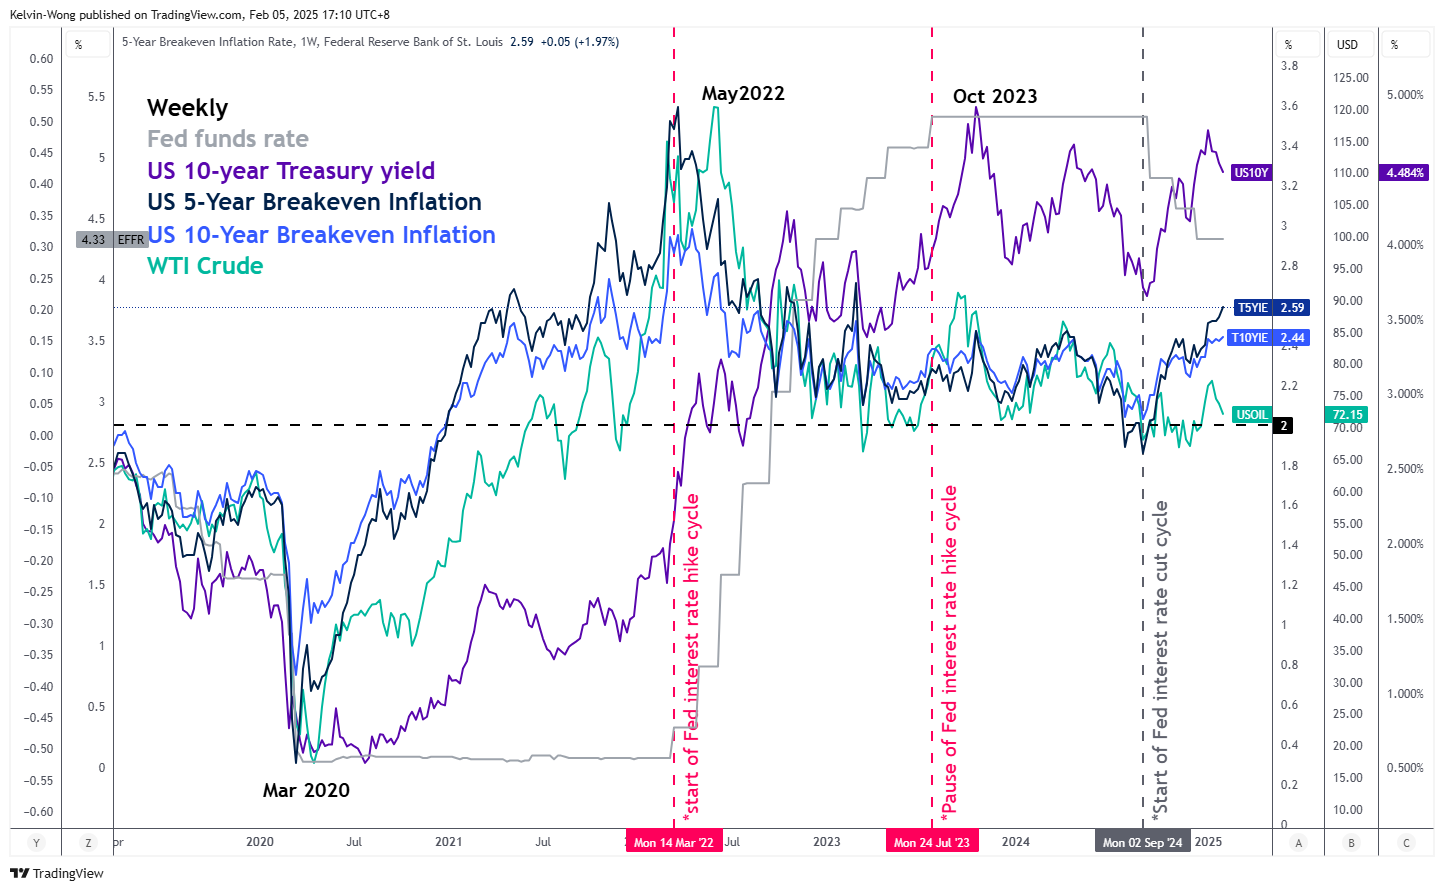
Fig 1: 5-year & 10-year US breakeven inflation rates major trends as of 4 Feb 2024 (Source: TradingView, click to enlarge chart)
US President Trump kickstarted Trade War 2.0 on Saturday, 1 February ordered sweeping tariffs on goods from Canada, Mexico, and China.
Even though the 25% trade tariffs on Canada and Mexico have been delayed for a month, the10% tariffs targeted on Chinese goods are now “lived” and Chinese policymakers have retaliated by imposing 10% to 15% levies on US energy and agricultural exports to China with a targeted kick-in deadline on next Monday, 10 February.
In addition, China has also drawn up plans to disrupt key mineral supply chains in the US and curb business operations of US companies on the mainland. Google has been singled out for antitrust violations, and new export control orders have been issued on tungsten and other critical minerals used in electronic, aviation, and defence industries.
Trade War 2.0 is different from the US-China Trade War 1.0 enacted in January 2018 in terms of coverage as this time round it involves major trading partners of the US, on top of the ongoing US-China Tech War.
Hence, countries that have a significant trade surplus with the US will be at risk of being targeted by Trump’s trade tariffs policy; the European Union, Japan, South Korea, and ASEAN export-dependent countries such as Vietnam, and Malaysia.
If trade negotiations are not able to reach the “middle ground” between the US and the targeted countries, tit-for-tat retaliation measures may escalate, and global trade is likely to be disrupted which in turn can cripple global growth prospects and ignite inflationary pressures.
Market-transacted financial instruments have started to price in a further uptick in US inflationary expectations as derived from the movements of both the 5-year and 10-year US breakeven inflation rates that have been trending upwards since the start of the current Fed’s interest rate cut cycle on September 2024.
Both the 5-year and 10-year US breakeven inflation rates have just staged a major bullish breakout from a two-year plus of basing formation to rally towards 2.59% and 2.44% respectively as of 4 February 2025, above the Fed’s long-term inflation target of 2% (see Fig 1).
These observations suggest the odds of a stagflation environment have increased.
Medium-term bullish momentum remains intact for Gold
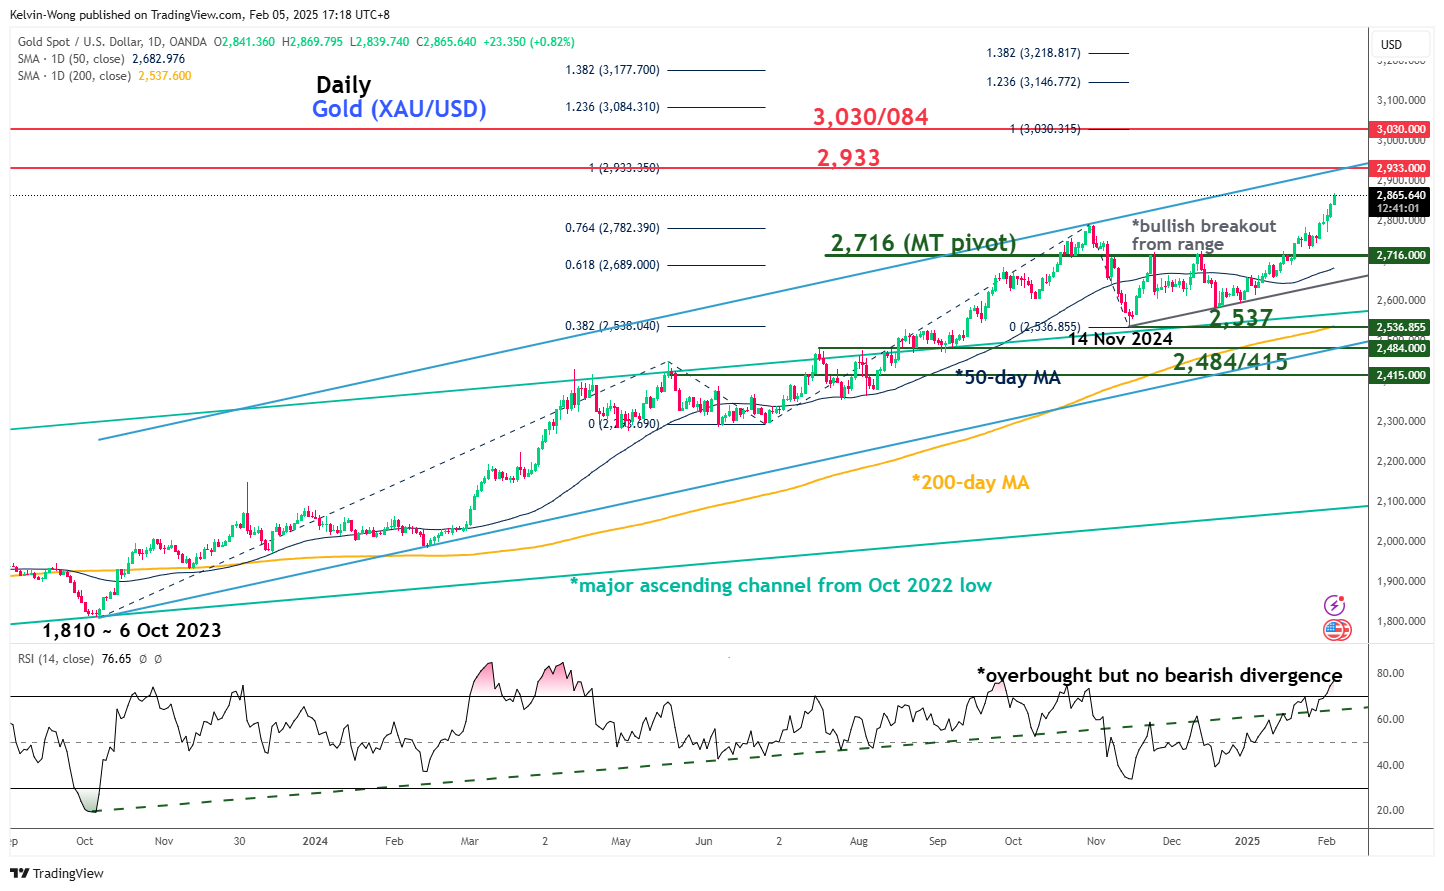
Fig 2: Gold (XAU/USD) medium-term & major trends as of 5 Feb 2025 (Source: TradingView, click to enlarge chart)
Key technical elements of Gold (XAU/USD) have remained constructive for the continuation of its impulsive upmove sequence within its ongoing medium-term (multiweek) and major (multi-month) uptrend phases.
The daily RSI momentum oscillator has reached an overbought region, but it has not flashed out any bearish divergence condition which suggests that the price actions of Gold (XAU/USD) may stage a minor pull-back after its recent swift rally in the past week rather than a medium-term bearish reversal movement.
Watch the US$2,716 key medium-term pivotal support (also the 50-day moving average) with the next medium-term resistances coming in at US$2,933 and US$3,033/3,084 (see Fig 2).
On the other hand, a break below US$2,716 invalidates the bullish scenario for Gold (XAU/USD) to kickstart a potential multi-week corrective decline within its major uptrend phase to expose the next medium-term support at US$2,537 (also the 200-day moving average).
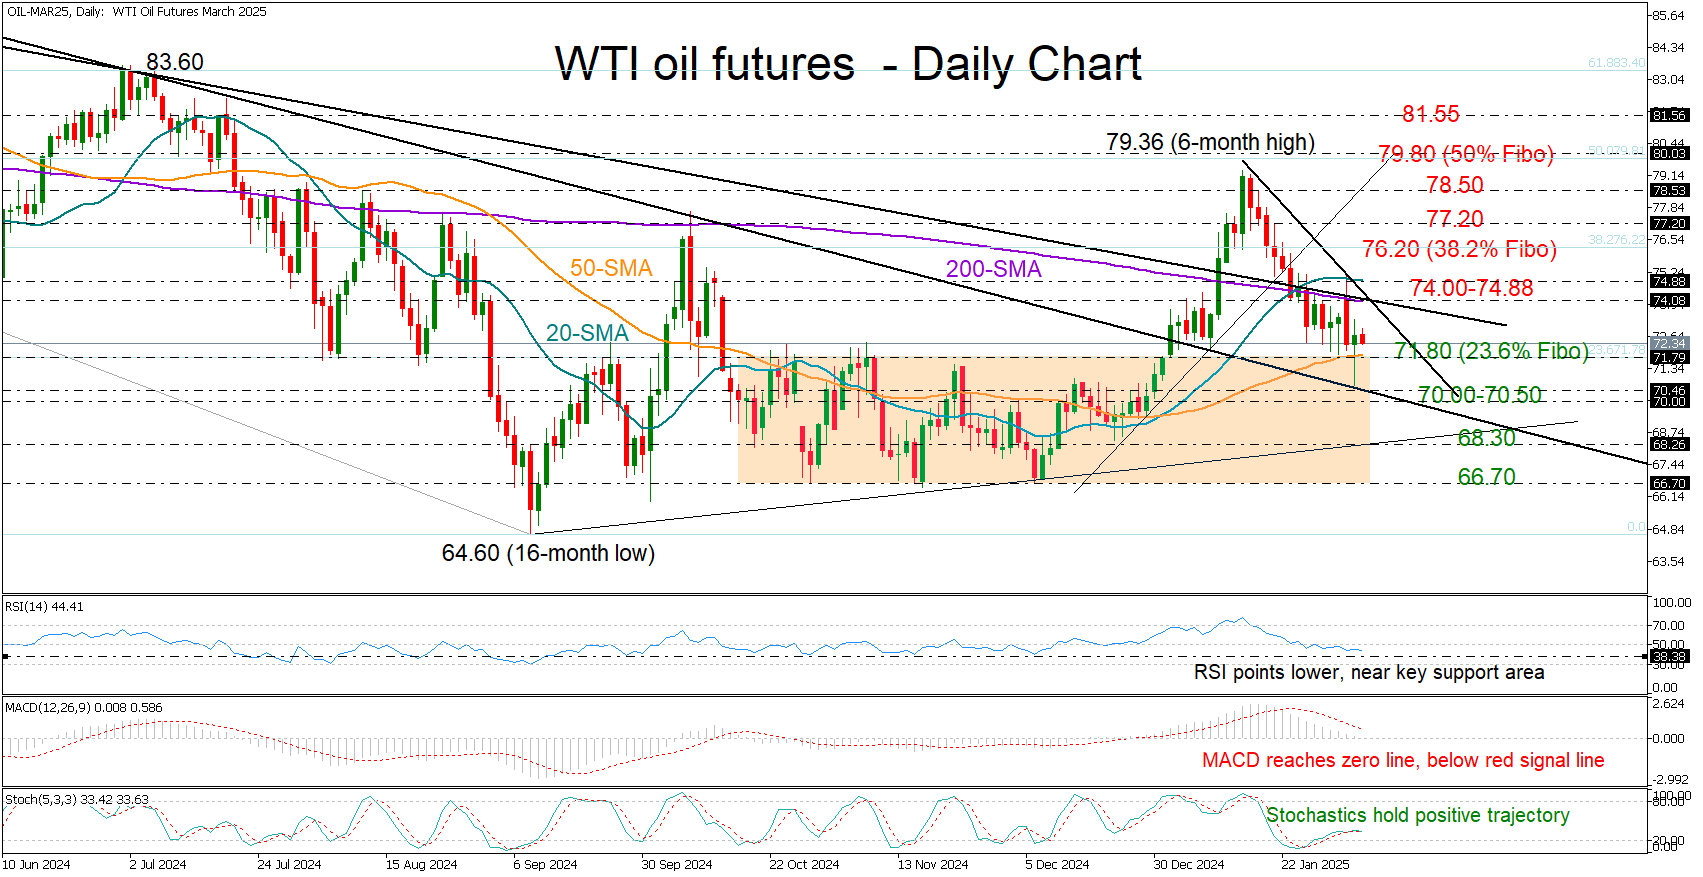
WTI Oil Futures Pivot Within 70 Area
- WTI Oil futures turn higher after reaching 70 zone.
- Technical signals reflect persisting caution.
- Bullish outlook could emerge above 74.00-74.88.
WTI oil futures have been in decline for three weeks, shedding 6% since January’s peak of 79.36. Tuesday’s sharp pullback drove the price to 70.66, but fresh buying interest at a key trendline from the 2023 high helped lift it back above the 50-day simple moving average (SMA).
Technically, downside risks persist as the RSI and MACD continue to slow. However, the RSI is nearing a key pivot zone, and the stochastic oscillator, despite losing momentum, still holds a positive trajectory, leaving room for a potential rebound.
The 74.00-74.88 region, formed by the 200- and 20-day SMAs and key resistance lines, remains a significant barrier. A decisive breakout above this zone could trigger a rally towards 76.20, aligning with the 38.2% Fibonacci retracement of the 2023-2024 downtrend. Further gains could target 77.20 and 78.50, with the 50% Fibonacci retracement at 79.80 acting as the next ceiling.
Conversely, a drop below the 50-day SMA and the 71.80 support area, which overlaps with the 23.6% Fibonacci level could bring the 70.00-70.50 zone back into focus. A deeper decline may test 68.30, while a break below 66.70 would send stronger bearish signals.
WTI oil futures continue to face a blurry outlook after three weeks of losses. A strong move above 74.00-74.88 might be crucial to shifting momentum in favor of the bulls.
USD/JPY: Falls to 7-Week Low as Strong Japanese Wage Growth Boosts Bets for BoJ Rate Hike
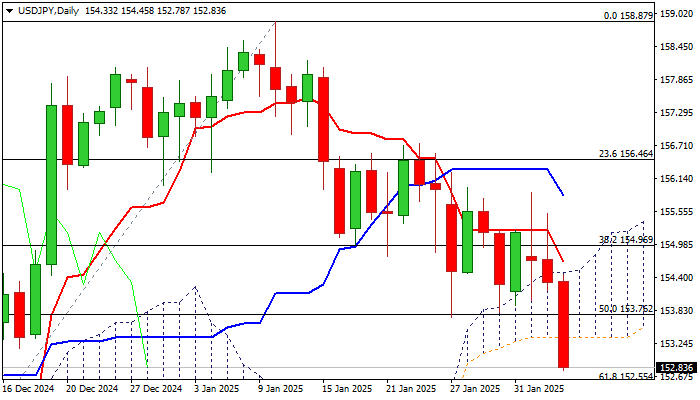
USDJPY fell nearly 0.9% in Asian – early European trading on Wednesday as the dollar remains at the back foot for the third straight day, while yen received fresh boost from stronger than expected rise of earnings in Japan that adds to scenario of more BoJ rate hikes.
Today’s drop below temporary base / 50% retracement of 148.64/158.87 (153.76) and base of thickening daily cloud (153.36) generated fresh signals of continuation of short-term downtrend from 158.87 (2025 peak, posted on Jan 10).
Bears cracked 200DMA (152.77) which marks the upper boundary of 152.77/41 support zone, consisting of 200DMA / Fibo 61.8% / 100DMA.
Firm break here is needed to validate reversal signal and open way for deeper correction of Sep/Jan 139.57/158.87 rally and expose targets at 151.50 (Fibo 38.2% of 139.57/158.87) and 151.00 (round figure).
Caution on potential headwinds bears may face at this zone, with limited upticks to offer better selling opportunities as daily studies are in predominantly bearish configuration.
Releases of US ADP private sector payrolls report, Dec trade balance and January Services PMI will be closely watched today.
Res: 153.36; 153.76; 154.49; 154.70.
Sup: 152.55; 152.36; 152.00; 151.50.