
Sample Category Title
Trade Idea Wrap-up: USD/CHF – Buy at 0.9915
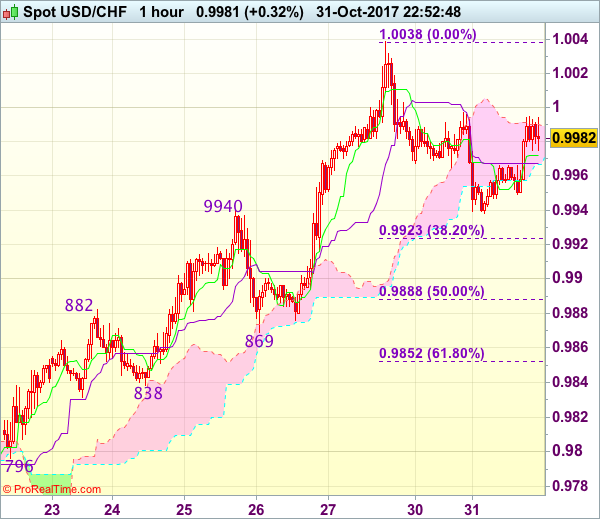
USD/CHF - 0.9982
Most recent candlesticks pattern : N/A
Trend : Up
Tenkan-Sen level : 0.9972
Kijun-Sen level : 0.9967
Ichimoku cloud top : 0.9990
Ichimoku cloud bottom : 0.9967
Original strategy :
Buy at 0.9915, Target: 1.0030, Stop: 0.9880
Position : -
Target : -
Stop : -
New strategy :
Buy at 0.9915, Target: 1.0030, Stop: 0.9880
Position : -
Target : -
Stop : -
Although dollar has recovered from 0.9938, reckon 1.0000 would limit upside and near term downside risk remains for the corrective fall from 1.0038 (last week’s high) to bring retracement of recent rise to 0.9920-25 (38.2% Fibonacci retracement of 0.9737-1.0038), however, reckon 0.9905-10 would limit downside and bring another rise later, above 1.0000 would bring retest of said resistance at 1.0038, break there would extend recent rise from 0.9421 low to 1.0050-55, then towards 1.0075-80 but price should falter below 1.0100 resistance.
In view of this, we are looking to buy dollar again on pullback as 0.9915-25 should limit downside, bring another rise later. Below 0.9885-90 (50% Fibonacci retracement of 0.9737-1.0038) would defer and suggest top is possibly formed, risk test of support at 0.9869.
Trade Idea Wrap-up: GBP/USD – Hold short entered at 1.3255
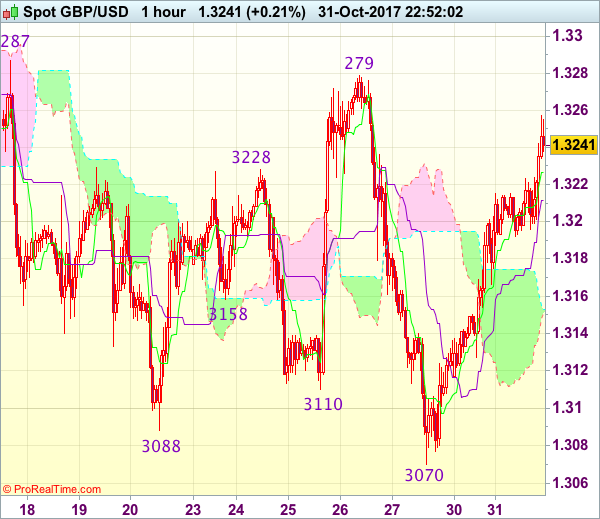
GBP/USD - 1.3243
Most recent candlesticks pattern : N/A
Trend : Sideways
Tenkan-Sen level : 1.3227
Kijun-Sen level : 1.3212
Ichimoku cloud top : 1.3153
Ichimoku cloud bottom : 1.3152
Original strategy :
Sold at 1.3255, Target: 1.3135, Stop: 1.3290
Position : - Short at 1.3255
Target : - 1.3135
Stop : - 1.3290
New strategy :
Hold short entered at 1.3255, Target: 1.3135, Stop: 1.3290
Position : - Short at 1.3255
Target : - 1.3135
Stop : - 1.3290
As cable has maintained a firm undertone after staging a strong rebound from 1.3070, suggesting near term upside risk remains for marginal gain, however, as broad outlook remains consolidative, reckon upside would be limited and indicated strong resistance at 1.3279-87 would remain intact, bring retreat later, below 1.3190 would suggest an intra-day top is formed, bring weakness to 1.3150-55 but break of 1.3120-25 is needed to signal the rebound from 1.3070 has ended, then further fall to 1.3100, then retest of 1.3070 would follow.
In view of this, we are holding on to our short position entered at 1.3255. Only above indicated strong resistance at 1.3279-87 would abort and shift risk to the upside for the erratic rise from 1.3027 low is still in progress for further gain to 1.3300-10, then towards 1.3340-50.
Trade Idea Wrap-up: EUR/USD – Sell at 1.1700
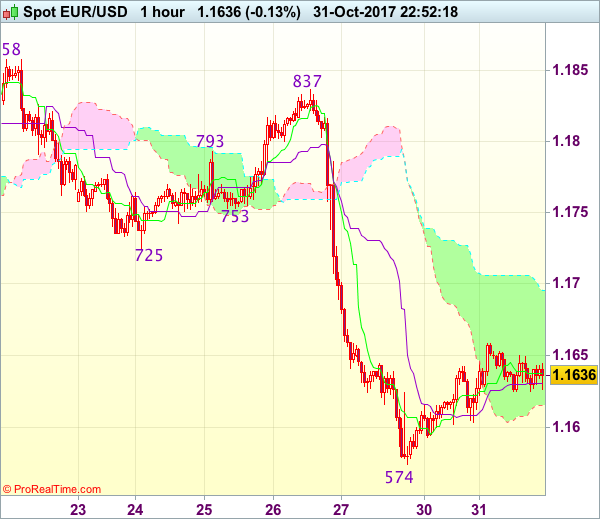
EUR/USD - 1.1635
Most recent candlesticks pattern : N/A
Trend : Down
Tenkan-Sen level : 1.1637
Kijun-Sen level : 1.1631
Ichimoku cloud top : 1.1696
Ichimoku cloud bottom : 1.1615
Original strategy :
Sell at 1.1700, Target: 1.1595, Stop: 1.1735
Position : -
Target : -
Stop : -
New strategy :
Sell at 1.1700, Target: 1.1595, Stop: 1.1735
Position : -
Target : -
Stop : -
Euro’s recovery after falling to 1.1574 late last week has retained our view that further consolidation above this level would be seen and corrective bounce to 1.1660-65 cannot be ruled out, however, reckon upside would be limited to the upper Kumo (now at 1.1706) and bring another decline later, below said support at 1.1574 would extend recent decline from 1.2093 top to 1.1550-55 but loss of downward momentum should prevent sharp fall below 1.1520-25 and reckon 1.1500 would hold from here.
In view of this, we are looking to sell euro on subsequent recovery as the upper Kumo (now at 1.1706) should limit upside and bring another decline. Only above previous support at 1.1725 (now resistance) would signal low is formed instead, bring retracement of recent decline to 1.1750-55 first.
Trade Idea Update: USD/JPY – Sell at 114.10
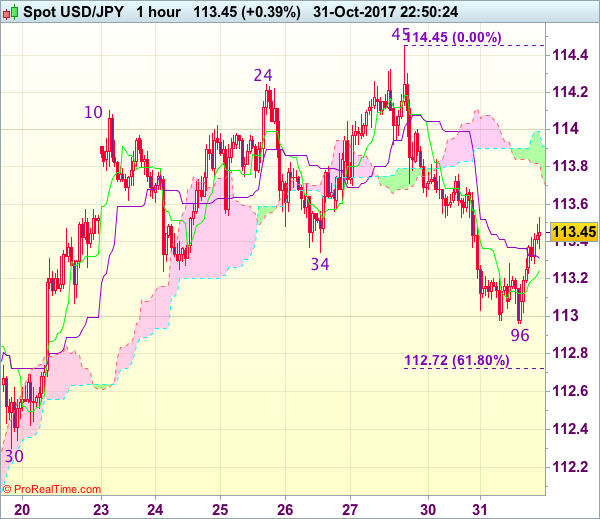
USD/JPY - 113.43
Most recent candlesticks pattern : N/A
Trend : Near term up
Tenkan-Sen level : 113.25
Kijun-Sen level : 113.31
Ichimoku cloud top : 113.99
Ichimoku cloud bottom : 113.82
Original strategy :
Sell at 114.00, Target: 113.00, Stop: 114.35
Position : -
Target : -
Stop : -
New strategy :
Sell at 114.10, Target: 113.00, Stop: 114.45
Position : -
Target : -
Stop : -
As the greenback has rebounded after finding support just below 113.00, suggesting consolidation above 112.96 intra-day low would be seen and initial recovery to 113.70-75 is likely, however, reckon upside would be limited to 114.00-10 and price should falter well below resistance at 114.45-50, bring another retreat later, below said support at 112.96 would add credence to our view that top has been made, bring retracement of recent upmove to 112.70-75 (61.8% Fibonacci retracement of 111.65-114.45) but oversold condition should limit downside to 112.50 and reckon previous support at 112.30 would hold.
In view of this, we are looking to sell dollar on recovery but at a higher level as 114.00-10 should cap upside and bring another decline. Above 114.25 would signal the retreat from 114.45 has ended, bring retest of indicated strong resistance at 114.45-50 which is likely to hold on first testing.
Eurozone GDP Accelerates in Q3, but Inflation Remains Weak
Third quarter GDP growth in the Eurozone beat consensus expectations, rising 2.5 percent year-over-year. The recovery appears to be increasingly broad-based, but inflation has remained quite tame.
Third Quarter Print Reaches New Cycle High
Real GDP in the Eurozone expanded 2.5 percent year-over-year in Q3, the fastest year-over-year growth rate since Q1-2011. Real GDP grew 0.6 percent on a quarterly basis (not annualized), and both the quarterly and year-ago growth rates were above the Bloomberg consensus.
While Q3 GDP data broken down into its underlying demand components are not yet available, today's print is in line with the continued improvement in the Eurozone economy over the past few quarters. Data released this morning on the French economy, one of the largest in the Eurozone, offer a glimpse into economic growth in the Eurozone on a more detailed level. Real GDP in France accelerated to a 2.2 percent year-overyear pace, the strongest growth since 2011, and the underlying data affirmed continued broad-based growth for the quarter, with household consumption, business fixed investment and public sector expenditures all accelerating on a year-over-year basis.
A strengthening labor market in the Eurozone likely helped boost Q3 output. Eurozone unemployment data released today showed the unemployment rate at 8.9 percent for September, down from a revised 9.0 percent in August and the 9.6 percent rate registered to start 2017.
Stagnant Price Pressures Remain Area to Watch
Overall output growth and unemployment data reinforce positive economic trends, but inflation in the Eurozone maintained its sluggish pace of growth in October. Advance estimates for CPI inflation showed price growth of just 1.4 percent year-over-year, below the consensus of 1.5 percent. Core CPI excluding food and energy also displayed weakness, with inflation of just 0.9 percent year-over-year. Core CPI growth had been showing some signs of accelerating over the past few months with readings north of 1 percent, but this morning's reading shows a loss of momentum.
Tame inflation was a key factor in the European Central Bank's (ECB) decision last week to reduce its monthly asset purchases but extend the program through September 2018 "or beyond, if necessary". The ECB's move to taper its purchases from €60 billion a month to €30 billion a month starting in January reflects the strengthening and broad-based economic recovery taking hold in Europe. However, with inflation in the euro area remaining benign, a complete removal of policy accommodation remains too aggressive a move for policymakers. The central bank kept its three policy rates unchanged, and it continued to stress that they would "remain at their present levels for an extended period of time, and well past the horizon of our net asset purchases." In short, rate hikes in the Eurozone are likely some ways off still.
CAC Edges Higher on Solid French Data
The CAC index continues to have a quiet week. Currently, the CAC is trading at 5,500.00, up 0.11% on the day. France released key economic data on Tuesday. Flash GDP remained at 0.5% in the third quarter, matching the estimate. The economy has been steady, as consumer spending has improved and business investment remains strong. Consumer Spending rebounded with a gain of 0.9%, beating the estimate of 0.6%. Preliminary CPI improved to 0.1%, matching the forecast. Eurozone data was mixed, as CPI Flash Estimate missed the estimate, while Preliminary Flash GDP beat the forecast. On Wednesday, the Federal Reserve will be in the spotlight, as the FOMC releases its monthly rate statement.
Eurozone indicators were a mix on Tuesday. CPI Flash Estimate edged down to 1.4%, shy of the forecast of 1.5%. Core CPI Flash Estimate dipped to 0.9%, short of the estimate of 1.1%. There was better news from Preliminary Flash GDP, which remained unchanged at 0.6%, above the estimate of 0.5%. On the employment front the unemployment rate head lower, dropping to 8.9%. This is the lowest level since March 2009. The ECB has announced that it will begin tapering its asset purchase program, as the eurozone economy has rebounded in 2017. Still, inflation remains persistently below the ECB's target of around 2 percent. The asset purchase program has been extended to April 2018, but the ECB could implement an extension if economic data tails off or if inflation fails to move upwards.
The uncertainty and tension remain at fever pitch in Catalonia. The central government has dissolved the Catalan government and parliament, after imposing direct rule on Catalonia. The Catalan government declared independence just before Madrid invoked Article 155 of Spain's constitution. The Spanish government has drawn up charges of rebellion against Catalan President Carles Puidgemont, but he has skipped town, and is reportedly in Belgium. It remains unclear what Puidgemont will do next – he could request political asylum or even declare a government-in-exile. Elections have been slated for December 21, and two parties from Puidgemont's coalition have declared they will participate in the election. With Catalans split down the middle on independence, this saga is likely to continue for some time.
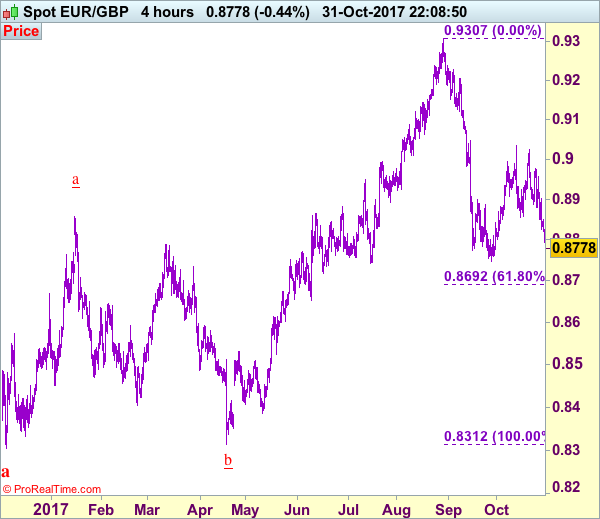
Trade Idea: EUR/GBP – Sell at 0.8885
EUR/GBP - 0.8785
Original strategy :
Sell at 0.8900, Target: 0.8755, Stop: 0.8940
Position : -
Target : -
Stop : -
New strategy :
Sell at 0.8885, Target: 0.8755, Stop: 0.8915
Position : -
Target : -
Stop : -
As the single currency has remained under pressure after recent selloff, suggesting the decline from 0.9033 top is still in progress and may extend further weakness towards previous support at 0.8746-50, however, break there is needed to confirm early decline from 0.9307 has resumed and extend fall to 0.8720, having said that, near term oversold condition should limit downside and reckon 0.8700 would hold from here.
In view of this, we are looking to sell euro again on recovery, above 0.8845-50 would bring corrective bounce to 0.8880-85 where renewed selling interest should emerge and bring another decline later. Only above 0.8957 resistance would abort and shift risk to upside for test of 0.8976 but reckon upside would be limited to 0.9000 and said resistance at 0.933 should remain intact, bring another decline later.
Our preferred count is that, after forming a major top at 0.9805 (wave V), (A)-(B)-(C) correction is unfolding with (A) leg ended at 0.8400 (A: 0.8637, B: 0.9491 and 5-waver C ended at 0.8400. Wave (B) has ended at 0.9413 and impulsive wave (C) has either ended at 0.8067 or may extend one more fall to 0.8000 before prospect of another rally. Current breach of indicated resistance at 0.9043 confirms our view that the (C) leg has ended and bring stronger rebound towards 0.9150/54, then towards 0.9240/50.
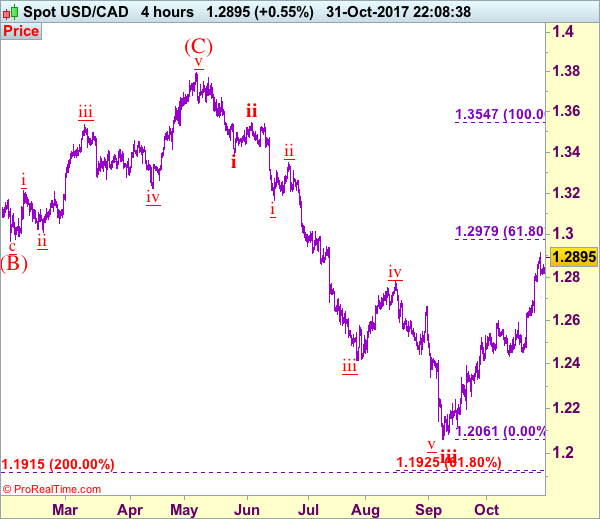
Trade Idea: USD/CAD – Buy at 1.2755
USD/CAD - 1.2893
Trend: Near term up
Original strategy :
Buy at 1.2755, Target: 1.2955, Stop: 1.2695
Position: -
Target: -
Stop: -
New strategy :
Buy at 1.2755, Target: 1.2955, Stop: 1.2695
Position: -
Target: -
Stop:-
As the greenback has maintained a firm undertone after recent rally, adding credence to our view that the rise from 1.2061 low is still in progress and mild upside bias remains for this move from there (wave iii trough) to extend gain to 1.2950, having said that, as we are still treating this rebound from 1.2061 as wave iv, reckon 1.2975-80 (61.8% Fibonacci retracement of wave iii) would limit upside and 1.3000 should hold, bring selloff later in wave v. We are keeping our count that wave v as well as wave (C) ended at 1.3794 and impulsive wave (i ii, i ii) is now unfolding with minor wave iii ended at 1.2414, followed by wave iv correction ended at 1.2778, wave v has reached our indicated downside target at 1.2100 and may extend to 1.2000.
In view of this, we are looking to reinstate long on subsequent pullback as 1.2750-55 should limit downside and bring another rise. Below 1.2725-30 would defer and suggest a temporary top is possibly formed, bring correction to 1.2690-00 but break of support at 1.2635-40 is needed to confirm, bring weakness to 1.2610-15, then test of 1.2591.
To recap, wave B from 1.3066 is unfolding as an a-b-c and is sub-divided as a: 1.2192, b: 1.2716 and wave c is a 5-waver with i: 1.1983, ii: 1.2506, extended wave iii with minor iii at 1.0206, wave iv ended at 1.0781 and wave v as well as wave iii has ended at 0.9931, hence the subsequent choppy trading is the wave iv which is unfolding as (a)-(b)-(c) with (a) leg of iv ended at 1.0854, followed by (b) leg at 1.0108 and (c) leg as well as the wave iv ended at 1.0674. The wave v is sub-divided by minor wave (i): 0.9980, (ii): 1.0374, (iii): 0.9446, (iv): 0.9913 and (v) as well as v has possibly ended at 0.9407, therefore, consolidation with upside bias is seen for major correction, indicated target at 1.3700 and 1.4000 had been met and further gain to 1.4700 would be seen later.
US: ECI Shows More Signs of Rising Labor Costs
Employment costs rose 0.7 percent in the third quarter and are up 2.5 percent over the past year. A tight labor market points to further strengthening ahead.
Compensation Costs Quicken in Q3
In another sign of a tight labor market, employment costs rose 0.7 percent in the third quarter. At 2.5 percent, the employment cost index (ECI) is just shy of the post-recession high hit briefly in 2015 and is ahead of the 2.3 percent increase registered this time last year.
The third quarter increase was driven by a pickup in both wages & salaries and benefits. Wages & salaries rose 0.7 percent, one of the strongest quarterly gains this expansion. Excluding incentive paid occupations, wages & salaries rose a bit more modestly (up 0.6 percent), but have increased in line with all workers at 2.5 percent over the past year. Growth in wages & salaries was led by the private sector, with particularly strong gains in professional & business services, manufacturing and transportation & warehousing.
Wage costs in the private sector continue to outpace the government sector. In contrast, benefit costs continue to rise more quickly for government workers, up 0.8 percent versus 0.7 percent for private sector workers in Q3. In recent years, benefits costs have been growing more in line with wages & salaries as employer spending on health benefits has slowed to its lowest rate on record. This may be due in part to employers passing more of the cost burden onto employees and/or employees switching to slimmer plans in an effort to reduce their own spending on healthcare.
Employment Costs Expected to Pick Up Further
The strengthening in employment costs, particularly the wages & salaries component, is consistent with the firming in average hourly earnings. Looking at the drivers of both average hourly earnings and the ECI, we expect to see wages and compensation costs pick up over the coming year. The unemployment rate has fallen below both the Fed and Congressional Budget Office's estimates of full employment, indicating labor has become relatively scarce. That scarcity has been echoed in the share of small businesses reporting that they have at least one hard to fill job opening.
While at cycle highs, the quit rate implies a more moderate pace of strengthening in compensation as it has moved sideways since the start of the year and remains a bit below the levels of the past expansion. Voluntary quits tend to be associated with higher wage growth as most workers do not switch jobs without being offered higher compensation. Indeed, the Atlanta Fed's Wage Growth Tracker shows the typical job switcher has seen earnings increase nearly a full percentage point faster than job stayers over the past year. The extent of the upturn in employment costs will also be limited, however, by low inflation expectations. Without much pricing power, businesses will remain cautious about raising compensation.
Canadian Economy Unexpectedly Dips in August
Highlights:
- Canadian GDP unexpectedly dropped 0.1% with goods-production sinking 0.7% reflecting declines in manufacturing (-1.0%) and mining (-0.8%).
- Service-producing industries managed an increase though the 0.1% gain was down from the 0.2% average gain evident over the last three months.
- Q3 GDP annualized growth is expected to remain positive though dropping to 1.7% from Q2's 4.7%.
Our Take:
August GDP unexpectedly dropped 0.1% following July's disappointing flat reading. Expectations going into the report were for a 0.1% increase. A key downward surprise was the 1.0% decline in manufacturing activity with the chemical component particularly weak. Some of the latter weakness was attributed to maintenance shutdowns which will eventually reverse though Statistics Canada also highlighted lower export demand. Mining activity was also weaker than expected dropping 0.8% with conventional oil and gas extraction sinking 5.2%. This weakness was partly attributed to maintenance shutdowns in some Newfoundland and Labrador production facilities.
As the various maintenance production shutdowns end, monthly activity should return to positive territory. This along with earlier strength assures that the Q3 average GDP increase will remain positive though in the wake of today's data we have lowered our annualized rate to 1.7% that is about one third of the 4.7% recorded in Q2. Given that the surge in activity in Q2 likely absorbed what slack was remaining in the economy resulting in a closing of the so-called output gap, the slowing is a not unwanted development. In fact, the Bank of Canada's latest forecast update indicated the expectation of such with a projected Q3 growth rate of 1.8%. Thus today's report remains generally consistent with the central bank's outlook as outlined in last week's policy statement of a likely further tightening though with the pace very gradual. In the wake of today's data there is the increasing probability of the next hike being delayed until 2018.