Sample Category Title
Elliott Wave Analysis: S&P500 Update
On stocks we have seen much action lately, but still higher prices on S&P500 and Dax. On E-mini there is unfolding a wedge pattern, knows as an Elliott ending diagonal that can be placed in a fifth wave. That’s a very powerful pattern that may cause a strong decline if wave four swing at 2551 is broken.
S&P500, 1H
Gold Double Bottom Support Is Broken
The gold enjoyed a steady uptrend during Monday but a small doji (stop candle) that appeared at W L3 resistance suggested a possible momentum change. Straight after the doji has been formed the price continued to fall and it finally broke the double bottom and D L3 pivot. Traders should pay attention to possible short term rejections around D L3 -1290.52 while a stronger retracement to the upside might target the POC zone 1294.80-1296.20 ( W L3, historical sellers, Daily camarilla pivot, EMA89, ATR pivot). Rejection from the POC zone targets 1292.20, 1290.52. If the price proceeds further down watch for 1287.87, 1286.25 and the final ATR projection low -1284.92.
W L3 - Weekly Camarilla Pivot (Weekly Interim Support)
W H3 - Weekly Camarilla Pivot (Weekly Interim Resistance)
W H4 - Weekly Camarilla Pivot (Strong Weekly Resistance)
D H4 - Daily Camarilla Pivot (Very Strong Daily Resistance)
D L3 – Daily Camarilla Pivot (Daily Support)
D L4 – Daily H4 Camarilla (Very Strong Daily Support)
POC - Point Of Confluence (The zone where we expect price to react aka entry zone)
AUD Holds Ground After Publication Of RBA’s Minutes, US Data To Suffer From Hurricanes Season
RBA is not quite ready to lift rates before mid-2018 (at least)
The minutes of the last RBA meeting were released early this morning. Although investors did not have huge expectations as the RBA already made clear on a number of occasion it will adopt a wait-and-see approach, it is the occasion to get an update about the view of the central bank on the economic outlook.
According to the minutes, the economic growth was in line with forecast (+0.8% in the June quarter) thanks to a pick-up in consumption and net export, while members acknowledged the solid growth in both full and part-time employment. Nevertheless, they express worries regarding the high level of household ineptness. All in all, the minutes suggest that members consider the overall situation as improving but did not forget to reiterate that the appreciation of the Australian dollar will impact negatively price pressures.
The strength of the Aussie reflects more the current weakness of the US dollar rather than a broad-based increase in demand for the Australian currency. Indeed, on a trade-weighted basis, although it trading with an upward bias for several years, the Aussie has stalled since the beginning of the year as investors do not anticipate the RBA to drop its neutral bias. In addition, according to the Overnight Index Swap, the market do not expected the RBA to lift borrowing rates before mid-2018 at least.
On Tuesday, AUD/USD consolidated at around 0.7850 after falling 0.50% on Monday. The currency pair is currently testing its 50dma, which stands at 0.7911. On the downside, a first support can be found at around 0.77-0.7684 (psychological threshold and 200dma).
US Industrial Production likely to keep suffering from Hurricane Harvey
Today will be released the US industrial production and is expected to increase to 0.3%m/m from a month earlier at -0.9%m/m. The greenback which has largely weakened since the start of the year is now facing upside pressures since European political worries are accelerating.
We recall that in August, the Hurricane Harvey devastated the Gulf Coast which led to the decline of industrial output. Yet, markets seem way too optimistic that industrial production will increase almost back to normal again in September. In our view, we believe that markets are a bit too optimistic. Indeed the recent ISM supplier delivery index showed that possible consequences of the Natural disaster are continuing in September.
This will likely impact the dollar in the very short-term. We consider that we should see the Eurodollar back above 1.18. Tomorrow will be released the Beige Book which shows analyses that help Fed members to take their decisions about the future of the monetary policy. Definitely something to take care of.
CRUDE OIL Monitoring Resistance At 52.86
Crude Oil is pushing higher within a range defined by the support at 50.43 and the strong resistance lies at 52.86 (28/09/2017). Expected to show continued increase within this range.
In the long-term, crude oil has recovered after its sharp decline last year. However, we consider that further weakness are very likely. For the time being the pair lies in an upside momentum. Strong support lies at 35.24 (05/04/2016) while resistance can now be found at 55.24 (03/01/2017 high).

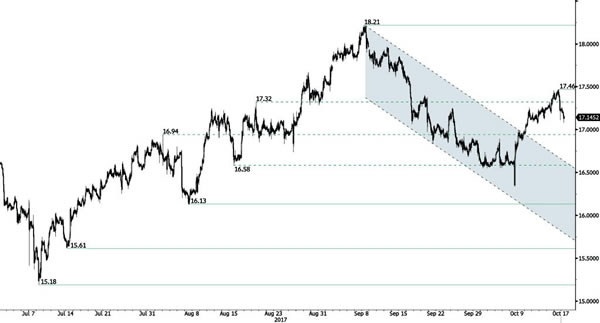
SILVER Profit-Taking
Silver has declined on some profit taking. Hourly resistance is given at 17.46 (13/10/2017 high). The precious metal keeps on trading above $17. Hourly support can be found at 16.13 (06/10/2017 low). Expected to show further increase.
In the long-term, the trend is rater negative. Further downsides are very likely. Resistance is located at 25.11 (28/08/2013 high). Strong support can be found at 11.75 (20/04/2009).
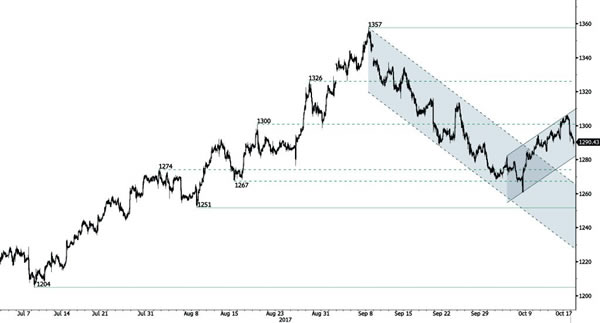
GOLD Bouncing Back Within Uptrend Channel
Gold is back to bullish despite ongoing bearish consolidation. The precious metal is way into an uptrend channel. Hourly support is given at 1284 (11/10/2017 low). Strong support lies at a distance at 1204 (10/07/2017 high). Expected to show bullish pressures.
In the long-term, the technical structure suggests that there is a growing upside momentum. A break of 1392 (17/03/2014) is necessary ton confirm it, A major support can be found at 1045 (05/02/2010 low).
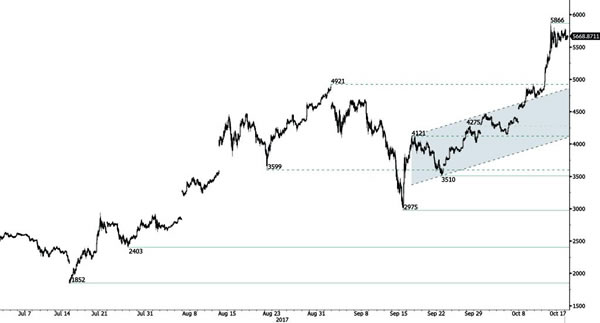
BITCOIN Consolidating Below $6000
Bitcoin is definitely on a strong momentum. Strong support stands very far at 2975 (22/08/2017 low). Bitcoin si ready to set up new all-time high. The road is wide open for further increase. In the short-term, the digital currency should monitor $6000.
In the long-term, the digital currency has had an exponential growth. There are decent likelihood that the asset will reach $10'000.
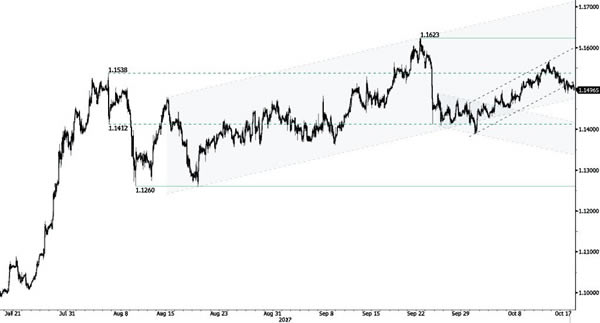
EUR/CHF Bearish Breakout
EUR/CHF has exited short-term bullish trend. Downside pressures are now likely to accelerate. Strong resistance lies at 1.1566 (12/10/2017 high). Support is given at 1.1388 (02/09/2017 low). Downside risk is very likely.
In the longer term, the technical structure has reversed. Strong resistance is given at 1.20 (level before the unpeg). Yet, the ECB's QE programme is likely to cause persistent selling pressures on the euro, which should weigh on EUR/CHF. Supports can be found at 1.0184 (28/01/2015 low) and 1.0082 (27/01/2015 low).
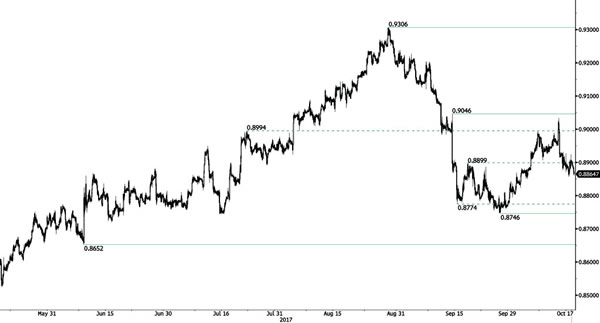
EUR/GBP Bearish Pressures
EUR/GBP's weakness is only a consolidation. The pair is back below former resistance at 0.8899 (19/09/2017 low). The very short-term technical structure is clearly biased to the downside. Hourly support is given at a distance at 0.8746 (27/09/2017 low).
In the long-term, the pair has largely recovered from recent lows in 2015. The technical structure suggests a growing upside momentum. The pair is trading above from its 200 DMA. Strong resistance can be found at 0.9500 (psychological level).
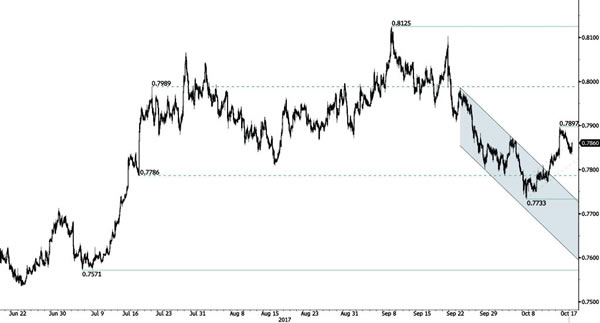
AUD/USD Consolidating Below 0.79
AUDUSD is consolidating lower. Hourly resistance is given at 0.7897 (13/10/2017 high). Support lies at at 0.7733 (06/10/2017 low). Expected to show continued consolidation.
In the long-term, the trend is turning positive. Key supports stands at 0.6009 (31/10/2008 low) . A break of the key resistance at 0.8164 (14/05/2015 high) is needed to invalidate our long-term bearish view.