Sample Category Title
USD/CAD Middle Of Rising Channel
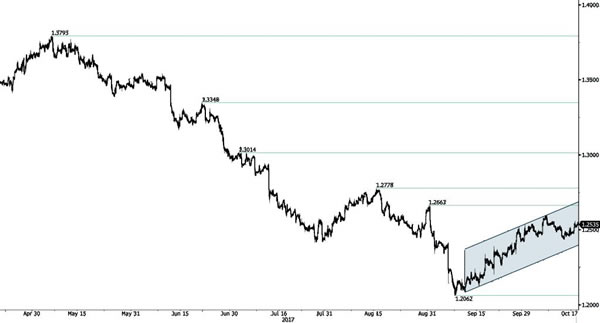
USD/CAD continues to bounce within uptrend channel. Strong support is located at a distance at 1.2062 (08/09/2017 low). Hourly support lies at 1.2331 (26/09/2017 high). Resistance is given at 1.2663 (31/08/2017 high). Expected to show continued short-term bullish pressures within uptrend channel.
In the longer term, the pair has broken longterm support that can be found at 1.2461 (16/03/2015 low). Strong resistance is given at 1.4690 (22/01/2016 high). The pair is likely to head further lower.
USD/CHF Pushing Higher
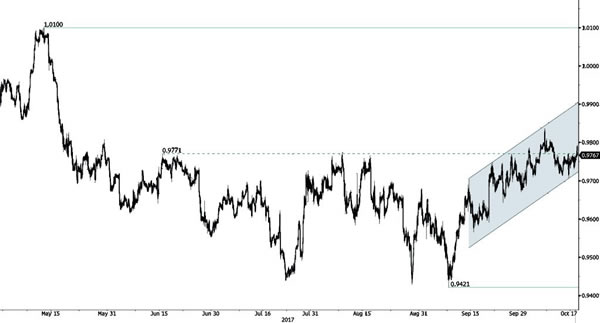
USD/CHF is trading within uptrend channel, Hourly support stands at 0.9712 (12/10/2017 low). The technical structure suggests an improving short-term buying interest. Expected to show continued bullish pressures within uptrend channel.
In the long-term, the pair is still trading in range since 2011 despite some turmoil when the SNB unpegged the CHF. Key support can be found 0.8986 (30/01/2015 low). The technical structure favours nonetheless a long term bullish bias since the unpeg in January 2015.
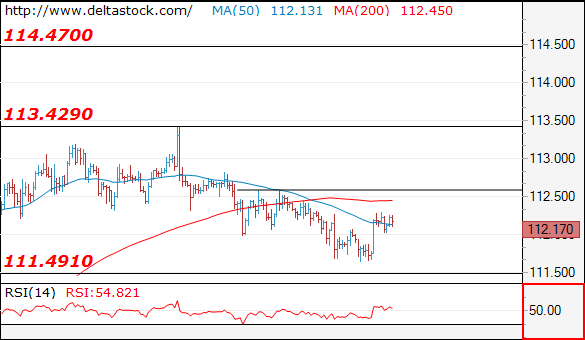
USD/JPY Bullish Breakout
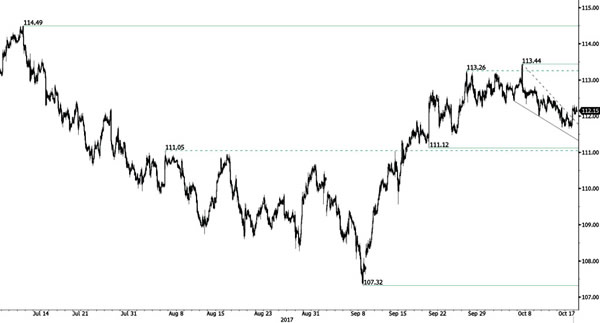
USD/JPY has exited short-term decline. The pair is trading slightly above 112.00. Strong hourly resistance is given at 113.44 (06/10/2017 high). Support is located at 111.12 (20/09/2017 low). However downside risks are definitely rising as markets are now taking some short-term profit after the strong increase during September,
We favor a long-term bearish bias. Support is now given at 99.02 (10/08/2013 low). A gradual rise towards the major resistance at 125.86 (05/06/2015 high) seems unlikely. Expected to decline further support at 93.79 (13/06/2013 low).
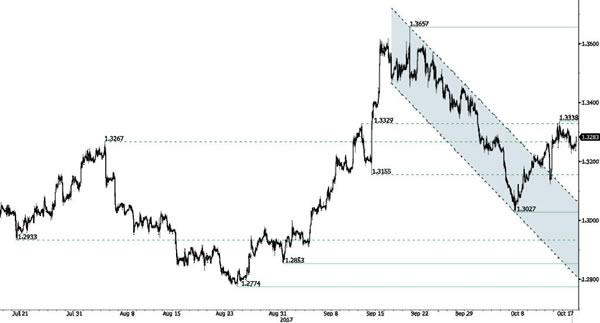
GBP/USD Ready For Another Leg Higher
GBP/USD continues to rise after the break of falling channel. A support can be found at 1.3122 12/10/2017 low). Hourly resistance stands at 1.3338 (13/10/2017 high).
The long-term technical pattern is reversing. The Brexit vote had paved the way for further decline. Long-term support can be found at 1.1841 (07/10/2017 low). Long-term resistance given around 1.35 is at stake and indicates a long-term reversal in the negative trend. Yet, it is very unlikely at the moment.
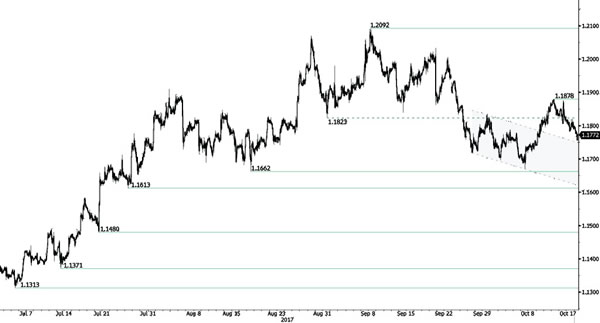
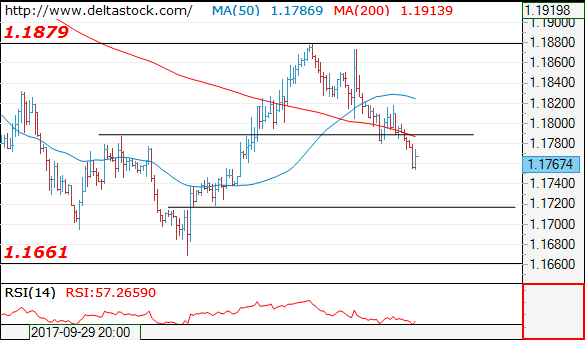
EUR/USD Increasing Selling Pressures
EUR/USD momentum is reversing since the pair has set up an hourly resistance at 1.1878 (12/10/2017 high). Strong support is given at a distance at 1.1662 (17/08/2017 low). Expected to show some short-term consolidation.
In the longer term, the momentum is now turning largely positive. We favour a continued bullish bias. Key resistance is holding at 1.2252 (25/12/2014 high) while strong support lies at 1.0341 (03/01/2017 low).
Forex Technical Analysis: EUR/USD, USD/JPY, GBP/USD
EUR/USD
Current level - 1.1790
My outlook remains bearish, for a slide towards 1.1720 area, en route to 1.1660 lows. Initial resistance lies at 1.1780.
| Resistance | Support | ||
| intraday | intraweek | intraday | intraweek |
| 1.1780 | 1.1940 | 1.1720 | 1.1660 |
| 1.1880 | 1.2030 | 1.1660 | 1.1480 |
USD/JPY
Current level - 112.17
After the recent reversal at 111.60 my outlook is already bullish, for a break through 112.60, towards 113.40.
| Resistance | Support | ||
| intraday | intraweek | intraday | intraweek |
| 112.60 | 114.50 | 111.50 | 111.00 |
| 113.40 | 114.50 | 111.00 | 107.30 |
GBP/USD
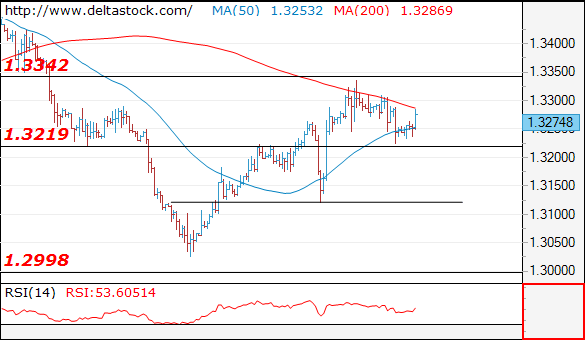
Current level - 1.3274
Despite the intraday risk of one more short-lived spike to 1.3340, the overall bias is bearish, for a break through 1.3220, towards 1.3120, en route to 1.3000 area.
| Resistance | Support | ||
| intraday | intraweek | intraday | intraweek |
| 1.3340 | 1.3340 | 1.3220 | 1.2910 |
| 1.3460 | 1.3650 | 1.3120 | 1.2760 |
Technical Outlook: Spot Gold Eases Further As Safe-Haven Buying Fades
Spot Gold extends weakness on Tuesday to $1287, following Monday's upside rejection at $1305 and close in red.
Today's fresh bearish extension signal pullback, with slow stochastic reversed from overbought territory and showing a plenty of room at the downside.
The yellow metal was hit by stronger dollar and reduced safe-haven buying.
Gold price bears dented pivotal supports at $1288/87 zone (Fibo 38.2% of $1260/$1306 upleg / 20SMA) break of which would generate fresh bearish signal and risk extension towards supports at $1283 and $1277 (Fibo 50% and 61.8% retracement of $1260/$1306 respectively).
Broken 55SMA ($1296) marks solid resistance and caps today's action.
Res: 1296, 1300, 1305, 1309
Sup: 1287, 1283, 1277, 1275
GBP/USD Elliott Wave Analysis
GBP/USD – 1.3254
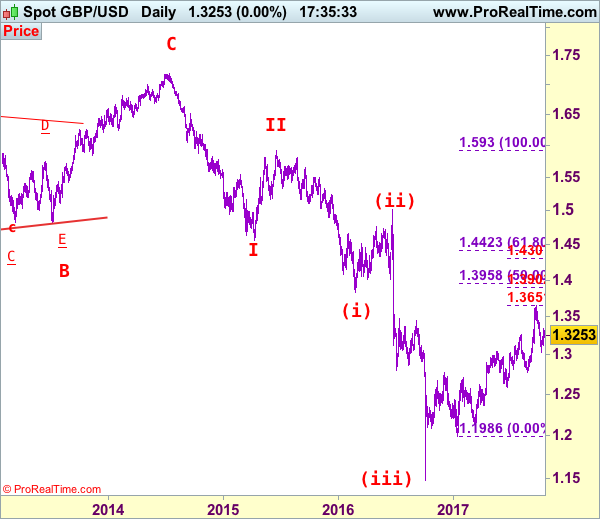
Although sterling found good support at 1.3121 last week and staged another rebound, as 1.3338 capped cable’s upside and the pair has retreated since, retaining our bearishness, as long as this resistance holds, consolidation with mild downside bias remains for another retreat, a daily close below said support at 1.3121 would signal the rebound from 1.3027 low has ended and bring retest of this level. Looking ahead, a drop below this level would signal the fall from 1.3658 top has resumed for weakness to 1.3000, then towards 1.2950 but support at 1.2909 should limit downside and another previous support at 1.2852 would remain intact.
Our preferred count on the daily chart is that cable's rebound from 1.3500 (wave (A) trough) is unfolding as a wave (B) with A ended at 1.7043, followed by triangle wave B and wave C as well as wave (B) has possibly ended at 1.7192, below support at 1.4232 would add credence to this count, then further fall to 1.4000 level would follow but reckon downside would be limited to 1.3655 support and price should stay above previous support at 1.3500.
On the upside, expect recovery to be limited to 1.3295-00 and bring another retreat. Above previous support at 1.3343 would defer and risk a stronger rebound to 1.3400 and possibly towards resistance at 1.3455, however, if our view that top has been formed at 1.3658 is correct, upside would be limited and bring another decline later.
Recommendation: Hold short entered at 1.3300 for 1.3050 with stop above 1.3345.
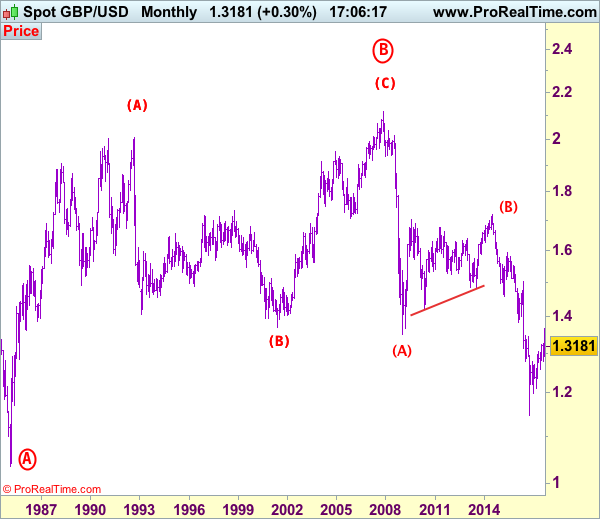
Longer term - Cable's rise from 1.0520 (Feb 1985) to 2.0100 (September 1992) is seen as [A], the decline to 1.3682 is labeled as (B) and (C) wave rally has ended at 2.1162 (9 Nov, 2007) which is also the top of larger degree wave B with circle. The selloff from there is a 5-waver with wave (A) ended at 1.3500 (23 Jan 2009), wave (B) itself is labeled as A: 1.6733, triangle wave B: 1.4813 and wave C as well as top of wave (B) ended at 1.7192 (2014), hence the selloff from there is an impulsive wave (C) with wave I : 1.4566, wave II 1.5930, an extended wave III is unfolding and already exceeded our downside target at 1.3500 and 1.3000, hence weakness to 1.2500 and possibly 1.2000 cannot be ruled out, however, price should stay well above psychological level at 1.0000.
GBP/JPY Elliott Wave Analysis
GBP/JPY – 148.65
Sterling’s retreat from 152.85 (last month’s high) turned out to be much stronger than expected, suggesting a temporary top has possibly been formed there, hence consolidation with mild downside bias is seen and weakness to 147.40-50 cannot be ruled out, however, break of support at 146.95 is needed to add credence to this view, bring retracement of recent rise to 146.00-10 and possibly towards support at 145.25, however, near term oversold condition should limit downside to 144.50 and 143.95-00 should remain intact.
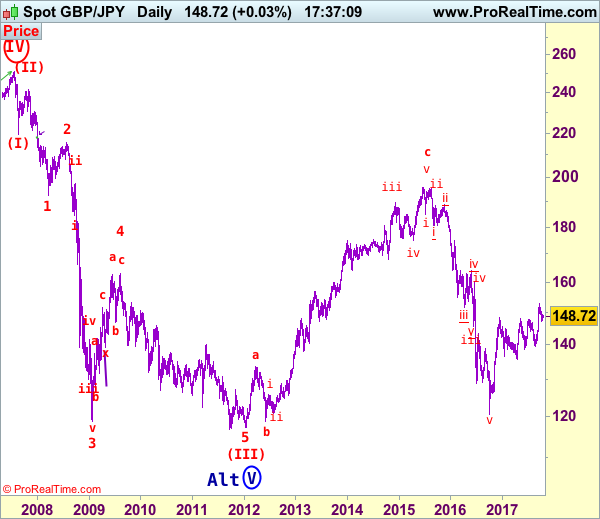
Our preferred count is that larger degree wave V with circle is unfolding from 251.12 with wave (I) 219.34, (II): 241.38 and wave (III) is subdivided into 1: 192.60, 2: 215.89 (23 Jul 2008) and wave 3 ended at 118.87 earlier in 2009. The correction from there to 162.60 is wave 4 which itself is a double three and is labeled as first a-b-c ended at 151.53, followed by wave x at 139.03, 2nd a ended at 162.60, 2nd b at 146.75 and 2nd c leg of wave 4 ended at 163.00. Therefore, the decline from 163.00 to 116.85 is now treated as wave 5 which also marked the end of larger degree wave (III), hence wave (IV) major correction has commenced for retracement of the wave (III) from 241.38 and upside target at 183.95-00 (50% Fibonacci retracement of the wave (II) from 241.38) had been met, a drop below 160.00 would suggest wave (IV) has ended at 195.85, bring decline in wave (V) for initial weakness to 130 (already met) and 120.
On the upside, whilst initial recovery to 149.25-30 and possibly 150.00 cannot be ruled out, reckon upside would be limited to 150.25-30 and price should falter below 150.95-00, bring another decline later. Only a daily close above resistance at 151.55-60 would suggest the pullback from 152.85 has ended and revive bullishness for retest of this level first. A break of this level would extend recent upmove from 120.50 low (wave v trough) for subsequent gain to 153.50-60, then 154.00-10, however, sharp move beyond 155.00 should not be repeated, risk from there has increased for a correction to take place later.
Recommendation: Stand aside for this week.
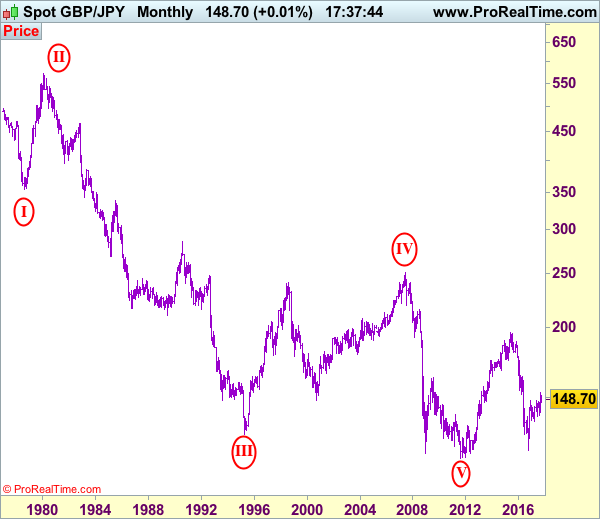
The long-term downtrend from 570.99 (29 Feb 1980) is labeled as an impulsive wave with III with circle ended at 129.77 (20 Apr 1995) and the corrective rebound to 251.12 (20 Jul 2007) is treated as wave IV with circle and the wave V with circle selloff from 251.12 has possibly ended at 116.80 (almost reached our indicated target at 116.00) and major correction has commenced from there and indicated upside target at 183.90-00 (50% Fibonacci retracement of 251.10-116.85) had been met, reckon upside would be limited to 199.80-90 (61.8% Fibonacci retracement) and bring wave (V) decline in later part of 2017.
Technical Outlook: WTI OIL Rallies Back Above $52 After Shallow Correction Overnight
WTI oil returns above $52 handle after dipping to $51.66 in Asia on profit-taking. Monday’s high at $52.35 is eyed for retest with final stretch towards key $52.84 barrier (28 Sep high), seen as likely near-term scenario.
Oil price remains supported by positive fundamentals which were boosted by recent clashes in Iraq, threatening of supply disruption in the region.
Also, positive technical studies are supplementing bullish sentiment in the market and favoring further rise of oil prices.
Firm break above $52.84 would signal extension the bull-leg from $49.09 (part of broader uptrend from 2017 low at $42.04) towards next target at $53.74 (12 Apr high).
Overbought conditions of daily slow stochastic have so far been ignored, but some corrective easing could be anticipated in the near-term.
Rising 20SMA ($51.00) should contain stronger dips.
Res: 52.35, 52.84, 53.18, 53.74
Sup: 51.66, 51.40, 51.00, 50.75