Sample Category Title
Record Highs Are No Longer Justified
'Since Election Day on 8 November, the stock market is up more than 25%, unemployment is at a 17-year low andcompanies are coming back to the U.S.”Donald Trump
Indeed, the Dow Jones Industrial Average and the S&P 500 rose by more than 25% and 20%, respectively, since 8 November. President Trump gives credit to himself and no one can blame him, because fundamental data cannot justify current levels.
All three major U.S. indices reached new record highs yesterday, but investors have got used to this, and record highs are no longer making headlines. For those who have been waiting for a correction to buy the dips, they have missed the opportunity. The threat of nuclear war, expectations of higher interest rates, hurricanes and terrorist attacks all failed to pull markets from record levels.
Equity strategists have been forced to adjust their year-end target higher for U.S. indices, although little justification is provided. Valuations are becoming incredibly overstretched, yet investors do not seem to worry.
Forward 12-month P/E ratio on the S&P 500 rose above 18 this week, for the first time since mid-2002. Although multiples remain below the forward peak P/E ratio of 24.4 tested during the dot.com bubble, it’s still much higher than 10-year or 20-year averages of 14.1 and 16. This means investors are paying more, for less.
It looks to melike speculation and greed are driving the current bull market, which could be an indication of the latest stages of an uptrending market. However, it is not a wise decision to sell uptrend markets; speculation might continue to drive stocks higher, especially if earnings surprise to the upside.
Nobody knows when or what will trigger a sharp correction or a bear market. Timing the market is an almost impossible mission. However, for investors who would like to remain invested in the current bull market, it would be a good idea to buy protection. CBOE’s Volatility Index (VIX) is currently trading below 10 (-29.5% YTD), which means options prices are relatively cheap. The downside to buying a put option is that it expires and the investor loses the premium paid;but, given that things look a little crazy, the reward of buying put options is higher than the risk involved.
Trade Idea : GBP/USD – Stand aside
GBP/USD - 1.3261
Most recent candlesticks pattern : N/A
Trend : Near term up
Tenkan-Sen level : 1.3252
Kijun-Sen level : 1.3269
Ichimoku cloud top : 1.3292
Ichimoku cloud bottom : 1.3230
Original strategy :
Bought at 1.3250, stopped at 1.3245
Position : - Long at 1.3250
Target : -
Stop : - 1.3245
New strategy :
Stand aside
Position : -
Target : -
Stop : -
Although the British pound recovered after falling to 1.3225 overnight and consolidation with initial upside bias is seen, break of resistance at 1.3312 is needed to revive bullishness and signal the pullback from 1.3338 (last week’s high) has ended, bring retest of this resistance, break there would signal the rise from 1.3027 low has resumed for a stronger retracement of recent decline towards 1.3375-80 (61.8% Fibonacci retracement of 1.3596-1.3027), however, overbought condition should limit upside to 1.3400-10.
On the downside, below 1.3225 would bring further fall to 1.3200 and possibly towards 1.3170-75 but only break of indicated support at 1.3121 would shift risk back to downside and signal the aforesaid rise from 1.3027 has ended, then further fall to 1.3090-00 would follow. As near term outlook is mixed, would be prudent to stand aside for now.
Gold Price Is Back In Uptrend Above $1285 Vs US Dollar
Key Highlights
- Gold price after forming a bottom near $1260 against the US Dollar started an upside move.
- There was a break above a key bearish trend line with resistance at $1284 on the 4-hours chart of XAU/USD.
- Recently in the US, the NY Empire State Manufacturing Index posted a rise from 24.4 to 30.2 in Oct 2017.
- Today, the US Industrial Production for Sep 2017 will be released, which is forecasted to increase by 0.2% (MoM).
Gold Price Technical Analysis
Gold price formed a bottom earlier this month at $1260 against the US Dollar. The price is trading in the bullish zone and placed well above the $1285 and $1292 support levels.
Looking at the 4-hours chart of XAU/USD, there was a break above a key bearish trend line with resistance at $1284. Buyers also succeeded in clearing the 100 simple moving average (4-hour, red) at $1285, which is a strong bullish signal.
However, the price recently failed near $1308 and the 200 SMA (4-hour, green). Above the 200 SMA, the next major resistance is around the 50% Fib retracement level of the last decline from the $1357 high to $1260 low. A successful close above $1308 will most likely push the price towards $1320 in the near term.
On the downside, the $1285 level remains a crucial support for buyers along with the 100 SMA.
NY Empire State Manufacturing Index
Recently in the US, the NY Empire State Manufacturing Index for Oct 2017 was released by the Federal Reserve Bank of New York. The forecast was lined up for a decline from the last reading of 24.4 to 20.7.
The actual result was positive as the NY Empire State Manufacturing Index jumped to 30.2, which is the highest level in three years. Looking, at the shipments index, there was a sharp rise of 11 points to 27.5, and the new orders index came in at 18.0.
The report added:
The index for number of employees rose five points to 15.6, suggesting that employment expanded more strongly this month, while the average workweek index registered zero, indicating that the average workweek held steady.
Overall, the result was way above the market expectations and pushed Gold price from $1304 to $1295. Having said that, it seems like the price might continue to gain momentum as long as it stays above $1285.
Economic Releases to Watch Today
- UK Retail Price Index Sep 2017 (YoY) – Forecast +4.0%, versus +3.9% previous.
- UK Producer Price Index Sep 2017 (YoY) – Forecast +3.3%, versus +3.4% previous.
- UK Producer Price Index Sep 2017 (MoM) – Forecast +0.3%, versus +0.4% previous.
- UK Consumer Price Index Sep 2017 (YoY) – Forecast +3.0%, versus +2.9% previous.
- UK Core Consumer Price Index Sep 2017 (YoY) – Forecast +2.8%, versus +2.7% previous.
- Euro Zone CPI for Sep 2017 (YoY) – Forecast +1.5%, versus +1.5% previous.
- Euro Zone CPI for Sep 2017 (MoM) – Forecast +0.4%, versus +0.3% previous.
- Euro Zone Core CPI for Sep 2017 (YoY) – Forecast +1.1%, versus +1.1% previous.
- US Industrial Production Sep 2017 (MoM) – Forecast +0.2%, versus -0.9% previous.
- US Capacity Utilization Sep 2017 – Forecast 76.2%, versus 76.1% previous.
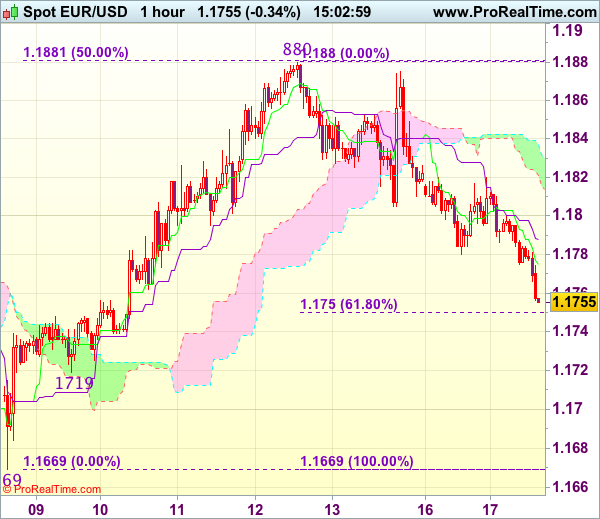
Trade Idea : EUR/USD – Sell at 1.1800
EUR/USD - 1.1765
Most recent candlesticks pattern : N/A
Trend : Near term up
Tenkan-Sen level : 1.1775
Kijun-Sen level : 1.1788
Ichimoku cloud top : 1.1837
Ichimoku cloud bottom : 1.1821
New strategy :
Sell at 1.1800, Target: 1.1700, Stop: 1.1835
Position : -
Target : -
Stop : -
As the single currency has fallen again after brief bounce to 1.1820 yesterday, suggesting top has possibly been formed at 1.1880 and the fall from there may extend weakness to 1.1750 (61.8% Fibonacci retracement of 1.1669-1.1880), break there would add credence to this view and bring test of support at 1.1719 but break there is needed to signal the rebound from 1.1669 has ended, then further decline to 1.1700 would follow.
In view of this, we are looking to sell euro on recovery as 1.1800 should limit upside. Above 1.1820 would suggest low is formed instead, bring a stronger rebound to 1.1845-50 but price should falter below said resistance at 1.1880, bring another retreat later.
Forex: Iraqi Tensions Impact Oil Prices
On Monday, Iraqi forces moved to take control of the city of Kirkuk that had been under control of a Kurdish faction since 2014 and had recently voted for independence in a referendum with Baghdad objections. Kirkuk is home to over 10% of Iraq’s oil reserves and the “takeover” brought concerns to the markets regarding supply disruptions, which helped pushed WTI up to a 3-week high before retracing overnight.
The Reserve Bank of Australia released the minutes of their October 3rd meeting earlier today. The minutes reveal that the RBA appears to be in no hurry to hike interest rates, as many of its global peers are moving towards reducing monetary stimulus. The RBA noted that recent data pointed to reduced price pressures with a relatively strong labour market expected to support higher consumer spending that is restricted by slow growth in real wages and high levels of household debt. Whilst the Australian economy is improving, it is evident that the RBA is not thinking about raising interest rates anytime soon.
AUDUSD is little changed in the early Tuesday trading session at 0.7850.
On Monday, Spain’s deputy prime minister, Mrs. Soraya Sáenz de Santamaría, says that Catalonia’s leader didn’t give an adequate response in his letter about the region’s independence and has until Thursday to comply with the country’s laws. Catalonia Leader Puigdemont’s letter, issued two hours before a Monday deadline, didn’t clarify whether he in fact declared Catalonia’s independence from Spain. He called for talks with Spain’s government. Puigdemont now has until Thursday to give a response – the Spanish Government wants a simple “yes” or “no” – before Spain could activate Article 155 of the Constitution, which would allow the central government to take over parts of Catalonia’s self-governance.
EURUSD is 0.15% lower in early trading. Currently, EURUSD is trading around 1.1780.
USDJPY is little changed overnight, currently trading around 112.15.
GBPUSD is unchanged from Monday’s close to currently trade around 1.3255.
Gold is 0.2% lower overnight, currently trading around $1,292.50.
WTI gave back Monday’s gains to trade 0.3% lower in early Tuesday trading. WTI currently trades around $52.05.
Major data releases for today:
At 09:30 BST, UK National Statistics will release Consumer Price Index (YoY) for September. UK inflation is expected to climb to 3.0% from the previous release of 2.9%. A figure above 3.0% will put pressure on the Bank of England to raise UK interest rates sooner rather than later. Depending on the actual number the markets could experience increased volatility in GBP pairs.
At 11:00 BST, Eurostat will release Consumer Price Index & Core (YoY) for September for the Eurozone. The forecast is expected to come in unchanged at 1.5%, with Core CPI expected at 1.1%. Any deviation from the consensus is likely to cause EUR volatility.
At 11:15 BST, Bank of England Governor Mark Carney is scheduled to appear before members of the UK Parliament’s Treasury Select Committee, in which he will be questioned over recent policy decisions – and where he sees policy heading over coming months.
At 14:15 BST, the Board of Governors of the Federal Reserve will release Industrial Production (MoM) for September. The last release was greatly affected by the Hurricanes and came in at -0.9%. With the rebuilding process well underway and many factories back in operation, the release is expected to show a positive figure of 0.2% for September. A positive figure will be seen as inflationary and will help the Fed in justifying a rate hike before the end of the year.
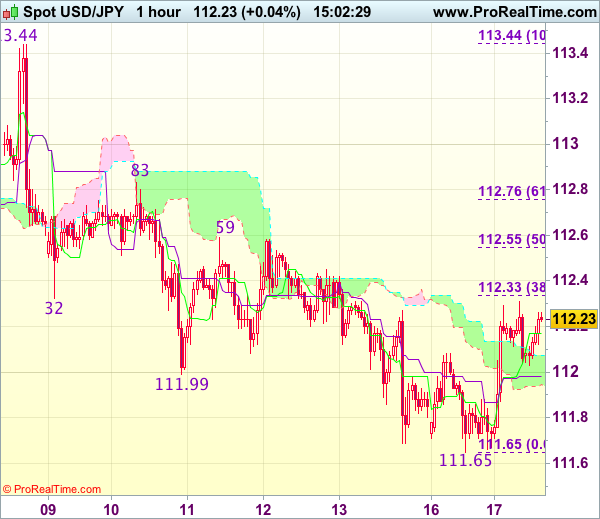
Trade Idea : USD/JPY – Stand aside
USD/JPY - 112.19
Most recent candlesticks pattern : N/A
Trend : Near term down
Tenkan-Sen level : 112.17
Kijun-Sen level : 111.98
Ichimoku cloud top : 112.07
Ichimoku cloud bottom : 111.95
Original strategy :
Sold at 112.25, stopped at 112.25
Position : - Short at 112.25
Target : -
Stop : - 112.25
New strategy :
Stand aside
Position : -
Target : -
Stop : -
Despite falling to 111.65 yesterday, as dollar found good support there and has staged a strong rebound, suggesting a temporary low is possibly formed and consolidation with mild upside bias is seen for gain to 112.33-35 (38.2% Fibonacci retracement of 113.44-111.65), however, break of 112.55-59 (50% Fibonacci retracement and previous resistance) is needed to confirm and bring further subsequent gain to 112.76 (61.8% Fibonacci retracement) but reckon resistance at 112.83 would hold from here.
On the downside, expect pullback to be limited to 111.90-95 and said support at 111.65 (yesterday’s low) should hold, bring another rebound later. A drop below 111.65 would revive bearishness for the fall from 113.44 top to extend weakness to 111.47 support and later towards another previous support at 111.11 which is expected to remain intact. As near term outlook has turned mixed, would be prudent to stand aside for now.
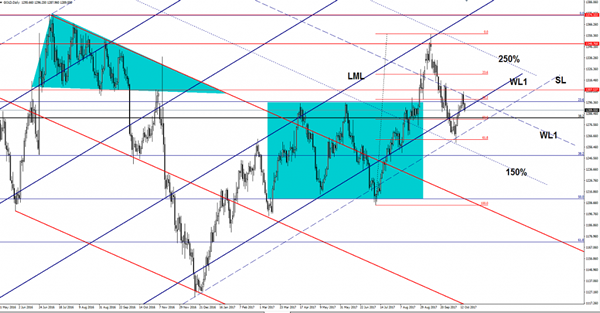
Gold Very Heavy
The yellow metal was rejected by the first warning line (WL1) of the major descending pitchfork and now could ignore the support from the warning line (WL1) of the ascending pitchfork. Gold has made a false breakout above the 38.2% retracement level and now is expected to reach the 50% level again. Only a valid breakdown below the SL will confirm a broader drop.
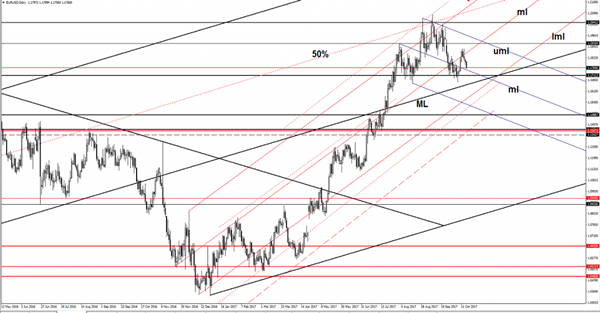
EUR/USD On The Way Down
Price dropped and is almost to reach the median line (ml) of the descending pitchfork, where he may find temporary support. The current drop is natural after the false breakout above the median line (ml) of the minor ascending pitchfork. However, only a valid breakdown below the median line (ML) of the major ascending pitchfork will confirm a larger drop.
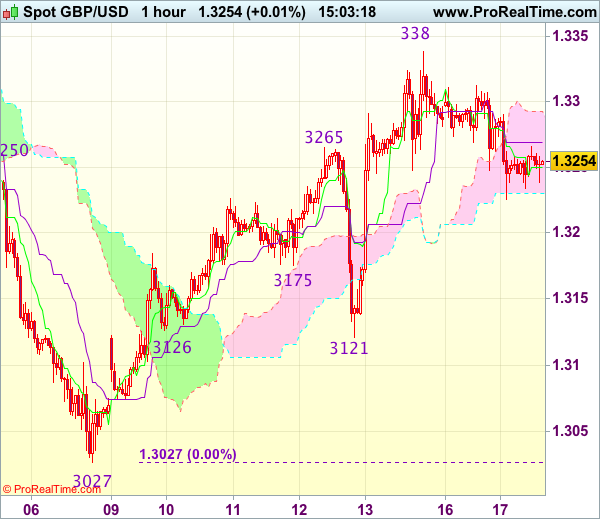
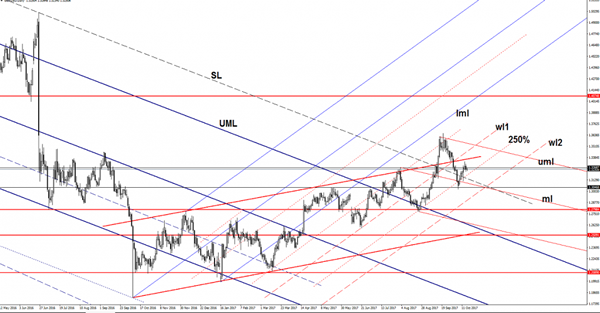
GBP/USD Is The Rebound Completed?
The GBP/USD decreased a little today, but looks undecided as the USDX is facing a tough resistance. Will be better to stay away right now because we don’t have any trading opportunity. Price is trading near crucial support and resistance level, so I hope that we’ll have a clear direction very soon.
You should be careful later as the Fundamental factors will take the lead and will drive the price, remains to see the direction. The US and the United Kingdom are to release high impact data, which will bring life on the currency market.
The Cable could receive a helping hand from the UK’s inflation data, the CPI is expected to increase by 3.0% in the previous month, while the Core CPI may increase by 2.7%, matching the 2.7% growth in the former reading period. You should keep an eye on the economic calendar today because is filled with significant data.
The GBP/USD failed to reach and retest the upside line of the up channel and failed to stay above the 1.3268 as well and now should hit the 250% Fibonacci line again. The perspective remains bullish as long as the rate stays above this line. Price has shown some exhaustion signs on the short term as the USDX has pushed the USD higher. Is very important to see what will really happen on the USDX because a further increase will send the rate tumbling.
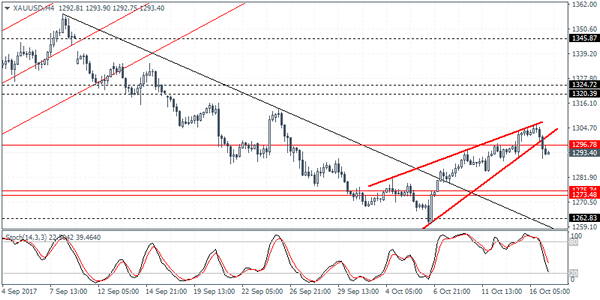
XAUUSD Intraday Analysis
XAUUSD (1293.40): Gold prices turned bearish, and eventually price action was seen slipping to the downside from the rising wedge pattern. With the minor support level at 1296.00 being cleared, the bias remains to the downside as a result. Support is seen at 1275 - 1274 which could be the next downside target. However, in the event of a breakout above 1296.00 level, gold prices could be seen pushing higher. The next target area comes in at 1320.00 resistance level. The current breakdown comes with price action posting an outside bar on the daily session.