Sample Category Title
USD/CHF Slight Break Of Rising Channel
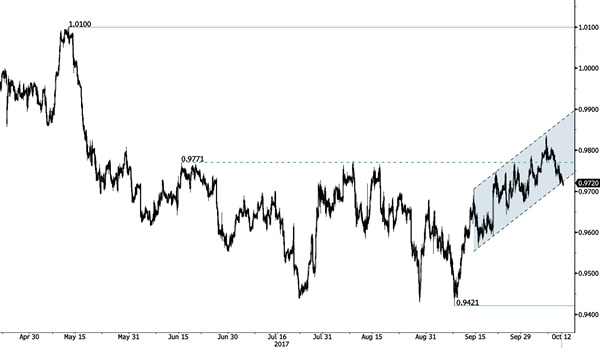
USD/CHF has breached the channel support at 0.9724 However, prices have thus failed to hold below that level and a key support stands at 0.9712. The break of the hourly resistance at 10.9741 (11/10/2017 high) suggests an improving short-term buying interest. Expected to show continued bullish pressures within uptrend channel.
In the long-term, the pair is still trading in range since 2011 despite some turmoil when the SNB unpegged the CHF. Key support can be found 0.8986 (30/01/2015 low). The technical structure favours nonetheless a long term bullish bias since the unpeg in January 2015.
USD/JPY Stable
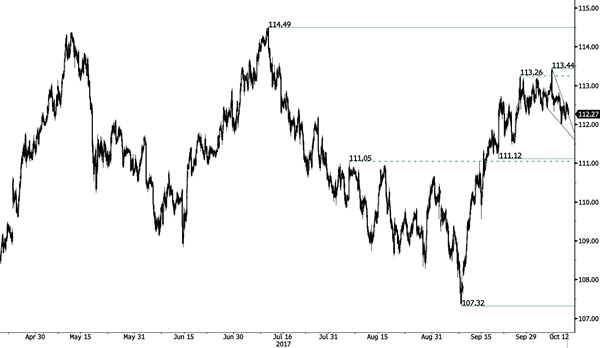
USD/JPY has failed to hold above former resistance given at 113.26 (27/09/2017 low). Support is located at 111.99 (16/10/2017 low). Downside risks are rising as markets may soon take some short-term profit.
We favor a long-term bearish bias. Support is now given at 99.02 (10/08/2013 low). A gradual rise towards the major resistance at 125.86 (05/06/2015 high) seems unlikely. Expected to decline further support at 93.79 (13/06/2013 low).
GBP/USD Breakout Extension
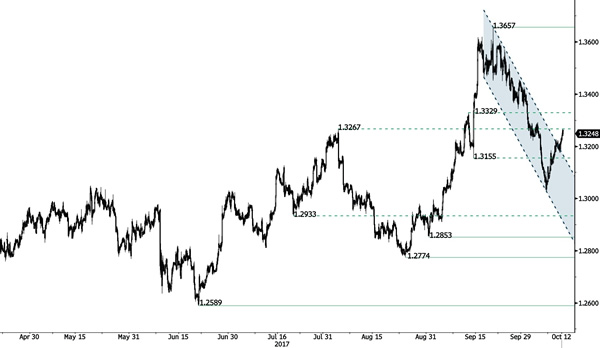
GBP/USD continues to rise after the break of falling channel. A support can be found at 1.3237 (intraday low). Hourly resistances stand at 1.3265 (intraday high).
The long-term technical pattern is reversing. The Brexit vote had paved the way for further decline. Long-term support can be found at 1.1841 (07/10/2017 low). Long-term resistance given around 1.35 is at stake and indicates a long-term reversal in the negative trend. Yet, it is very unlikely at the moment.
EUR/USD Strong Bullish Momentum
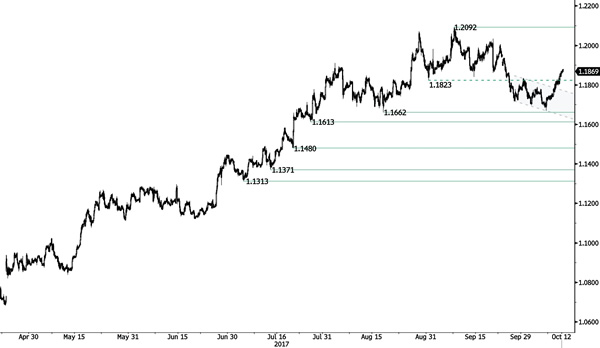
EUR/USD continues to improve and is now close to the key resistance at 1.1890 (25/09/2017 high). Strong support is given at a distance at 1.1662 (17/08/2017 low).
In the longer term, the momentum is now turning largely positive. We favour a continued bullish bias. Key resistance is holding at 1.2252 (25/12/2014 high) while strong support lies at 1.0341 (03/01/2017 low).
Elliott Wave Analysis: AUDUSD Trading In A Bearish Impulse
AUDUSD made a new sharp and strong drop at the end of last week, which we labeled it as sub-wave 5 of three. As such, current rise is seen as wave 4) in progress if we consider a broken trendline from black waves 2 and 4. That said, we are tracking a new corrective rally that may retrace back to the area of a former wave four to 0.7874 from where bears may fall to a new low. Overall trend on Aussie is still seen bearish as long as pair trades beneath 0.7953.
AUDUSD, 4H
EUR/JPY Hidden Bullish Divergence Within The Zone
The EUR/USD is in a strong bullish trend and as we can see on the chart the price has pierced through 1.1800 driven by risk sentiment and the Spain situation. Today FOMC meeting minutes are the most important event so we might see two-way price action. At this point the price is still going up straight from the trend line and 23.6 fib. Continuation above 1.1855 aims for 1.1880 and 1.1895. However, if the price gets in a retracement phase watch for 1.1760-75 zone (D L4, EMA89, trend line, ATR low, W H3). Targets remain the same if the pair breaks 1.1810 on the bounce up. Only a move below 1.1750 might make a bearish breakout towards 1.1720 and 1.1695.
H3 - Weekly Camarilla Pivot (Weekly Interim Resistance)
W H4 - Weekly Camarilla Pivot (Strong Weekly Resistance)
D H4 - Daily Camarilla Pivot (Very Strong Daily Resistance)
D L3 – Daily Camarilla Pivot (Daily Support)
D L4 – Daily H4 Camarilla (Very Strong Daily Support)
PPR - Progressive Polynomial Channel
POC - Point Of Confluence (The zone where we expect price to react aka entry zone)
EUR/GBP Elliott Wave Analysis
EUR/GBP – 0.8964
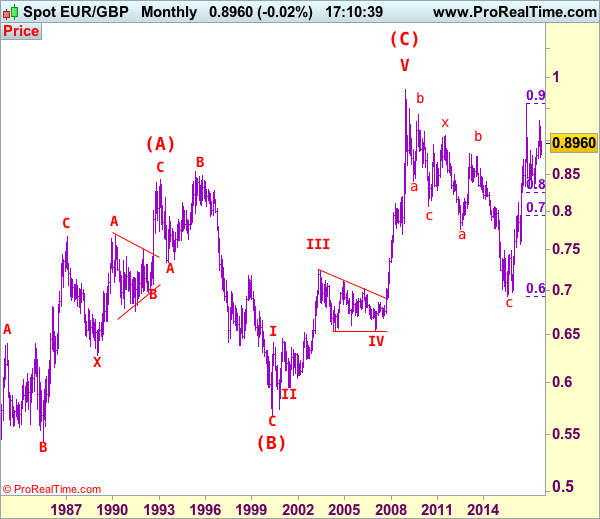
Although the single currency fell marginally to 0.8746, as euro found good support there and has staged a strong rebound, suggesting at least the first leg of decline from 0.9307 has ended at 0.8746, hence upside bias is seen for this rebound from 0.8746 to bring retracement of the fall from 0.9307, then further gain to 0.9045-50 and possibly 0.9080 would be seen, however, reckon upside would be limited to previous support at 0.9115-20 and price should falter well below resistance at 0.9203, bring another decline later this month.
Our latest preferred count is that the wave V of a 5-wave series from 0.5682 ended at 0.9805 earlier and major from there has possibly ended at 0.8067 as A-B-C-X-A-B-C. We are keeping our view that the entire correction from 0.9805 has possibly ended at 0.7756 and as labeled as the attached daily chart and impulsive move from 0.9084 has ended at 0.6938 as a 5-waver which marked as the (C) wave, recent impulsive rise is labeled as (I) (II), (i) (ii) series, indicated upside target at 0.9084 had been met, the retreat from 0.9576 suggest wave iii ended there and next upside target for wave v of (III) should head towards 0.9700 but price should falter well below parity .
On the downside, whilst initial pullback to 0.8910-15 cannot be ruled out, reckon downside would be limited to 0.8870-80 and bring another rebound later. Below 0.8800-05 would suggest the rebound from 0.8746 has ended instead, bring weakness to 0.8770-75, break there would confirm and bring retest of 0.8746, once this support is penetrated, this would signal the decline from 0.9307 top has resumed for correction of early uptrend to 0.8690-95 (61.8% Fibonacci retracement of 0.8312-0.9307) and possibly towards previous support at 0.8652.
Recommendation: Exit short entered at 0.8895 and buy at 0.8880 for 0.9080 with stop below 0.8780
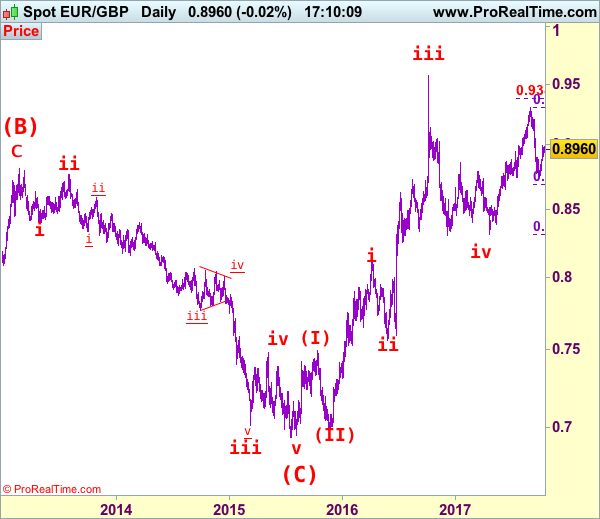
Euro's long term uptrend started in Feb 1981 at 0.5039 and is unfolding as a (A)-(B)-(C) move with (A): 0.8433 (Feb 1993), (B): 0.5682 (May 2000) and impulsive wave (C) should have ended at 0.9805 with wave III ended at 0.7254 (May 2003), triangle wave IV at 0.6536 (23 Jan 2007) and wave V as well as wave (C) has ended at 0.9805.
We are keeping an alternate count that only wave III ended at 0.9805 and the correction from there is the wave IV and has possibly ended at 0.6936, however, it is necessary to see a daily close above resistance at 0.9576 in order to change this to be the preferred count.
USD/CAD Elliott Wave Analysis
USD/CAD – 1.2455
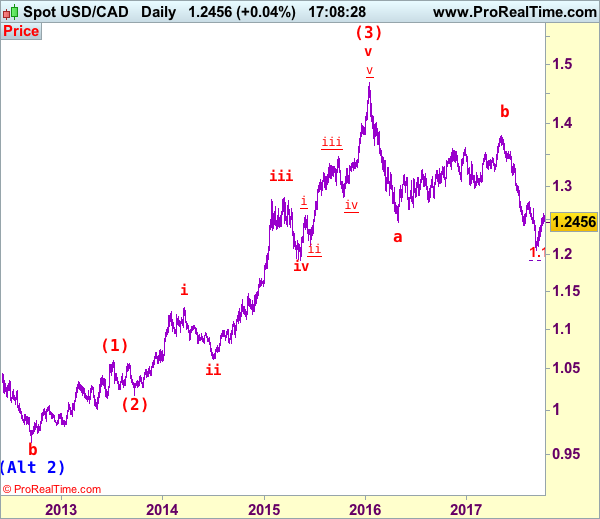
Although the greenback edged higher to 1.2599 late last week, the subsequent retreat suggests consolidation below this level would be seen initially and pullback to 1.2445-50 is likely, however, reckon support at 1.2336 would hold and bring rebound later. Above said resistance at 1.2599 would signal the rise from 1.2061 low is still in progress for retracement of recent downtrend towards resistance at 1.2663 but loss of upward momentum should limit upside to 1.2700-10 and price should falter well below resistance at 1.2778, bring retreat later.
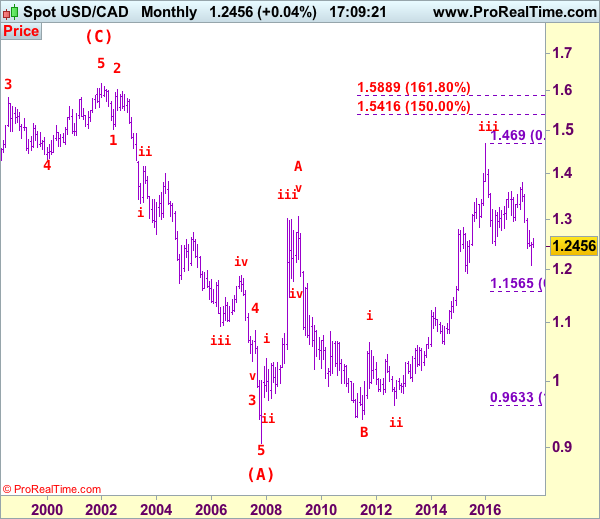
We are keeping our view that the wave b from 1.0657 (a leg top) has possibly ended at 0.9633 with (a): 0.9800, wave (b): 1.0447 and wave c at 0.9633, the subsequent rise from there is now treated as wave c exceeded indicated upside target at 1.3770-80 and 1.4000 and wave (3) has possibly ended at 1.4690 and wave (4) correction has commenced for retracement back towards 1.2000.
On the daily chart, our latest preferred count remains that the A of (B) rally from 0.9059 low (7 Nov 2007) unfolded into an impulsive wave with i: 0.9059-1.0380, ii ended at 0.9819, iii at 1.3019 followed by triangle wave iv at 1.2026 , then wave v formed a top at 1.3066 and also ended the wave A. The wave B is unfolding as an double three a-b-c-x-a-b-c and is sub-divided as a: 1.2192, b: 1.2716 and wave c at 1.0784, followed by wave x at 1.1725, another set of a-b-c unfolded with 2nd a at 0.9931, 2nd b at 1.0674. the 2nd c has possibly ended at 0.9407, therefore, consolidation with upside bias is seen for major correction, indicated target at 1.3900 had been met and gain to 1.4700 would follow.
On the downside, whilst initial pullback to 1.2400-10 cannot be ruled out, reckon downside would be limited and support at 1.2336 should hold, bring another rise later. Below 1.2310-15 would suggest the rebound from 1.2061 has ended instead, bring weakness to support at 1.2254, however, a daily close below this level is needed to add credence to this view, bring further fall towards another previous support at 1.2197 which is likely to hold from here. We are keeping our bearish count that wave b ended at 1.3794 and wave c has commenced for further fall towards psychological support at 1.2000.
Recommendation: Stand aside for this week.
Longer term - The selloff from 1.6194 (21 Jan 2002) to 0.9059 (07 Nov 2007) is viewed as (A) wave which is a 5-waver as labeled on the monthly chart as below, the subsequently rally is labeled as (B) with impulsive A leg of (B) ended at 1.3066, wave B of (B) is unfolding which has either ended at 0.9407 or would extend one more fall but downside should be limited to 0.9200 and 0.9000 should hold.
Technical Outlook: AUDUSD – Bullish Signal On Eventual Break Above Cloud Base
The AUDUSD pair hit new one-week high at 0.7835 on Thursday, after fresh extension of recovery rally from 0.7732 low eventually broke into daily cloud.
Base of thick daily cloud limited upside attempts in past two days.
Aussie was boosted by weaker US dollar after Fed minutes and stronger copper price which hit one-month high today.
Close above daily cloud base would be bullish signal for further advance and test of next strong resistance at 0.7874 (Fibo 38.2% of 0.8102/0.7732 downleg / 04 Oct lower top).
The pair is currently riding on fourth, corrective wave of five-wave sequence from 0.8124 which should ideally end under 0.7900 (length of the wave 2) before broader bears resume.
Stronger bullish signal could be expected on extension and close above daily cloud top (0.7929), reinforced by daily Kijun-sen.
Res: 0.7835, 0.7874, 0.7900, 0.7929
Sup: 0.7818, 0.7803, 0.7782, 0.7770
Technical Outlook: USDJPY Looks Another Attack At Key 112.00/111.83 Supports
The pair stands at the back foot on Thursday and on track for renewed attack at 112.00 support, following strong rejections here in past two days.
Fresh easing is probing below 20SMA (112.19) after past two days bearish attempts failed to close below and generate initial bearish signal. Additional pressure comes from softer US dollar following dovish tone from Fed's minutes which may result in final break below triggers at 112.00 and 200SMA (111.83).
Close below the latter will be seen as strong bearish signal and could trigger acceleration towards 111.47 trough and 100 SMA/Fibo 38.2% of 107.31/113.43 at 111.09.
The upside remains capped by 10 SMA (currently at 112.61) and only sustained break above here would sideline persisting downside risk.
Res: 112.61, 112.82, 113.25, 113.43
Sup: 112.19, 112.00, 111.83, 111.47