Sample Category Title
USDJPY Analysis: Loses 0.37% Amid Missile Launch
Another test of another North Korean ballistic missile expectedly led to sharp depreciation of the Dollar against the Yen. During the downfall the pair crossed the weekly S1 at 112.19, which was the only support barrier on its way. However, this active selling had a short term effect, as by the end of the day the buck traders managed to restore lost positions and return the rate back to the 112.50 level. Because of the Fed Meeting Minutes traders with bullish sentiment most probably are going to try to push the pair to the top. However, even in case of hawkish comments it would not be easy, as northern side remains protected by a combination of the 55-, 100- and 200-hour SMAs plus the weekly PP at 112.81. In addition to that, the North Korean problem hasn’t gone anywhere.
XAUUSD Analysis: Awaits Fed Decision
In result of the previous trading session, traders with bullish outlook pushed the pair simultaneously from larger descending and minor ascending channels. The surge was based on increasing tensions between the US and North Korea. However, near the weekly R2 at 1,294.86 it made a rebound, as markets started to worry about the upcoming Fed Meeting Minutes. Given the importance of this event, the pair is expected to move horizontally until 18:00 GMT. Fortunately for the gold, the southern side is protected by a combined support set up by the weekly R1 at 1,285.75 and the 55-hour SMA. If signals from the Fed will be hawkish, the rate most probably is going to fall to an intersection of the 100-, 200-hour SMAs and the 61.8% Fibonacci retracement level near 1,278.90.
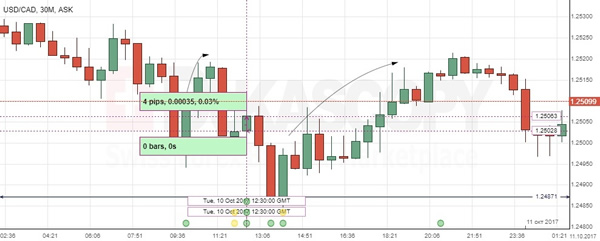
USD/CAD: Canadian Building Permits
The USD/CAD exchange rate rose slightly after the report on the Canadian housing market was published. The Greenback gained against the Canadian Dollar 4 base points to proceed with a temporary decline, touching the session's lows in the 1.2480 area, though the currency pair returned to pre-data levels by the end of Tuesday.
Statistics Canada revealed that the country's building permits dropped 5.5% over the course of September, missing forecasts for a smaller decline of 0.9%. Separate report for September showed that housing starts trend fell less than anticipated, but remained at the strong level exceeding demographic needs. However, figures indicated possible moderation in residential construction in the Q4 of this year.
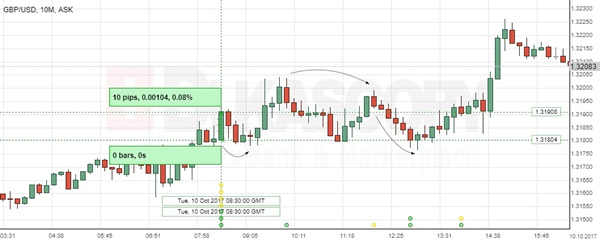
GBP/USD: UK Manufacturing Production
The GBP/USD currency pair kept going upwards in response to Tuesday's report pointing to an advance in the UK manufacturing production. The Sterling extended gains against the US Dollar with a modest increase of 10 pips to appreciate further in the 1.3220 area.
Office for National Statistics report indicated that the Britain's manufacturing output rose 0.4% in the month of August, despite expectations for a weaker growth pace of 0.2%. The set of better-than-anticipated reports supported bullish sentiment, allowing the British Pound to get stronger footing. Overall, upbeat figures increased likelihood of the Bank of England's interest rate hike at the next monetary policy meeting in November.
Technical Outlook: AUDUSD – Daily Cloud Base Caps Recovery Attempts For Now
The Aussie dollar remains bid in early Wednesday's trading and ticked higher but still holding below daily cloud base (0.7812) which marks key barrier. Falling 10SMA (0.7809) caps for now and the pair may show further hesitation under thick daily cloud which weighs heavily. Near-term studies are mixed while dailies are negative and suggest limited correction before broader bears continue. Penetration into cloud could climb towards 0.7840 and key barrier at 0.7874 (Fibo 38.2% of 0.8102/0.7732 downleg/04 Oct lower top) in extension. On the other side, strong downside risk will remain in play while daily cloud caps. Fed minutes are expected to give more clues about near-term direction. Hawkish tone would spark fresh extension of broader downtrend from 0.8124 peak and expose targets at 0.7672 (200SMA) and 0.7632 (Fibo 61.8% of 0.7328/0.8124 rally).
Res: 0.7812, 0.7820, 0.7840, 0.7874
Sup: 0.7772, 0.7748, 0.7733, 0.7670

Technical Outlook: USDJPY – Limited Downside Attempts Ahead Of Fed Minutes
The pair remains in red on Wednesday and looks for retest of 112.00 support (Tuesday's low/Fibo 23.6% of 107.31/113.43 rally) where Tuesday's attempts lower were contained by rising 20SMA. Long-tailed daily candle that was formed on Tuesday signals strong support at 112.00. Today's action was so far held by rising 20SMA (currently at 112.18), but negative tone is prevailing on near-term studies and keeps the downside at risk. Clear break below key supports at 112.00 and 111.84 (200SMA) is needed for stronger bearish signal which would open way for extension towards daily cloud top at 111.37 and Fibo 38.2% at 111.09 which mark next pivotal supports. Broken 10SMA (currently at 112.60) continues to cap upside attempts and marks the upper pivot. From the fundamental side, the US dollar came under pressure on concerns about possible stall of President Trump's Tax plan, with eyes turned towards the release of the minutes of Fed's September meeting, due later today. Markets are expecting the US Central Bank to raise interest rates once more this year as the Fed indicated in the last policy meeting. Further signals about rate hike in December from today's FOMC meeting minutes would offer fresh boost the greenback.
Res: 112.60, 112.82, 113.25, 113.43
Sup: 112.18, 112.00, 111.84, 111.47
AUD/USD Candlesticks and Ichimoku Analysis
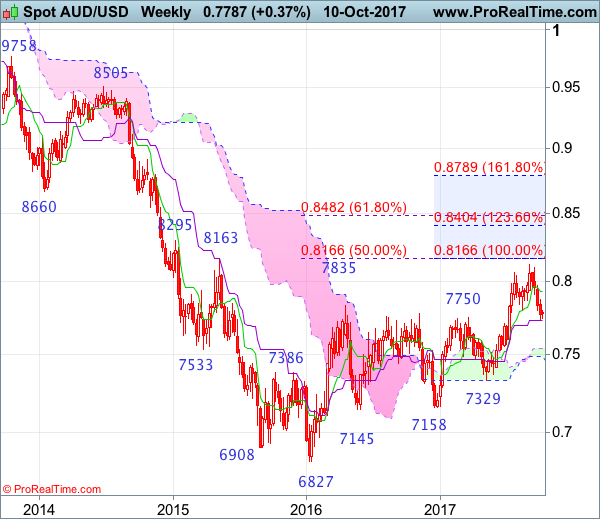
Weekly
• Last Candlesticks pattern: Long white candlestick
• Time of formation: 10 Jul 2017
• Trend bias: Up
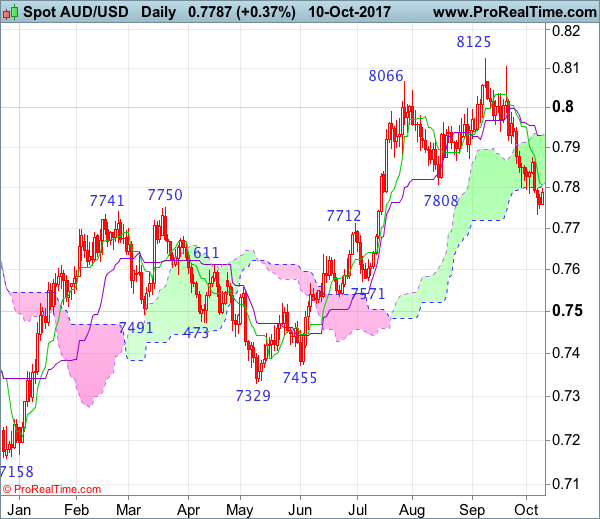
Daily
• Last Candlesticks pattern: Long white candlestick
• Time of formation: 18 Jul 2017
• Trend bias: Up
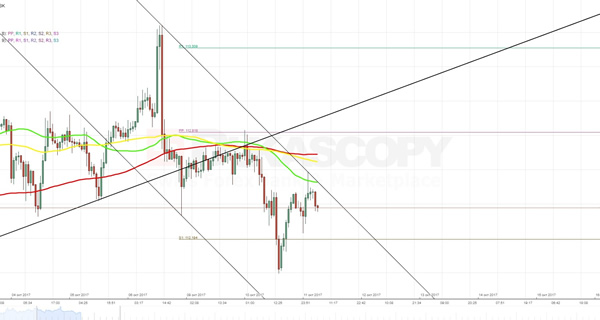
Aussie extended the fall from 0.8125 top in line with our bearish expectation, our short position entered at 0.8060 met downside target at 0.7860 (with 200 points profit), this anticipated selloff adds credence to our view that top has been formed at 0.8125 and downside bias remains for this fall to bring retracement of early upmove to previous resistance at 0.7712, break there would extend weakness to 0.7660-70 and then 0.7620-30 but support at 0.7535-40 should remain intact due to near term oversold condition.
On the upside, whilst initial recovery to 0.7850 cannot be ruled out, reckon resistance at 0.7875 would limit upside and bring another decline later to aforesaid downside targets. Only a daily close above the Kijun-Sen (now at 0.7929) would abort and suggest the fall from 0.8125 has ended instead, bring a strong rebound to 0.7970-75 but still reckon upside would be limited to 0.8000 and price should falter below resistance at 0.8103, bring another decline later.
Recommendation: Short entered at 0.8060 met target at 0.7860 with 200 points profit and would sell again at 0.7880 for 0.7680 with stop above 0.7980
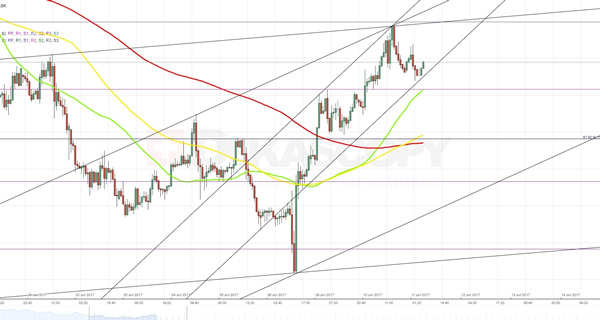
On the weekly chart, last week’s anticipated decline formed another black candlestick (four in a row), adding credence to our view that top has been formed at 0.8125 earlier and consolidation with mild downside bias remains for this move to bring retracement of recent upmove, below 0.7727 (50% Fibonacci retracement of 0.7329-0.8125 as well as current level of the Kijun-Sen) would extend weakness to 0.7675-80 and possibly 0.7630-35 (61.8% Fibonacci retracement) but reckon support at 0.7535 would hold from here.
On the upside, although recovery to 0.7875-80 cannot be ruled out, reckon the Tenkan-Sen (now at 0.7929) would limit upside and bring another decline later. A weekly close above there would defer and risk a stronger rebound to 0.8020-30 but price should falter below resistance at 0.8103 and bring another decline later. A break of 0.8103 resistance would signal the retreat from 0.8125 top has ended instead, bring retest of this level. Looking ahead, only above there would extend the erratic rise from 0.6827 low to previous resistance at 0.8163, then 0.8200 but loss of upward momentum should limit upside to previous resistance at 0.8295.
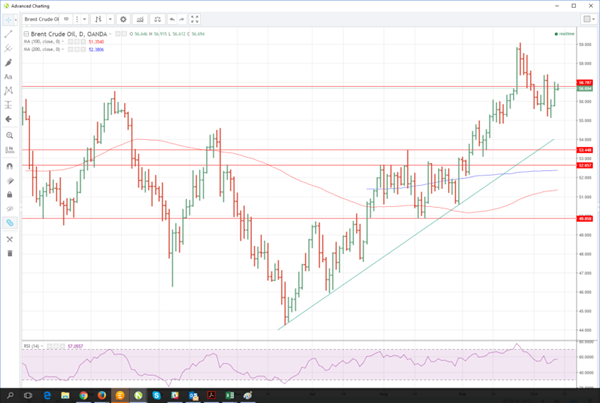
OPEC Comments Uncap Oil’s Wellhead
OPEC comments unleash pent-up demand in oil overnight with WTI the main beneficiary.
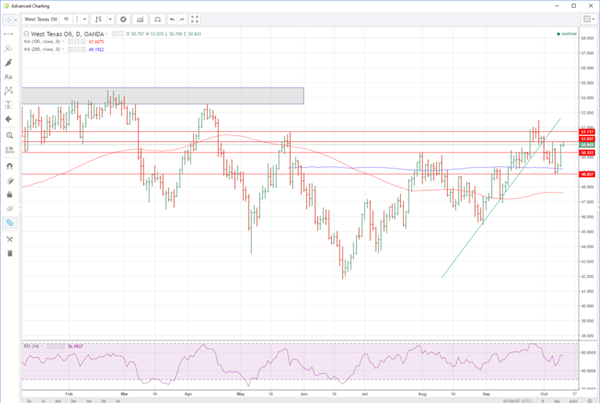
Crude oil prices shot higher overnight with WTI gaining a spectacular 2.80% and Brent a more modest but still respectable 1.55%. The gains left WTI comfortably above $50.00 a barrel closing at 50.80 in New York while Brent regained the 56.00 level to close at 56.70. With the first of the crude inventory repo0rts due tonight in the U.S. from the American Petroleum Institute(API) expected to show a resumption of the drawdowns in inventories, both contracts enter the later part of the week in a healthy state and seemingly poised for more gains.
The OPEC Secretary General got the ball rolling suggesting that world growth and Opec/Non-Opec compliance has the world oil markets rebalancing well underway. He also hinted that the grouping would take any means necessary to ensure this continues at the November 30th meeting. A host of trading houses echoed this view, and Saudi Arabia announced better than expected compliance cutting over 0.5 million barrels a day in September.
Chatter that shale producers are struggling to raise production and dealing with increased costs probably accounted for the WTI outperformance overnight. A return of U.S. traders from Monday's national holiday also helped.
Brent spot is unchanged at 56.75 this morning with resistance just above at 57.00 initially. A break opens a test of the double top at 57.40 which in turn clears the way for a retest of the 58.50/59.00 resistance zone. Support is at 55.80 and then the 55.00 area.
WTI's march higher sees it trading at 50.85 in early Asia, its New York high. There is resistance at 51.00 followed by 51.40, which if broken, clears the way for an advance on last weeks high around 52.50. Support comes in at 49.20, the 200-day moving average, and then 48.80, the lows of Monday and Tuesday.
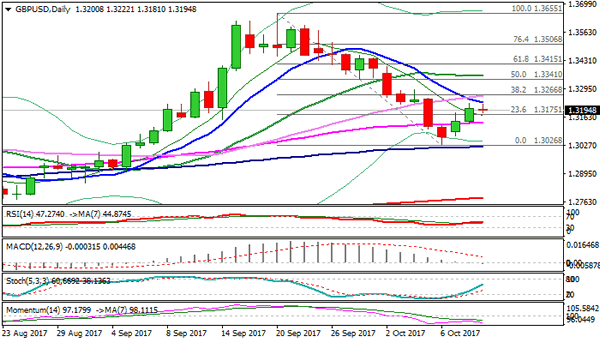
Technical Outlook: GBPUSD – N/T Bulls Are Pausing Under 10SMA, Fibo Barrier At 1.3266 And 55SMA At 1.3134 Are...
Cable's strong two-day advance peaked at 1.3225 and is pausing in early Wednesday's trading , as falling 10SMA/Tenkan-sen (1.3230/34) limited rally and weigh on near-term action. Daily studies are mixed but positive sentiment persists after upbeat UK industry data on Tuesday further boosted expectations of BoE's rate hike in November. Lift above 10SMA/Tenkan-sen would face next strong barrier at 1.3266 (Fibo 38.2% of 1.3655/1.3026) break of which is needed for stronger bullish signal. Meanwhile, dips should be contained by 55SMA (1.3134) to keep near-term bulls in play. Overall picture remains overshadowed by political uncertainty over Brexit negotiations and the position of PM May which could limit corrective action off 1.3026 low.
Res: 1.3234, 1.3266, 1.3318, 1.3356
Sup: 1.3181, 1.3134, 1.3110, 1.3074
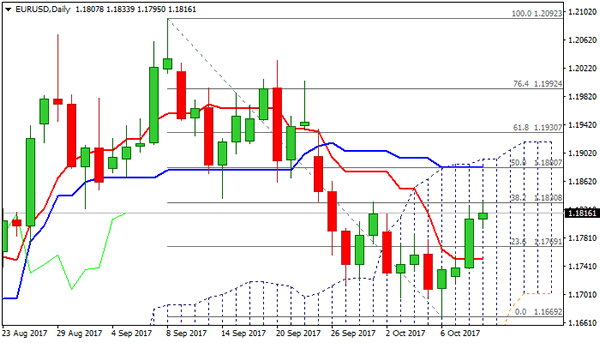
Technical Outlook: EURUSD – Limited Upside After Catalan Relief, Daily Cloud Top Marks Key Barrier
The Euro moved higher in late Asian trading on Wednesday and hit new 12-day high at 1.1833, following overnight's shallow 1.1825/1.1795 correction. The pair maintains positive sentiment from the previous day, with relief after Catalan leader Puigdemont postponed decision of declaring independence, giving fresh boost to the single currency.
However, no significant upside reaction of Euro was seen after decision, as the pair rallied earlier on Tuesday, boosted by upbeat German data and hawkish comments from ECB official.
Wednesday's brief extension above previous day's high faced headwinds at 1.1830 zone (Fibo 38.2% of 1.2092/1.1669 bear-leg /20/55SMA bear-cross / 29 Sep high) and may pause the rally while the latter caps, as slow stochastic on daily chart is entering overbought territory.
Overall bearish picture on daily chart sees 1.1830 zone as ideal reversal point for corrective rally from 1.1669 (06 Oct low), but recovery may extend on sustained break above 1.1830.
Near-term bulls need lift above daily cloud top (1.1893) to neutralize downside risk and signal bottom at 1.1669.
Broken daily Tenkan-sen marks the lower pivot at 1.1751, loss of which would re-focus lows at 1.1669/62.
Res: 1.1833, 1.1880, 1.1893, 1.1930
Sup: 1.1755, 1.1770, 1.1751, 1.1720