Sample Category Title
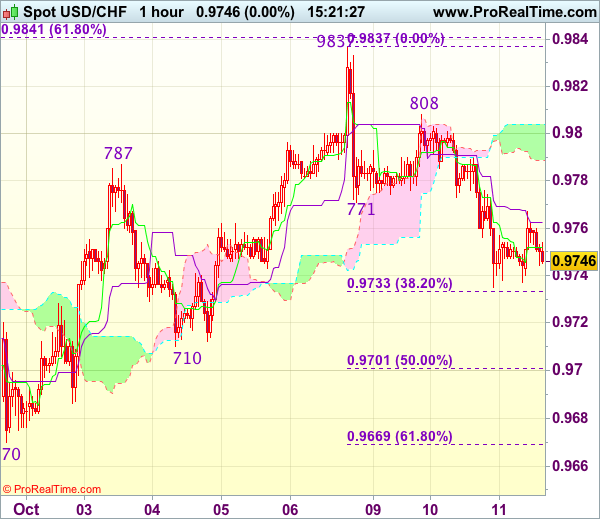
Trade Idea : USD/CHF – Sell at 0.9780
USD/CHF - 0.9745
Most recent candlesticks pattern : N/A
Trend : Near term up
Tenkan-Sen level : 0.9752
Kijun-Sen level : 0.9763
Ichimoku cloud top : 0.9804
Ichimoku cloud bottom : 0.9789
Original strategy :
Sell at 0.9770, Target: 0.9670, Stop: 0.9805
Position : -
Target : -
Stop : -
New strategy :
Sell at 0.9780, Target: 0.9680, Stop: 0.9815
Position : -
Target : -
Stop : -
As the greenback has remained under pressure, adding credence to our view that top has possibly been formed at 0.9837 last week and consolidation with mild downside bias is seen for weakness to 0.9730-35 (38.2% Fibonacci retracement of 0.9565-0.9837), however, break there is needed to retain bearishness for test of previous support at 0.9710 and later towards 0.9669-70 (61.8% Fibonacci retracement and previous support) which is likely to hold from here.
In view of this, would not chase this fall here and we are looking to sell dollar on recovery as previous support at 0.9771 should turn into resistance and limit upside. Only break of resistance at 0.9808 would signal an intra-day low is formed and indicate the pullback from 0.9837 has ended, bring retest of this level later.
Euro Holds Strong As Puigdemont Delays Catalonia’s Independence, Dollar Heavy Amid Concerns On Tax Legislation
The Asian session was relatively quiet on Wednesday as economic releases were limited. Following a stressful day in Spain, where Catalonia's independence was put on hold, the euro remained strong above the 1.18-key level overnight, while the dollar was under pressure against its peers amid escalating geopolitical risks and fears of tax overhaul failing to turn into law.
While thousands of people and armed police forces were gathered in front of the Catalan parliament ready to counteract a possible “Yes vote” on Catalonia's separation from Spain, the Catalan leader, Charles Puigdemont, decided to delay a formal declaration of independence and chose instead to initiate a dialogue with the Spanish government, saying that “the only way forward is democracy and peace”. He also suggested that the European Union should be involved in the talks. Still, Puigdemont and other regional leaders signed a divorce from Spain but it is unknown whether the document has a legal value.
The euro picked up after the decision, rising to a two-week high of $1.1833, being 0.18% up on the day. Euro/pound gained 0.23%, climbing to 0.8960, while euro/yen edged up to 132.86.
The dollar index sank to a two-week low of 92.91 before the session-end as two US bombers flew over the Korean peninsula on late Tuesday, joining other South Korean military jets. In addition, the US military announced in a statement that it conducted for the first time an exercise with Japan and South Korea during the night.
Besides geopolitical tensions, traders were also worried about the future of fiscal policy, after officials from Trump's inner cycle expressed yesterday that Trump's feud with Senator Bob Corker would harm tax overhaul plans as Republicans control the Senate with a shade of majority. However, on Tuesday, Trump stated that his dispute with Corker would not affect progress on tax legislation.
Dollar/yen was slightly down at 112.37. Dollar/swissie was steady at 0.9751, while the safe-haven gold remained flat at $1,287.60 per ounce.
Later in the day, the focus will turn on the Fed's September meeting minutes for more details on the path of monetary policy.
In Japan, core machinery orders rose surprisingly by 4.4% y/y in August, after contracting by 7.5% in the previous month, while analysts had projected a soft expansion of 0.8%. This was the highest growth since April.
The pound retreated by 0.13% to $1.3184 as investors doubted whether a rate hike is appropriate given uncertain Brexit negotiations which so far led nowhere.
In other currencies, the aussie reversed earlier gains in the session arising from better-than-expected figures on consumer confidence, standing flat at $0.7778. Particularly, consumer sentiment measured by the Westpac Banking Corporation increased by 1.1 percentage points to 3.6% in October. Its New Zealand cousin weakened moderately to $0.7065 amid political uncertainty in the country.
Dollar/loonie was moving sideways around 1.2521.
Regarding energy markets, oil prices held onto gains after a strong rally on Tuesday. WTI crude was 0.24% up at $51.03 per barrel and Brent picked up by 0.04% on the day to $56.63.
Trade Idea : GBP/USD – Stand aside
GBP/USD - 1.3196
Most recent candlesticks pattern : N/A
Trend : Down
Tenkan-Sen level : 1.3202
Kijun-Sen level : 1.3192
Ichimoku cloud top : 1.3146
Ichimoku cloud bottom : 1.3106
New strategy :
Stand aside
Position : -
Target : -
Stop : -
As cable has eased after faltering below resistance at 1.3226 (yesterday’s high), suggesting consolidation below this level would be seen and pullback to the upper Kumo (now at 1.3146) cannot be ruled out, however, break of support at 1.3126 is needed to signal the rebound from 1.3027 (last week’s low) has ended, bring weakness towards 1.3070-75 first.
On the upside, above said resistance at 1.3226 would extend the corrective rise from 1.3027 to 1.3240-50 (50% Fibonacci retracement of 1.3455-1.3027 and previous resistance), however, further sharp move beyond 1.3270 should not be repeated and price should falter below 1.3291-92 (61.8% Fibonacci retracement and previous resistance), bring retreat later. As near term outlook is mixed, would be prudent to stand aside for now.
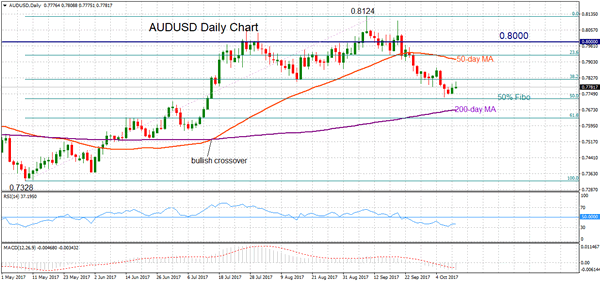
AUDUSD Pauses Downtrend, Short-Term Bearish Bias Remains
AUDUSD is up 0.8% after reversing on Friday from 3-months lows. The pair still looks bearish in the short term but downside momentum has paused just above the 50% Fibonacci retracement of the upleg from 0.7328 to 0.8124. Strong support is expected at this level at 0.7724.
Resistance levels appear at 0.7818 and 0.7935. Any gains above the key psychological level of 0.8000 would give scope for more near-term strength to test the May high of 0.8124. From here, AUDUSD would be on a path for further gains to resume the May to September uptrend.
Short-term risk is still tilted to the downside since the market has broken below the 50-day moving average. Momentum signals are bearish too. MACD is below zero and RSI is below 50, although the indicator has stopped falling ahead of oversold territory. This points to near-term consolidation or a pull-back in prices.
Break of support at 0.7724 would turn the focus back to the downside to target 0.7630 and then 0.7520 ahead of the May low of 0.7328.
While downside pressure appears to have eased for now following Friday’s reversal, there is no clear indication that the bearish phase has ended. The market would have to reclaim the 0.7900 handle to change this view.
Euro Eyeing Upside Break Vs Japanese Yen?
Key Highlights
- The Euro continues to trade above a major support area at 131.75 against the Japanese Yen.
- There are two important bearish trend lines forming with resistance at 132.60-80 on the 4-hours chart of EUR/JPY.
- Japan's New Machinery Orders rose 3.4% in August 2017 (MoM), compared with the forecast +1.1%.
- Today in the US, the FOMC meeting minutes will be published, which might ignite swing moves in the short term.
EURJPY Technical Analysis
The Euro attempted a break below 131.75 against the Japanese Yen on a few occasions, but failed. The EUR/JPY pair is currently consolidating above 131.75 and preparing for the next move.
Looking at the 4-hours chart, there are two important bearish trend lines forming with resistance at 132.60-80. The trend line resistance is also near the 38.2% Fib retracement level of the last decline from the 134.40 high to 131.74 low.
Moreover, the 100 simple moving average (red) on the same chart is at 132.85 to prevent gains above 133.00. As long as the pair is below the 133.00 resistance and the 100 SMA, there are chances of a downside break.
On the downside, the 131.75 area is a crucial support since is coincides with the 200 simple moving average (green). A break and close below 131.75 would call for more losses in EUR/JPY towards the next support at 130.40.
On the flip side, a close above 132.85 and 133.00 could push the pair back in the bullish path for an extension towards the 134.20 level.
Japan's New Machinery Orders
Today in Japan, the Machinery New orders figure for August 2017 was released by the Cabinet Office. The forecast was slated for a rise of 1.1% in orders compared with the previous month.
The actual result above the forecast as there was a rise of 3.4% in orders. In terms of the yearly change, there was a rise of 4.4%, which was a lot more compared with the forecast of +0.8% and the last -7.5%.
To sum up, the EUR/JPY pair is poised for the next move either above 132.70 or below 131.75. The chances of an upside break are high considering the recent price action and H4 RSI moving towards 60.
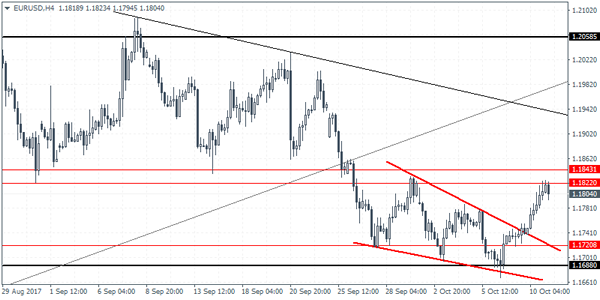
Trade Idea : EUR/USD – Buy at 1.1765
EUR/USD - 1.1823
Most recent candlesticks pattern : N/A
Trend : Near term up
Tenkan-Sen level : 1.1815
Kijun-Sen level : 1.1798
Ichimoku cloud top : 1.1756
Ichimoku cloud bottom : 1.1726
Original strategy :
Buy at 1.1740, Target: 1.1840, Stop: 1.1705
Position : -
Target : -
Stop : -
New strategy :
Buy at 1.1765, Target: 1.1865, Stop: 1.1730
Position : -
Target : -
Stop : -
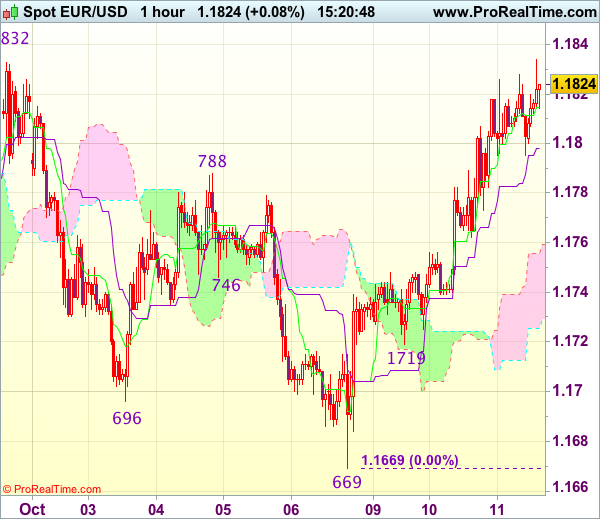
As the single currency has risen again today, adding credence to our view that the rise from 1.1669 temporary low (formed last week) is still in progress and mild upside bias remains for this move to bring retracement of recent decline to 1.1850-55 (50% Fibonacci retracement of 1.2035-1.1669), then 1.1861-62, however, reckon upside would be limited to 1.1895-00 (61.8% Fibonacci retracement of 1.2035-1.1669) and bring retreat later.
In view of this, would not chase this rise here and we are still looking to buy euro on subsequent pullback as 1.1760-65 should limit downside and bring another rebound. Only break of indicated support at 1.1719 would abort and signal top is formed, risk weakness to 1.1695-00 first.
Trade Idea : USD/JPY – Sell at 112.80
USD/JPY - 112.36
Most recent candlesticks pattern : N/A
Trend : Up
Tenkan-Sen level : 112.41
Kijun-Sen level : 112.35
Ichimoku cloud top : 112.88
Ichimoku cloud bottom : 112.69
Original strategy :
Sell at 112.65, Target: 111.65, Stop: 113.00
Position : -
Target : -
Stop : -
New strategy :
Sell at 112.80, Target: 111.80, Stop: 113.15
Position : -
Target : -
Stop : -
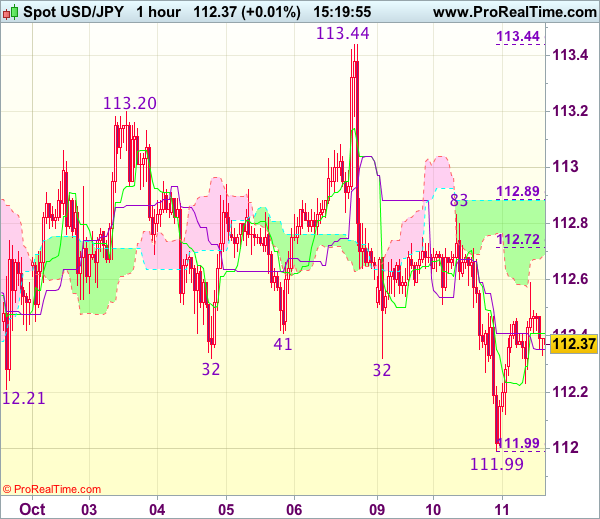
Although dollar rebounded after falling to 111.99 yesterday and initial upside risk is for recovery to 112.70-75 (50% Fibonacci retracement of 113.44-111.99), however, reckon 112.83-89 (yesterday’s high and 61.8% Fibonacci retracement) would limit upside and bring another decline later, below said support at 111.99 would add credence to our view that top has been formed at 113.44 and extend weakness to 111.75-80, then towards 111.47 support but oversold condition would limit downside and reckon 111.11 support would remain intact.
In view of this, we are looking to sell dollar on recovery as 112.83 resistance should limit upside and bring another decline. A break of indicated level at 112.83-89 would abort and signal low is formed, bring a stronger rebound to 113.10-20 but price should falter well below said last week’s high at 113.44.
XAUUSD Intraday Analysis
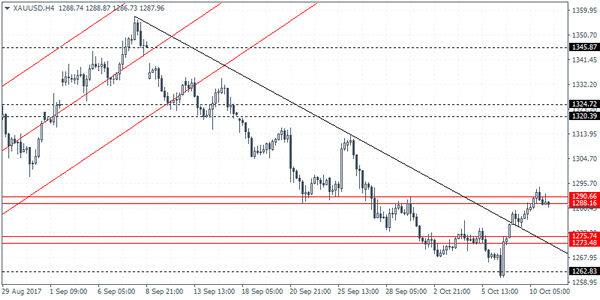
XAUUSD (1287.96): Gold prices maintained strong gains yesterday as price action broke past the falling trend line and is currently seen trading in the resistance level of 1290 - 1288. We can expect to see a near-term dip but declines could be limited to the support level of 1275 - 1273 area of support. As long as this support holds, the decline to this level could signal a retest of the trend line breakout. A successful rebound off this support level will keep the bias to the upside with gold prices likely to break past the resistance level and extend gains to the next main resistance level seen at 1320 - 1324 area.
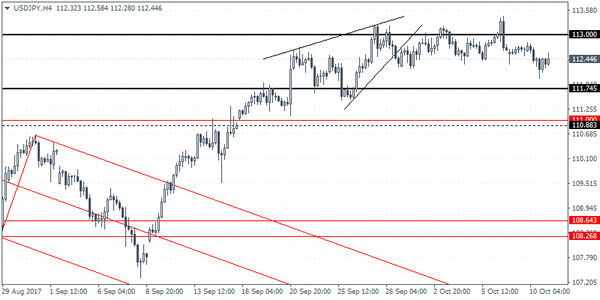
USDJPY Intraday Analysis
USDJPY (112.44): The USDJPY continues to consolidate near the major falling trend line around the 113.00 levels. Price action was seen briefly retreating from this resistance level yesterday and further downside could be expected. Support at 111.74 remains within reach to the downside. However, the sideways price action could be maintained in the near term. USDJPY will see further direction being established on a breakout above 113.00 or below 111.74.
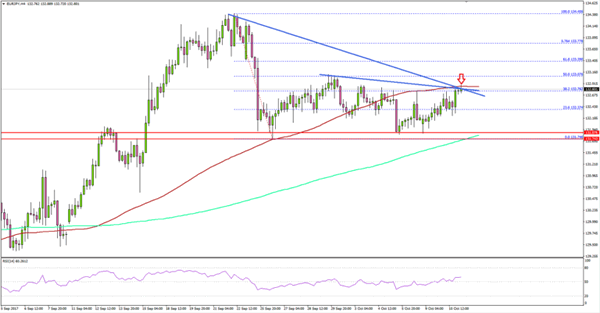
EURUSD Intraday Analysis
EURUSD (1.1804): The euro maintained the gains yesterday as price action was seen rising to the initial resistance level of 1.1822 by the day's close. Currently, EURUSD is seen declining off this resistance level, although further near-term upside could see price testing 1.1850. The rally to the resistance level marks the upside move and could see a near term pullback. A retest back to the breakout level from the descending wedge pattern is the main risk. However, a pullback could likely trigger a potential inverse head and shoulders pattern in the making. This would put EURUSD on a bullish track towards the minimum 1.1902 and potentially up to 22 September's unfilled gap near 1.1948. In the event of a decline below 1.1720, it would invalidate this still nascent inverse head and shoulders pattern.