Sample Category Title
USD/JPY Mid-Day Outlook
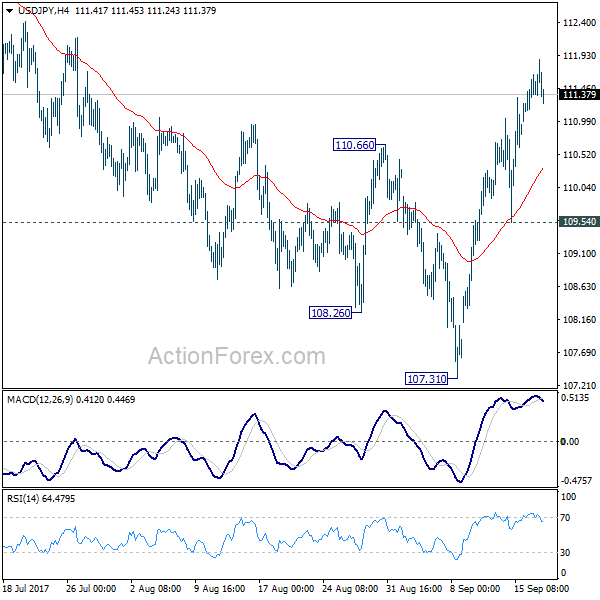
Daily Pivots: (S1) 111.15; (P) 111.40; (R1) 111.82; More...
Intraday bias in USD/JPY remain son the upside for the moment despite the shallow retreat. Current rise from 107.31 should target medium term channel resistance (now at 112.91). Sustained break there will argue that whole correction from 118.65 has completed too. In that case, further rise should be seen to 114.49 resistance for confirmation. On the downside, break of 109.54 support is needed to indicate completion of the rebound. Otherwise, outlook will stay cautiously bullish in case of retreat.
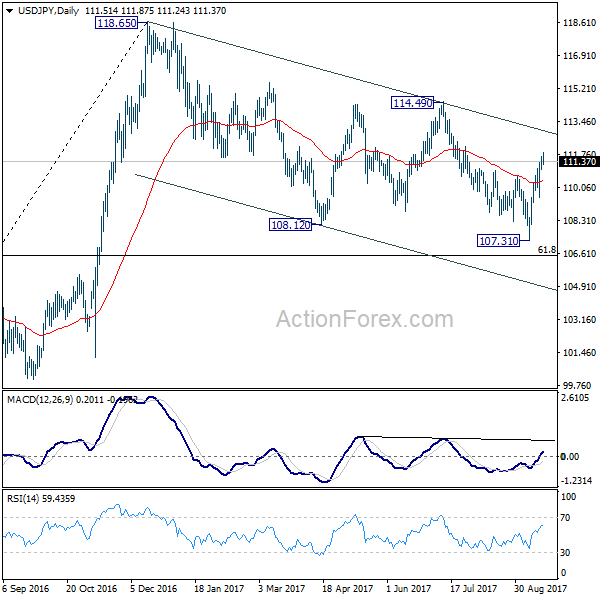
In the bigger picture, rise from 98.97 (2016 low) is seen as the second leg of the corrective pattern from 125.85 (2015 high). It's unclear whether this this second leg has completed at 118.65 or not. But medium term outlook will be mildly bearish as long as 114.49 resistance holds. And, there is prospect of breaking 98.97 ahead. Meanwhile, break of 114.49 will bring retest of 125.85 high. But even in that case, we don't expect a break there on first attempt.
Trade Idea Update: EUR/USD – Hold long entered at 1.1970
EUR/USD - 1.1986
Original strategy :
Bought at 1.1970, Target: 1.2070, Stop: 1.1935
Position : - Long at 1.1970
Target : - 1.2070
Stop : - 1.1935
New strategy :
Hold long entered at 1.1970, Target: 1.2070, Stop: 1.1935
Position : - Long at 1.1970
Target : - 1.2070
Stop : - 1.1935
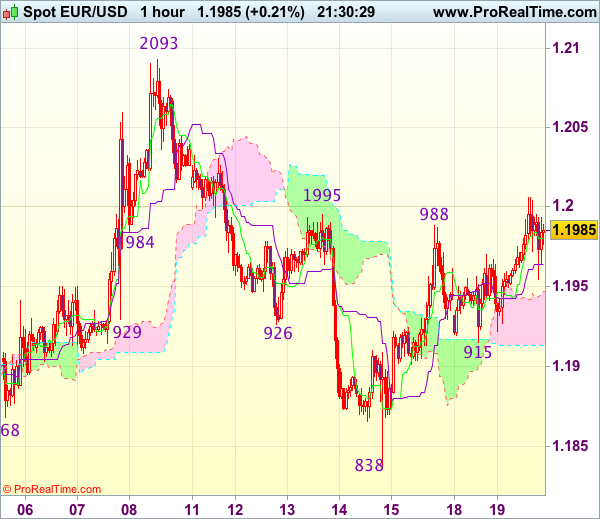
Euro’s intra-day breach of indicated resistance at 1.1995-00 (previous resistance and 61.8% Fibonacci retracement of 1.2093-1.1838) adds credence to our view that the fall from 1.2093 top has ended at 1.1838 last week and consolidation with upside bias remains for further gain to 1.2030-35, then 1.2050-55, however, break of 1.2070 is needed to signal early upmove has resumed for retest of 1.2093 first.
In view of this, we are holding on to our long position entered at 1.1970. Below 1.1945-50 would defer and risk weakness towards support at 1.1915 (yesterday’s low) but only break there wold signal the rebound from 1.1838 has ended instead, bring further fall to 1.1880.
US: Homebuilding Activity Dented by Hurricane Harvey, But Fundamentals Remain Strong
Homebuilding surprised to the upside in August even amid Hurricane Harvey's wrath, which disrupted activity in the final days of August. Markets had anticipated a 1174k print but homebuilders broke ground on 1180k units, from an upwardly revised July figure (+35k).
Single-family starts advanced by 13k from a downwardly revised July reading (-18k), clocking in at 851k, while multi-family construction contracted (-23k), to 329k, from an upwardly revised (+53k) July figure.
Building permits came in strong at 1300k, while markets had anticipated 1220k. The volatile multi-family segment accounted for the entirety of the increase (+82k), with single-family permits stumbling (-12k) from an upwardly revised July reading (+1k) to clock in at 800k in August.
As expected, activity in the South weighed (-48k) on account of construction disruptions related to Hurricane Harvey, which made landfall in Texas on August 25th. Apart from this, both the West (+12k) and Midwest (+36) saw homebuilding gain momentum, while the Northeast saw a retrenchment in activity (-10k) for the second consecutive month.
Key Implications
Today's report is a healthy one when considering the negative impact from Hurricane Harvey on construction combined with the upward revisions to July's figures. Although the continued effects of Hurricane Harvey, in addition to Hurricane Irma, will lead to a cooling in September's housing starts, this activity will be recouped as the year progresses. With an estimated minimum 20k houses destroyed in the two hurricanes combined, residential investment will receive a boost in the fourth quarter of 2017 and first half of 2018 as rebuilding begins, with additional, but diminishing impacts likely to be felt in the quarters thereafter.
Consumers are reaping the benefits of a tightening labor market and this will support homebuilding as wages turn higher. Demand remains strong as reflected in current record-low selling times in the new home market, with lending conditions also remaining supportive. Mortgage rates in August were over 30 basis points lower than their recent peak at the start of the year.
All told, while the following months are expected to reflect additional hurricane-related disruptions to construction, this report confirms that fundamentals remain strong in the housing market and will continue to support residential investment as a positive contributor to growth over the next year.
USD/CAD Facing Tough Resistance
The currency pair is trading in the red right now and tries to retreat a little after the yesterday's amazing rally. Remains to see what will happen later as the United States is to release important economic data. The fundamental factors will drive the rate so you should be very careful not to suffer a heavy loss.
We may have some volatility in the US trading session, the USD needs a helping hand from the United States economy, but remains to see if will receive one.
The Building Permits could decrease from 1.23M to 1.22M in the previous month, while the Current Account is expected to increase from -117B to -115B in the Second Quarter. Moreover, the Housing Starts may increase to 1.17M, from 1.16M, while the Import Prices could increase by 0.4%, beating the 0.1% growth in the former reading period.
Price dropped a little today, but continues to pressure the lower median line (LML) of the red descending pitchfork and the median line (ml) of the blue descending pitchfork. Only a valid breakout above these levels will confirm a further increase. However, a rejection from the confluence area formed at the intersection between the LML with the median line (ml) will send the rate towards the 150% Fibonacci line (down sloping red line). I've drawn a minor blue ascending pitchfork hoping that I'll catch a broader upside movement, technically is expected to reach the median line (ml), but a disappointment from the US later will send the rate tumbling.
Brent In The Buyers Territory
The Brent Oil rallied today and tries to stay higher despite the yesterday's drop. Price maintains a bullish perspective as is trading in the buyer's territory, the major upside target remains at the median line (ML) of the major ascending pitchfork. I've said in the last weeks that it could reach the $57 per barrel very soon.
Is trapped within the ascending channel, so it should approach and reach fresh new highs in the upcoming period even if will make a small correction.
NZD/USD Moving Higher To Test The Sellers
Price rallies again, but remains to see if will have enough directional energy to reach and retest the third warning line (WL3) of the major descending pitchfork. Has shown some exhaustion signs in the last days because has failed to stabilize above the 38.2% retracement level. Only a valid breakout above the WL3 will confirm a further increase, while a failure to reach it will signal another leg lower.
Trade Idea Update: USD/JPY – Buy at 110.70
USD/JPY - 111.33
Original strategy :
Buy at 111.00, Target: 112.00, Stop: 110.65
Position : -
Target : -
Stop : -
New strategy :
Buy at 110.70, Target: 111.70, Stop: 110.35
Position : -
Target : -
Stop : -
As the greenback has retreated after rising to 111.88, suggesting minor consolidation below this level would be seen and pullback to 111.00 cannot be ruled out, however, reckon 110.60-70 would limit downside and bring another rise later, above said resistance would extend recent upmove to 112.00, then 112.20 (previous resistance) but near term overbought condition should prevent sharp move beyond 112.40-45.
In view of this, would not chase this move here and would be prudent to buy dollar on subsequent pullback as 110.60-70 should limit downside. Below the lower Kumo (now at 110.50) would abort and signal a temporary top is formed instead, risk correction to 110.30, then towards 110.00 which is likely to hold from here.
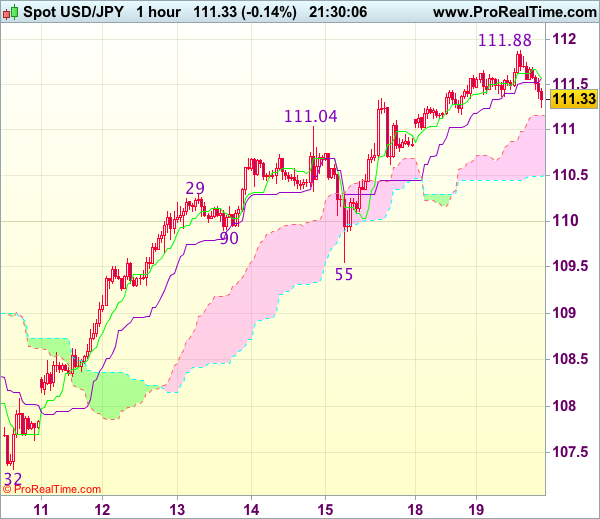
USDJPY Touches 111.87
The USDJPY pair moved to its highest trading level since July 27th during the pre-European session market open, hitting 111.87, as large stop-loss orders were triggered above the pairs monthly pivot point.
Price-action has now softened, with the pair turning lower to test intraday buying demand back towards the USDJPY key 200-day moving average, currently located at the key 111.47 level.
Going forward, today's daily price-close will be critical, with USDJPY buyers looking for a second daily candle to close above the pairs 200-day moving average.
Key intraday resistance is found at 111.65, the current daily price-high at 111.87 and the July 26th swing-price high, at 112.19.
To the downside, key technical support below the 111.47 level is found at 111.37, and the 100-week moving average, at 111.13.
Below 111.13, further support is found at 110.84, 110.68 and the pairs weekly pivot point, at 110.10.
EURUSD Bulls Back in Control
The EURUSD pair has moved to an intraday price-high of 1.2006, after a series of positive eurozone economic data points. The German ZEW survey for the month of September, beat market expectations and the eurozone's current account surplus also widened.
Going forward, the euro retains a strong position against the greenback, ahead of tomorrow's Federal Reserve interest rate decision whilst price-action holds above the pairs weekly pivot point, found at 1.1938.
Despite today's bullish intraday rally above the 1.2000 level, the euro failed to break above the former weekly high, at 1.2029. A higher weekly price higher, should signal further EURUSD gains, whilst multiple price failures below the 1.2029 level may signal a deeper downside correction on the pair.
Key technical support is located at the current daily price low, at 1.1953, and the weekly pivot point, at 1.1938. Below 1.1938, price will likely target towards 1.1915, and 1.1889.
To the upside, key intraday resistance is found at 1.1979 and 1.2006. Above the 1.2006 level, further resistance is found at the former weekly high, at 1.2029, and the key long-term Fibonacci resistance level, 1.2039.
Elliott Wave Analysis: EURGBP Looking Down and Oil Up
Good day traders! Today's focus is EURGBP and Crude oil.
On the bearish side of euro the most interesting pair can be EURGBP which is trading nicely lower this month. As such, traders may keep a close eye on corrective pullbacks in three legs before downtrend may resume. We are tracking a fourth wave right now which may rise even to 0.8930/0.8980 zone from where a new drop lower may show up, ideally later this week.
EURGBP, 1H
Crude oil is very interesting, now looking bullish again after recent spike down to 49.60 where energy might have completed a three wave drop within wave four pullback. We think that sooner or later price will break to a new high and extend up to 51.50, maybe even 52.00 by the end of the week.
Crude oil, 1H