Sample Category Title
BoC’s Lane Jawbones The CAD
Yesterday, BoC policymaker Timothy Lane said they are watching the strengthening CAD closely, and that they will be taking this into account 'pretty strongly' in making their decisions. The Loonie dipped immediately on these comments, as it had been a while since the BoC expressed concerns regarding the exchange rate. In our view, there is a decent probability for some similar remarks in the next BoC statement. Governor Poloz could also try to talk down the currency when he speaks on the 27th of September.
Therefore, we see the case for USD/CAD to continue correcting higher over the next few weeks, especially if the FOMC appears somewhat optimistic tomorrow and keeps the prospect of a December rate hike on the table. That said, the pair's broader trend remains to the downside, amid elevated expectations for another BoC rate hike this year (75% according to Canada's OIS) and strong Canadian economic data across the board.
USD/CAD edged north yesterday, breaking above the resistance (now turned into support) barrier of 1.2250 (S1) to hit resistance at 1.2335 (R1). Although the rate continues to trade below the prior upside support line drawn from the low of the 26th of July, we see the case for the pair to continue its recovery for a while. A break above 1.2335 (R1) would confirm that and could set the stage for extensions towards our next resistance of 1.2430 (R2).
As for the bigger picture, the price structure on the daily chart remains lower peaks and lower troughs below the downtrend line drawn from the peak of the 5th of May, which keeps the medium-term outlook negative. As such, we would treat the latest recovery, or any extensions of it that stay limited below that trend line, as a corrective phase.
Sterling pulls back as Carney hints at limited rate hikes
Speaking at the IMF yesterday, BoE Governor Mark Carney said that interest rates have to rise a little in order for the level of monetary accommodation to stand still, partly due to the possibility that the global neutral rate of interest may be rising. His comments suggested that one of the reasons the BoE may hike rates is that other major central banks are scaling back stimulus. Overall, he left the impression that any BoE rate increase may be a one-and-done move, as opposed to the beginning of a typical normalization cycle. Even though that shouldn't come as a surprise given the BoE's continued signals that any hikes would be gradual and to a limited extent, sterling still corrected lower on Carney's not-so-hawkish tone.
Despite this correction lower, the outlook for sterling remains positive amid heightened speculation for a near-term rate hike, perhaps as early as at the November meeting when the Bank will also issue fresh economic forecasts. However, we have to reiterate that in our view, UK politics and the lack of progress in the Brexit negotiations remain key risks the market seems to be overlooking at the moment. In particular, the upcoming Conservative Party conference on the 1st of October presents a notable source of uncertainty, as any rebellious attempt to replace PM May could cast a shadow on the latest GBP rally. Indeed, the latest reports of friction between PM May and Foreign Secretary Johnson add credibility to this potential risk.
GBP/USD traded lower after it hit resistance at 1.3615 (R1). Nevertheless, the slide was stopped by the 1.3470 (S1) line and then the pair rebounded somewhat. The price structure on the 4-hour chart remains higher peaks and higher troughs and thus, we still consider the short-term outlook to be positive. We would expect the bulls to take advantage of yesterday's slide and aim for another test near the 1.3615 (R1) resistance. Having said that though, given the rate's proximity to the longer-term downside resistance line taken from the peaks of July 2014, we prefer to wait for a clear close above the crossroads of that line and the 1.3615 (R1) zone before we get confident on larger bullish extensions.
Today's highlights:
During the European day, Germany's ZEW survey for September is coming out. The current conditions index is expected to have remained more or less unchanged, while the expectations index is forecast to have risen. Although this survey is not usually a major market mover, further improvement in Eurozone's growth engine may heighten somewhat speculation with regards to a QE exit by the ECB in coming months and thereby, support the common currency a bit. From the US, we get building permits and housing starts, both for August. The nation's current account balance for Q2 is also coming out. From Canada, we get manufacturing sales for July.
USD/CAD
Support: 1.2250 (S1), 1.2130 (S2), 1.2060 (S3)
Resistance: 1.2335 (R1), 1.2430 (R2), 1.2535 (R3)
GBP/USD
Support: 1.3470 (S1), 1.3400 (S2), 1.3320 (S3)
Resistance: 1.3615 (R1), 1.3825 (R2), 1.4000 (R3)
WTI Oil Futures Turn Bullish After Break Above 50 Level But Momentum Slows
WTI oil futures stalled their rally at a 4-month high of 50.82 before entering a consolidation phase above what was a key resistance level and now support at 50.
Downside risk is limited in the near term and the market is expected to remain supported above the 20 SMA on the 4-hour chart. The fact that this moving average is rising and is above the 50 SMA gives room for more upside. Momentum oscillators are still in bullish territory although both RSI and MACD are showing a slowdown in the market’s recent upward trajectory.
Oil prices may struggle to rise above 50.82 and the market is expected to continue moving sideways in the short term below this resistance level. Clearing this top would open the way for another leg higher towards the next major peak at 51.97 (May 25 high).
A break below key support at 50.00 would shift the focus to the downside. A Fibonacci level at 49.56 comes into view as possible support. This is the 23.6% Fibonacci retracement level of the recent uptrend from 45.56 to 50.82. The 38.2% Fibonacci at 48.79 is the next support level. This level held after several tests earlier this month. A further extension below the 50% Fibonacci at 48.18 would suggest the short-term bullish phase has ended.
In the near term, WTI is expected to remain supported in a neutral bias above 50.00. Only a move above 50.82 would see a strengthening in the recent uptrend. In the bigger picture, the medium-term trend is neutral.
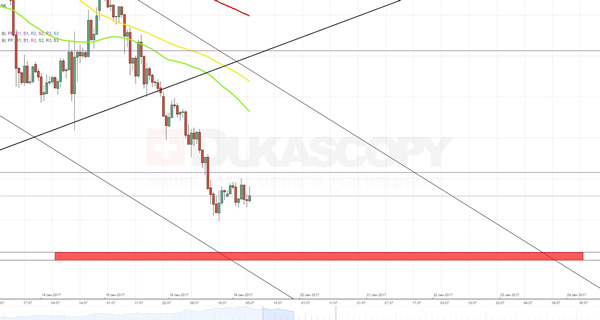
XAUUSD Analysis: Prepares To Test 1,300.00
In line with expectations, the yellow metal continued to lose value against the buck yesterday, in the process crossing the weekly S1 at 1,310.77. From a daily perspective, the downfall should continue today as well.
But in order to do that, the exchange rate has to break through a combined support set up by the weekly S2 at 1,301.03 and the monthly PP at 1,300.04. The fact that this barrier is located at the psychological level and also coincides with the bottom edge of a descending channel suggests that a rebound might happen at least in the short run. However, even in the case of a rebound recovery of the gold is unlikely to last for long due to pressure from the slipping 55- and 100-hour SMAs.
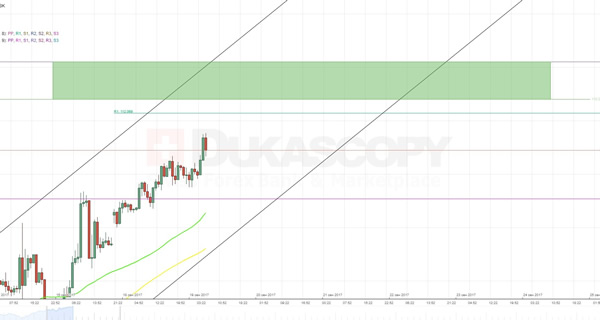
USDJPY Analysis: Approaches To Upper Edge Of Dominant Pattern
The pressure from the 20- and 55-hour SMAs as well as formation of a minor ascending triangle expectedly led to further appreciation of the back against the Yen. Currently, the pair is confidently approaching to the weekly R1, which is located at the 112.07 level. The fact that the rate experiences pressure from the above MAs as well as the fact that the rate is fluctuating in an ascending channel point out on the further surge. However, after crossing this level there is a high chance that the pair will retreat, as an area between the 112.20 and 112.55 levels represents a location of the monthly R2, the 200-day SMA and, most importantly, the upper edge of a long-term falling wedge. So, from a daily perspective after reaching the 112.55 mark, the Yen is expected to take the lead once again.
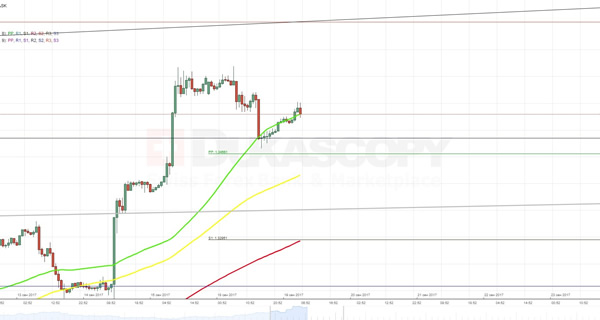
GBPUSD Analysis: Falls As Carney Speaks
As it was expected, a steady horizontal movement represented an anticipation of the speech that was delivered by Governor Carney yesterday. On the one hand, it did not let to the anticipated appreciation of the Pound. But on the other hand, the plunge of the rate was expectedly neutralized by a combination of the 55-hour SMA and the monthly R2 at 1.3485. At the moment, the currency rate is not facing any resistance on its way up until the monthly R3, which is located at the 1.3701 level. In contrast, the opposite direction contains a whole package of technical indicators, including the weekly PP and the approaching 100-hour SMA, which altogether form a combined support level. Accordingly, the Sterling is likely to continue to pave the path to the top.
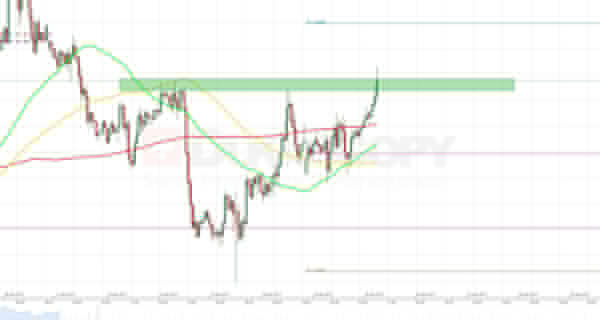
EURUSD Analysis: Tries To Break Above 1.1995
As it was forecasted, the rate failed to make any substantial moves yesterday. To be precise, bears tried to push the pair to the bottom at least three times but all these attempts were neutralized by a combination of the 55- and 100-hour SMAs. Accordingly, today it is testing an area between the 1.1985 and 1.1995 levels. Certain technical suggests that this attempt will fail, as the pair is overbought. On the other hand, the rate experiences constant pressure from the above moving averages, which now became also strengthened by the 200-hour SMA. From this perspective, the surge towards the weekly R1 seems a more likely scenario. In addition, if the German ZEW Economic Sentiment will justify expectations that could give the Euro a necessary impulse to reach the above target.
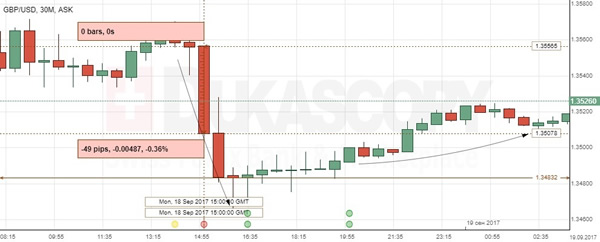
GBP/USD: BoE’s Governor Carney Speech
The British Pound depreciated against the Greenback by 49 base points or 0.36% falling further to touch an intraday low at the 1.3483 mark, after the Bank of England's Governor Mark Carney delivered a speech on Monday.
Mark Carney provided no signs that could undermine the last week's BoE decision to keep key rates unchanged at 0.25%, but noted that the Central Bank would need to raise interest rates gradually and at a limited extent in the coming months given higher inflationary pressures and the lingering erosion of slack in the country's economy. The Bank of England's monetary stimulus withdrawal would be capable of returning inflation to its 2% target, down from the 2.9% registered in August.
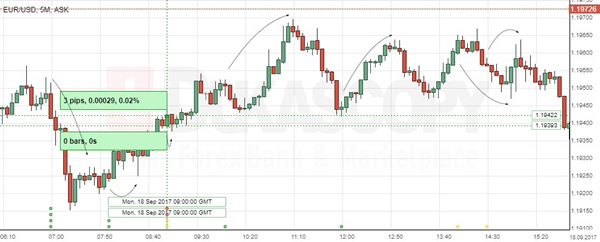
EUR/USD: EU Final Consumer Price Index
The Euro added only 3 base points against the US Dollar after the reports on the European consumer inflation were published. Other data also failed to determine the leading sentiment in EUR/USD, while the currency pair entered into a symmetrical triangle at short, trading in a narrow range between the 1.194 and 1.196 levels.
The Eurostat released its final inflation data for the month of August, showing that the headline Index rose 1.5% in line with estimates, while the core figure also matched forecasts with a 1.2% increase. The Euro is set to remain strong, while the only occasion able to undermine the European single currency's stability is expected to be a speculation ahead of the Germany's Federal Election on September 24.
GBP/USD Elliott Wave Analysis
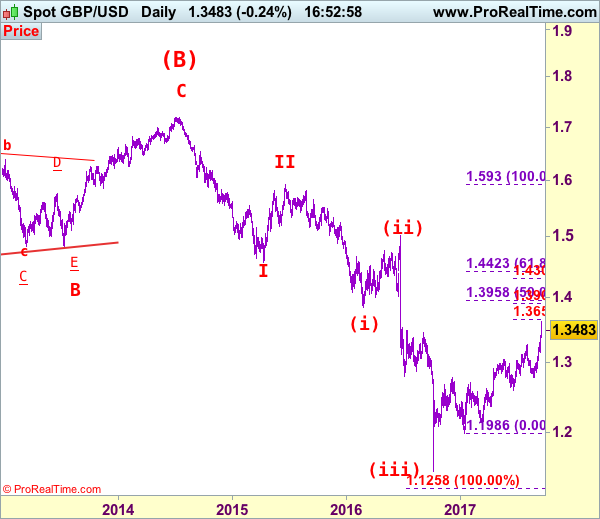
GBP/USD – 1.3491
Sterling did rallied again after brief pullback to 1.3153 (we recommended in our previous update to buy at 1.3165 and a long position was entered), the subsequently surged to as high as 1.3619 (our upside target at 1.3365 was met basically on the same day with 200 points), this anticipated move adds credence to our bullish view that the medium term erratic rise from 1.1986 low has resumed and upside bias remains for this move to extend further gain to 1.3650-55 (100% projection of 1.1986-1.3048 measuring from 1.2589) and 1.3700-10, however, overbought condition should limit upside to 1.3800 and price should falter well below 1.3955-60 (50% Fibonacci retracement of intermediate downtrend from 1.5930-1.1986).
Our preferred count on the daily chart is that cable's rebound from 1.3500 (wave (A) trough) is unfolding as a wave (B) with A ended at 1.7043, followed by triangle wave B and wave C as well as wave (B) has possibly ended at 1.7192, below support at 1.4232 would add credence to this count, then further fall to 1.4000 level would follow but reckon downside would be limited to 1.3655 support and price should stay above previous support at 1.3500.
On the downside, although current pullback from 1.3619 suggests initial downside risk is for minor correction to 1.3450-55, reckon downside would be limited to 1.3380-85 and bring another rise later to aforesaid upside targets. Below previous resistance at 1.3329 (now support) would defer and suggest a temporary top is possibly formed, bring retracement of recent rise to 1.3290-00, then 1.3240-50 but said support at 1.3153 should remain intact, bring another upmove later.
Recommendation: Long entered at 1.3165 met target at 1.3365 with 200 points profit and would buy again at 1.3390 for 1.3590 with stop below 1.3290.
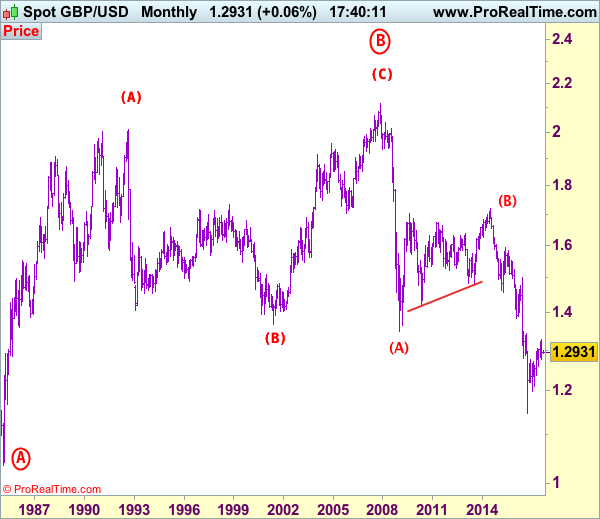
Longer term - Cable's rise from 1.0520 (Feb 1985) to 2.0100 (September 1992) is seen as [A], the decline to 1.3682 is labeled as (B) and (C) wave rally has ended at 2.1162 (9 Nov, 2007) which is also the top of larger degree wave B with circle. The selloff from there is a 5-waver with wave (A) ended at 1.3500 (23 Jan 2009), wave (B) itself is labeled as A: 1.6733, triangle wave B: 1.4813 and wave C as well as top of wave (B) ended at 1.7192 (2014), hence the selloff from there is an impulsive wave (C) with wave I : 1.4566, wave II 1.5930, an extended wave III is unfolding and already exceeded our downside target at 1.3500 and 1.3000, hence weakness to 1.2500 and possibly 1.2000 cannot be ruled out, however, price should stay well above psychological level at 1.0000.
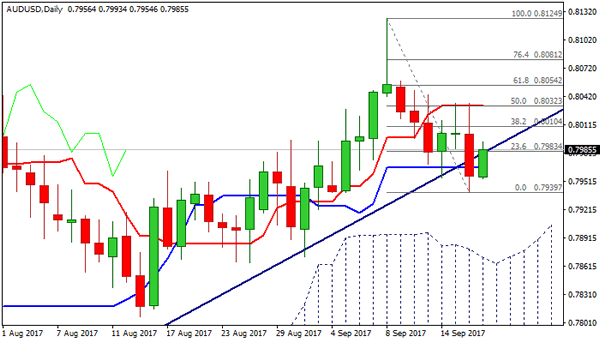
Technical Outlook: AUDUSD – Stronger Recovery Seen On Sustained Break Above 0.8000 Resistance Zone
The Aussie regained traction in early Europe and returned near Asian peak at 0.7993 after release of RBA's last meeting minutes.
The minutes of central banks last meeting showed that the RBA is encouraged by recent jobs data but wages are expected to stay low for some time. The minutes also pointed at stronger than expected economic growth in China but high debt weighing on the outlook.
Fresh recovery after strong fall on Monday probes above broken main bull-trendline (0.7988) and needs sustained break above 0.8000 zone (bull-trendline / psychological point / Fibo 38.2% of 0.8124/0.7939 downleg) to signal higher low formation at 0.7939 (Monday's low) and open way for further recovery.
Extension above next key barrier at 0.8032 (daily Tenkan-sen / Fri/Mon double upside rejection) is needed to confirm reversal.
Res: 0.8000, 0.8010, 0.8032, 0.8054
Sup: 0.7966, 0.7939, 0.7929, 0.7902