Sample Category Title
Trade Idea: EUR/JPY – Buy at 133.30
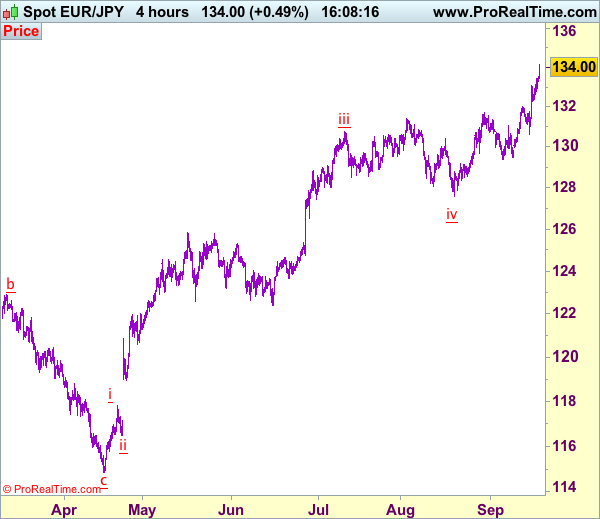
EUR/JPY - 134.08
Original strategy:
Buy at 132.00, Target: 134.00, Stop: 131.40
Position: -
Target: -
Stop: -
New strategy :
Buy at 133.30, Target: 135.00, Stop: 132.70
Position: -
Target: -
Stop:-
As the single currency has surged again after brief pullback, adding credence to our view that recent upmove is still in progress and bullishness remains for further gain to 134.50-60, then towards 135.00-10, however, near term overbought condition should limit upside and reckon 135.55-60 would hold from here, risk from there is seen for a retreat to take place later.
In view of this, we are looking to reinstate long on pullback as 133.20-30 should limit downside and bring another rise. Below 132.60-65 would defer and suggest a temporary top is possibly formed, risk test of 132.27 support but still reckon previous resistance at 132.01 (should turn into support) would remain intact, then euro shall head north again from there.
Our latest preferred count is that wave (ii) is ABC-X-ABC which ended at 123.33 and wave (iii) is unfolding with wave iii ended at 100.77, followed by wave iv at 111.57 and wave v as well as the wave (iii) has ended at 97.04, followed by wave (iv) at 111.43 and wave (v) has ended at 94.12 which is also the end of the larger degree v, this also implied the major wave (C) has also ended there, hence major correction has commenced from there with (A) leg unfolding in its lower degree wave c which has possibly ended at 145.69. Under this count, A-B-C wave (B) has commenced with A leg ended at 136.23, wave B at 143.79 and wave C has possibly ended at 149.79.
Our larger degree count is that the decline from 139.26 is wave (C) and is sub-divided into a diagonal triangle i-ii-iii-iv-v with wave i - 105.44, wave ii- 123.33, wave iii - 97.03, wave iv - 111.43, followed by the final wave v as well as the end of wave (C) at 94.12, this also mark the bottom of larger degree wave B. Under this count, major rise in wave C has commenced as an impulsive wave with minor wave III ended at 145.69, wave V is still in progress for further gain to 150.00. Having said that, this so-called wave V could well be the first leg of larger degree 5-waver wave C and this wave C should bring at least a retest of wave A top at 169.97 (July 2008).
Trade Idea: AUD/USD – Sell at 0.8080
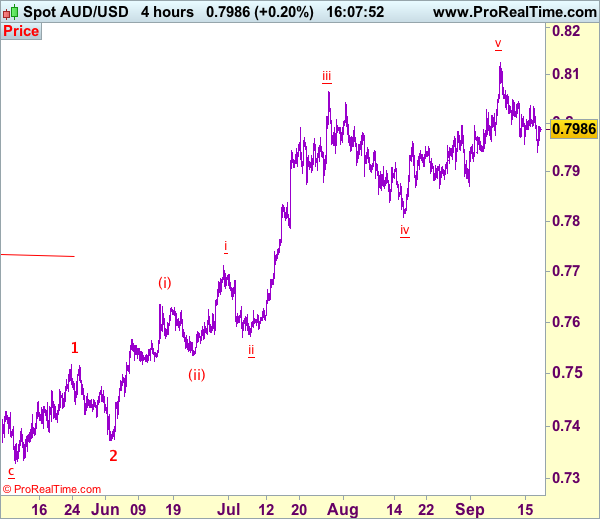
AUD/USD – 0.7985
Original strategy:
Sell at 0.8080, Target: 0.7900, Stop: 0.8140
Position: -
Target: -
Stop:-
New strategy :
Sell at 0.8080, Target: 0.7900, Stop: 0.8140
Position: -
Target: -
Stop:-
Although aussie fell briefly to 0.7940, the subsequent rebound suggests further consolidation would be seen and recovery to 0.8040-45 cannot be rule out, however, if our view that temporary top has been formed at 0.8125 is correct, upside would be limited to 0.8080-90 and bring another decline, below , below said support at 0.7940 would add credence to this view, bring retracement of recent rise to 0.7920-25 and later 0.7890-00 but support at 0.7867-71 should remain intact.
In view of this, we are looking to sell aussie on recovery as 0.8090-00 should limit upside. Above said resistance at 0.8125 would (this month’s high) would extend recent upmove in wave v of (iii) to 0.8150, then towards 0.8200, however, loss of upward momentum should prevent sharp move beyond 0.8225-30 and price should falter below 0.8250-60, risk from there is seen for a retreat later.
On the 4-hour chart, the move from 0.8066 is the wave 5 with i: 0.8860, ii: 0.8315, wave iii is an extended move ended at 1.0183, iv: 0.9706 and wave v has ended at 1.1081 (also the top of entire wave 5). The subsequent selloff is the major correction which is unfolding as ABC-X-ABC and 2nd A leg has ended at 0.8848, followed by a-b-c wave B which ended at 0.9758, hence, 2nd C wave is now in progress and indicated downside target at 0.7000 and 0.6950 had been met, so further fall to 0.6710-20 cannot be ruled out.
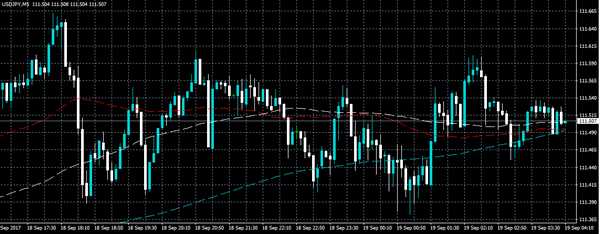
USDJPY Rejected At Monthly Pivot
The USDJPY is losing bullish momentum, despite continuing to trade at elevated levels around the 111.50 handle, as price-action continues to struggle to find traction above the pairs calculated monthly pivot point, located at 111.65.
Technically the USDJPY remains strongly bullish, after yesterday's tentative daily price close above the pairs 200-day moving average, located at the 111.48 level.
Traders should look to the bullish inverse head and shoulders pattern which is currently in-play, after the recent break above the 110.68 level.
Traders should also note the confluence of higher-time frame moving averages, which extend from the 111.13 level to the current weekly price-high.
Key intraday resistance above the 111.65 level is currently found at 111.86, 112.19 and 112.88.
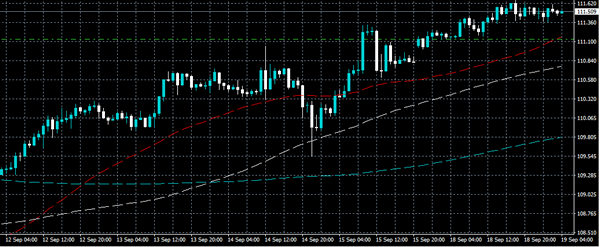
To the downside, higher time-frame USDJPY technical support is layered between 111.48, 111.28 and 111.13.
Below the 111.13 level, further support is found at 110.86 and 110.68, with the weekly pivot point, found at 110.10.
Sterling Lower On Hawkish Carney Speech
The British pound fell below the 1.3500 level during the late European trading session, hitting 1.3464, after Bank of England Governor Mark Carney delivered a hawkish speech on UK interest rate increases.
Speaking at the United Nations headquarters in Washington DC, Carney said 'any rate increases are expected to be gradual and limited'. Price-action in the GBPUSD pair has now recovered above the 1.3500 handle, after yesterday's steep drop from 1.3618.
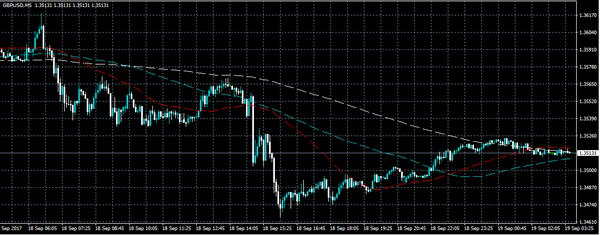
Going forward, sterling risks further losses below the 1.3500 handle, as the pairs lower-time frame bearish MACD divergence extends all the way down to the 1.3390 level.
Key intraday technical support is found at 1.3502, 1.3464 and 1.3435. The pairs critical 100-week moving average now sits at the 1.3419 level.
GBPUSD intraday resistance is seen at 1.3524, with the 50-hour moving average and daily pivot point above, at 1.3532-33.
Above the daily pivot point, further resistance is seen at the weekly pivot point, at 1.3553 and the recent swing price-high, at 1.3569.
Global Markets Focus On Economic Data, FED
Tuesday sees an active release schedule on the economic calendar, with reports coming from both sides of the Atlantic. Monetary policy will also be top of mind for investors as the Federal Reserve begins its two-day policy meeting in Washington.
The first item on the economic calendar is the Eurozone current account balance, which is scheduled for release at 08:00 GMT. In seasonally adjusted terms, the account surplus is forecast to widen to €22.3 billion in July from €21.2 billion the previous month.
One hour later, the European Centre for Economic and Social Research (ZEW) will release a pair of closely-watched sentiment indicators. Germany’s economic sentiment index is believed to have risen this month, according to a median estimate of economists. The current situation index is also forecast to rise slightly.
ZEW will also release a euro-wide sentiment index at 09:00 GMT. The indicator is expected to show a sizable increase in economic optimism for the 19-member Eurozone.
Earlier in the day, the Reserve Bank of Australia (RBA) released the minutes of its most recent policy meeting, where it voted to leave interest rates unchanged. The Australian dollar was little changed after the transcript was released.
In North America, the US Commerce Department will release its latest report on housing starts and building permits. Starts are forecast to rise 1.7% in August, while permits are expected to edge down 0.8%.
The Federal Open Market Committee (FOMC) will begin its two-day policy meeting on Tuesday, with an official interest rate statement scheduled for the following afternoon. The Fed is not expected to raise rates on Wednesday but could outline its plan to begin unwinding its $4.5 trillion balance sheet.
AUD/USD
The Australian dollar traded within a narrow range on Tuesday, as investors parsed through the RBA meeting minutes. Unable to reclaim the 0.8000 level, the AUD/USD is facing renewed bearish pressure. Prices closed below the 20-day simple moving average of 0.7971, setting the stage for a possible decline back toward the 50-day SMA near 0.7920.

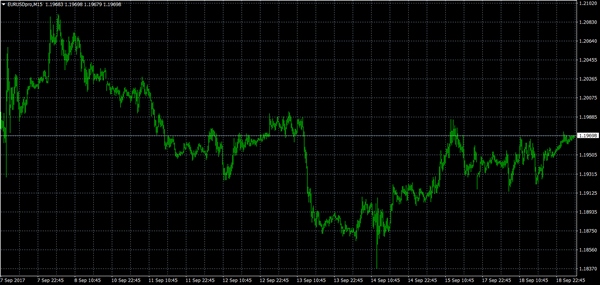
EUR/USD
The euro edged higher in Asian trading on Tuesday, as the dollar eroded some of its recent gains. The AUD/USD climbed 0.2% to 1.1970. The pair faces an immediate test at 1.1975, with a clean break supporting a bigger rally back toward the all-important 1.2000 level. Above this region, the next resistance is seen at 1.2030.
GOLD
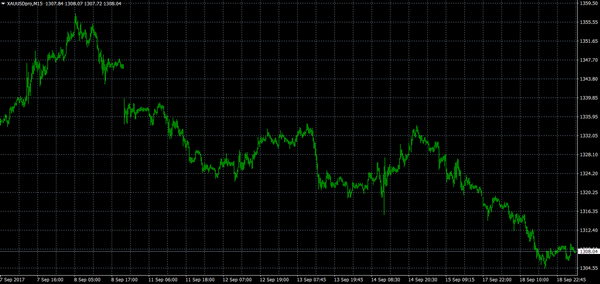
Gold prices declined sharply at the start of the week, as risk sentiment returned to the financial markets in a big way. Bullion settled near three-week lows on the Comex division of the New York Mercantile Exchange. Prices remain supported near the psychological $1,300.00 level. The spot contract was virtually unchanged during the Asian session at $1,308.00 a troy ounce.
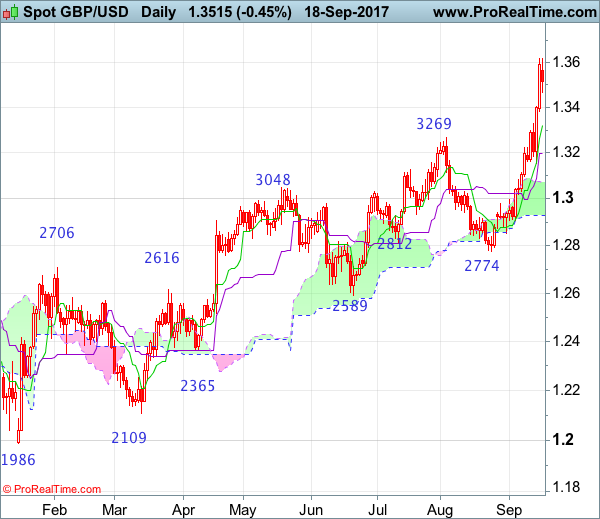
GBP/USD Candlesticks and Ichimoku Analysis
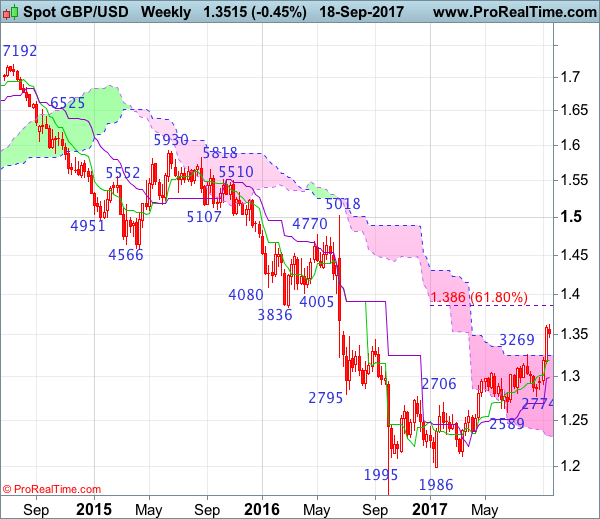
Weekly
• Last Candlesticks pattern: Shooting star
• Time of formation: 31 Jul 2017
• Trend bias: Down
Daily
• Last Candlesticks pattern: Morning star
• Time of formation: 25 Aug 2017
• Trend bias: Near term up
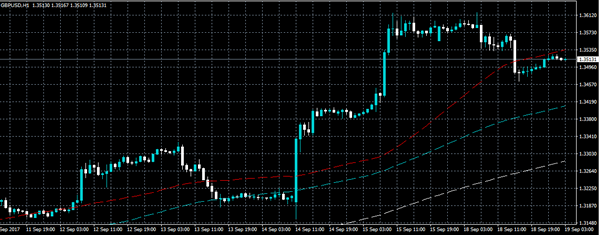
GBP/USD – 1.3520
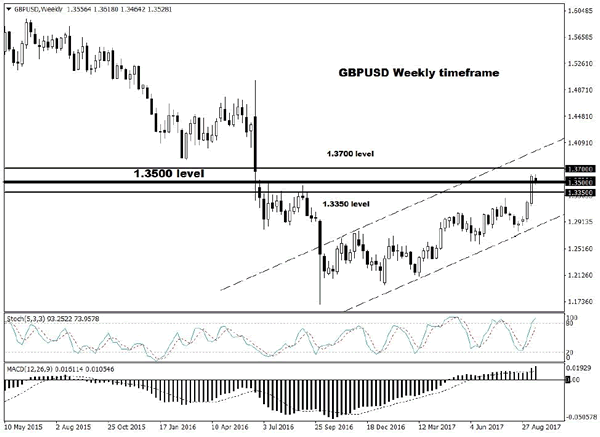
Cable only eased to 1.3153 last week before surging again, price rallied to as high as 1.3619 yesterday before easing, suggesting minor consolidation would take place and initial pullback to 1.3450-60 cannot be ruled out, however, reckon 1.3380-85 would contain downside and bring another rise later, above 1.3619 would extend medium term erratic upmove from 1.1986 low to 1.3650-55 (100% projection of 1.1986-1.3048 measuring from 1.2589), then 1.3700, however, near term overbought condition should limit upside to 1.3800 and reckon 1.3860 (61.8% Fibonacci retracement of 1.5018-1.1986) would remain intact, bring retreat later.
On the downside, whilst initial pullback to 1.3470-80, then 1.3450 cannot be ruled out, renewed buying interest should emerge around 1.3400 and bring another rise. A daily close below support at 1.3382 would bring test of the Tenkan-Sen (now at 1.3319) but break there is needed to suggest a temporary top is possibly formed, bring retracement of recent rise to 1.3240-50, then1.3200, having said that, reckon said support at 1.3153 (last week’s low) would remain intact, bring another rally later.
Recommendation: Buy again at 1.3400 for 1.3600 with stop below 1.3300.
On the weekly chart, last week’s rally formed another long white candlestick (even longer than the previous one), adding credence to our bullish view that recent erratic upmove from 1.1986 low is still in progress and may extend further gain to 1.3650-55 (100% projection of 1.1986-1.3048 measuring from 1.2589), break there would bring subsequent rise to 1.3750-60 but near term overbought condition should prevent sharp move beyond 1.3860 (61.8% Fibonacci retracement of 1.5018-1.1986) and bring retreat later.
On the downside, although initial pullback to 1.3445-50, then 1.3400 cannot be ruled out, reckon downside would be limited to 1.3380-85 and bring another rise later. Below 1.3300 would defer and risk test of the upper Kumo (now at 1.3247) but still reckon last week’s low at 1.3153 would hold and sterling may head north again from there. Only a drop below this support would defer and suggest a temporary top is formed, bring correction of recent rise to 1.3090-00 and possibly towards psychological support at 1.3000 but the Kijun-Sen (now at 1.2992) should limit downside.
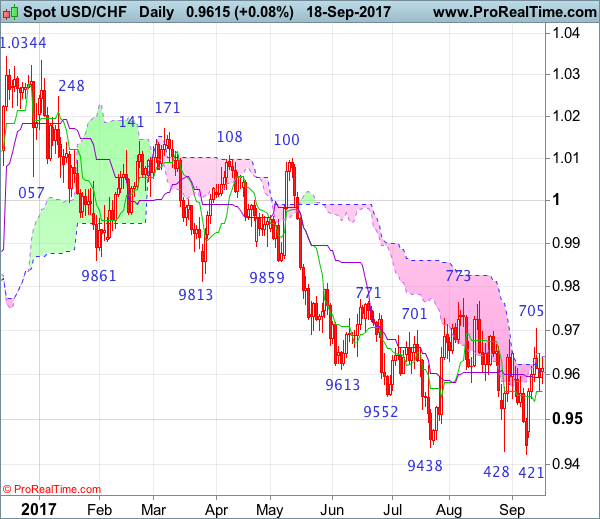
USD/CHF Candlesticks and Ichimoku Analysis
Weekly
• Last Candlesticks pattern: Shooting star
• Time of formation: 7 Mar 2017
• Trend bias: Sideways
Daily
• Last Candlesticks pattern: Morning star
• Time of formation: 9 May 2017
• Trend bias: Near term up
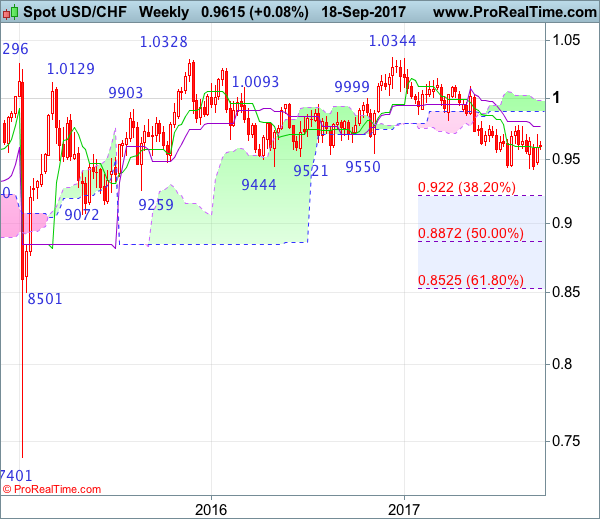
USD/CHF – 0.9548
Although the greenback staged a strong rebound after marginal fall to 0.9421 earlier this month, as dollar met resistance at 0.9705 last week and has retreated, suggesting as long as this level holds, mild downside bias remains for another retreat, below 0.9545-50 would bring weakness to 0.9500 but break of 0.9455-60 is needed to retain bearishness and signal the rebound from 0.9421 has ended, bring retest of this level, break there would confirm recent decline from 1.0344 (2016 top) has resumed and extend weakness to 0.9390-00, then towards 0.9330-35, having said that, downside should be limited to previous support at 0.9259 and reckon 0.9220 (38.2% Fibonacci retracement of entire rise from 0.7401-1.0344) would hold.
On the upside, expect recovery to be limited to 0.9650 and bring another retreat. A break of said last week’s high at 0.9705 would risk a strong rebound to 0.9740-50 but only break of resistance at 0.9773 would signal the aforesaid decline from 1.0344 has ended, bring further subsequent gain to 0.9845-50 (61.8% Fibonacci retracement of 1.0108-0.9421), however, reckon upside would be limited to 0.9900-10 and price should falter well below psychological resistance at 1.0000.
Recommendation: Hold short entered at 0.9640 for 0.9400 with stop above 0.9705.
On the weekly chart, despite last week’s rebound to 0.9705 (a white candlestick was formed), as dollar met renewed selling interest there and has retreated, consolidation with downside bias is seen for weakness to 0.9550, then 0.9500 but break of 0.9455-60 is needed to signal rebound from 0.9421 has ended, bring retest of this level, break there would extend recent decline from 1.0344 top to 0.9350, then towards previous support at 0.9259, however, oversold condition should prevent sharp fall below 0.9220 (38.2% Fibonacci retracement of 0.7401-1.0344) and reckon 0.9150 would hold from here, risk from there is seen for a rebound later.
On the upside, as long as said resistance at 0.9705 holds, prospect of another decline remains. Above said resistance at 0.9705 would suggest a temporary low has been formed at 0.9421 and bring test of previous resistance at 0.9773 but a weekly close above this level is needed to add credence to this view, bring retracement of recent decline to 0.9845-50 (61.8% Fibonacci retracement of 1.0108-0.9421), then test of the lower Kumo (now at 0.9894) but upside should be limited to the upper Kumo (now at 0.9982), price should falter well below resistance at 1.0100-08.
Risk-On Sentiment Elevates Global Stocks
'Risk-on' was the name of the game during Monday's trading session, with world stocks marching into unchartered territory as tensions eased on the Korean peninsula.
Most Asian indexes received further support from easing geopolitical tensions during early trading on Tuesday, and European equities are likely to benefit from renewed risk appetite. Wall Street stole the spotlight on Monday, as both the S&P 500 Index and Dow Jones Industrial Average sprinted to record levels ahead of the Federal Reserve meeting that is due later today. The combination of resilient oil prices, rising optimism over the global economy and receding geopolitical tensions are likely to excite equity bulls - consequently fueling the stock market rally.
BoE's Carney strikes again
Market players instinctively offloaded the British Pound on Monday, following the Bank of England Governor Mark Carney's comment that any future interest rate hike would be limited and gradual.
Carney's statement that a rate increase could be 'at a gradual pace and to a limited extent' felt like a diluted version of the central bank's hawkish message last week, with a touch of caution added. Although Sterling managed to rebound from the 1.3500 level this morning, the skepticism over the Bank of England actually raising UK interest rates this year could create some headwinds for bulls further down the road. As actions speak louder than words, there is a threat that Sterling will find itself exposed to downside shocks, if the BoE fails to raise rates this year.
Investors will be watching to see if the central bank raises interest rates in an effort to tame inflation, or whether it will be forced to remain on standby amid the Brexit uncertainty.
From a technical standpoint, the GBPUSD remains healthily bullish on the daily charts. The weekly close above 1.3500 should encourage a further appreciation towards 1.3700. In an alternative scenario, sustained weakness below 1.3500, is likely to trigger a technical correction lower towards 1.3350.
Dollar wobbles ahead of FOMC meeting
The Dollar struggled to maintain gains against a basket of major currencies on Tuesday morning, as market players positioned for September's FOMC meeting, which could offer clues on future monetary policy.
While the central bank is widely expected to keep interest rates unchanged, investors will be paying very close attention to any details on when the Fed plans to shrink its mammoth $4.5 trillion balance sheet. With investors still re-evaluating the Federal Reserve's ability to raise US interest rates in December, attention will be directed towards Janet Yellen and her thoughts on the recent inflation trends in the U.S. A hawkish Yellen, who leaves the door open for another rate hike before year-end, is likely to offer the Dollar a lifeline.
The Dollar Index remains bearish on the daily charts. Repeated weakness below 91.50 should encourage a further depreciation towards 91.00.
Commodity spotlight – Gold
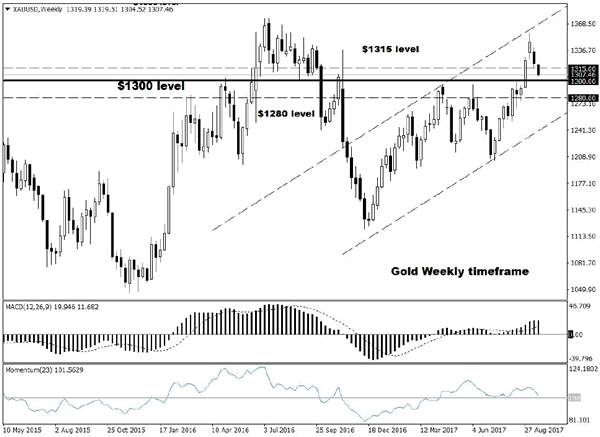
Gold was under intense selling pressure on Monday, as the risk-on mood encouraged investors to offload safe-haven assets. Stabilizing oil prices and easing North Korean tensions have both played a leading role in Gold's sharp decline, which was trading around $1308 as of writing. This tug of war between bulls and bears seems to be coming to an end, with a break below $1300 simply handing control over to sellers.
From a technical standpoint, a breakdown below the tough $1300 support should encourage a further decline towards $1280. In an alternative scenario, if $1300 defends, then the price could bounce back towards $1315.
Elliott Wave View: NZDUSD More Upside
NZDUSD Short Term Elliott Wave view suggests that the Index shows a 5 swing sequence from 8/31 low favoring further upside. Rally from 8/31 low (0.7128) is unfolding as a double three Elliott Wave structure. Up from 0.7128, Minute wave ((w)) ended at 0.7338 and Minute wave ((x)) ended at 91.71. Wave ((y)) is currently in progress and the subdivision is also unfolding as a double three Elliott wave structure. Minutte wave (w) of ((y)) ended at 0.7344 and Minutte wave (x) of ((y)) ended at 0.7246. Near term, while pullbacks stay above 0.718, expect pair to extend higher. We don't like selling the pair.
NZDUSD 1 Hour Elliott Wave Chart
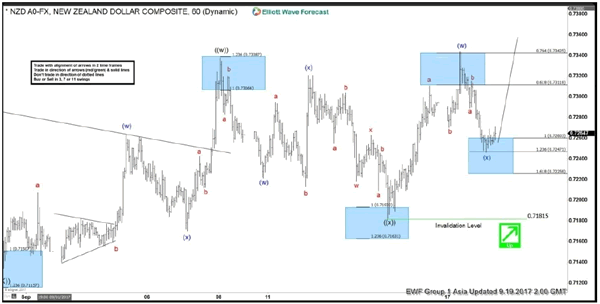
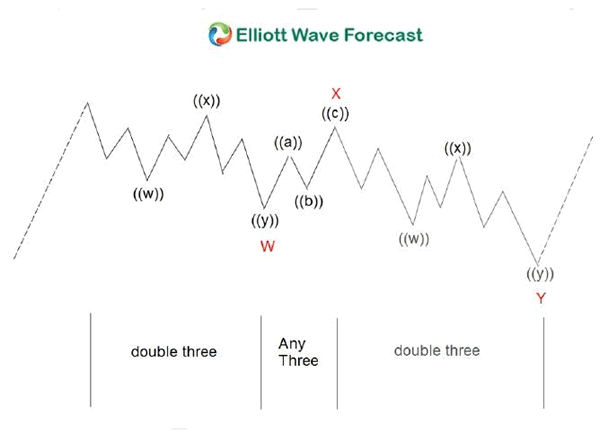
Double three ( 7 swings) is the most important pattern in Elliott wave's new theory. It is also probably the most common pattern in the market these days. Double three is also known as a 7-swing structure. It is a very reliable pattern that gives traders a good opportunity to trade with a well-defined level of risk and target areas. The image below shows what Elliott Wave Double Three looks like. It has labels (W), (X), (Y) and an internal structure of 3-3-3. This means that all 3 legs has corrective sequences. Each (W) and (Y) is formed by 3 wave oscillations and has a structure of A, B, C or W, X, Y of smaller degrees.
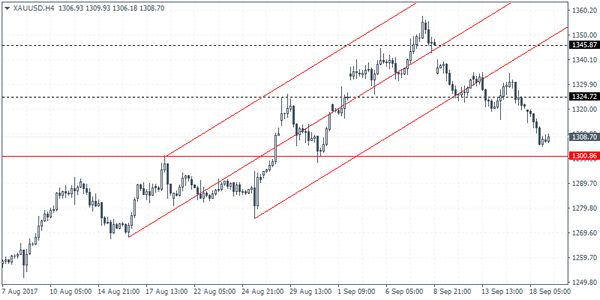
XAUUSD Intraday Analysis
XAUUSD (1308.70): Gold prices have posted a steady decline with price action gapping lower below 1324.72. We expect the downside momentum to see further declines that could send gold prices down to test the support at 1300.86. However, there is scope for a modest reversal off the current levels. Resistance at 1324.72 will be in play as gold prices aim to fill this minor gap from earlier this week. A reversal around 1324.72 will signal the completion towards the 1300.86 support. To the upside above 1324.72, signals a bullish bias in gold that could see price aiming for the 1345.87 resistance level.