Sample Category Title
BoC Tracking Impact Of Rate Hikes And A Stronger Currency On The Economy: BoC’s Timothy Lane
.
For the 24 hours to 23:00 GMT, the USD rose 0.82% against the CAD and closed at 1.2279.
The Canadian Dollar declined against the USD, after one of the Bank of Canada's (BoC) policymaker suggest “a cautious approach to additional rate hikes”.
The BoC Deputy Governor, Timothy Lane, stated that the central bank, which has raised rates twice in three months, will closely monitor the currency's impact on the economy and how the economy responds to higher interest rates to decide on future path of monetary policy.
In the Asian session, at GMT0300, the pair is trading at 1.2304, with the USD trading 0.2% higher against the CAD from yesterday's close.
The pair is expected to find support at 1.2205, and a fall through could take it to the next support level of 1.2105. The pair is expected to find its first resistance at 1.2371, and a rise through could take it to the next resistance level of 1.2437.
Amid no major macroeconomic releases in Canada today, investors will look forward to global macroeconomic events for further direction.
The currency pair is trading above its 20 Hr and 50 Hr moving averages.

EUR/GBP Daily Outlook
Daily Pivots: (S1) 0.8801; (P) 0.8832; (R1) 0.8885; More
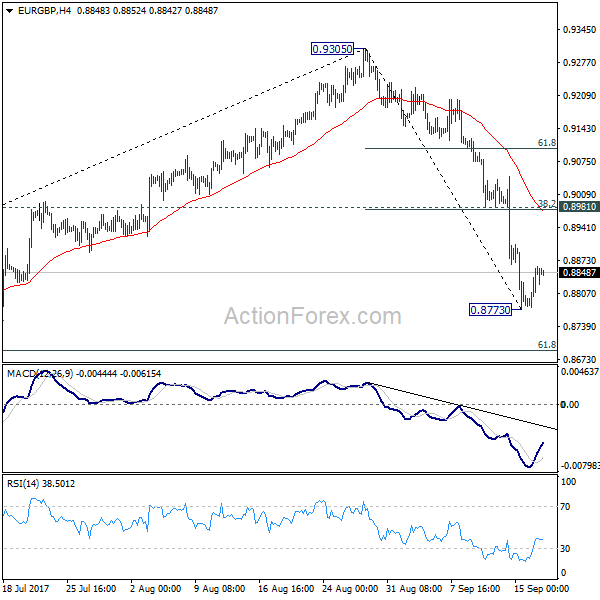
A temporary low is formed at 0.8773 in EUR/GBP and intraday bias is turned neutral first. Near term outlook stays bearish as long as 0.8981 cluster resistance holds (38.2% retracement of 0.9305 to 0.8773 at 0.8976). Fall from 0.9305 is seen as the third leg of consolidation pattern from 0.9304. Below 0.8773 will target 61.8% retracement of 0.8312 to 0.9305 at 0.8691 and below. We'll look for bottoming signal again at it approaches 0.8303 support.
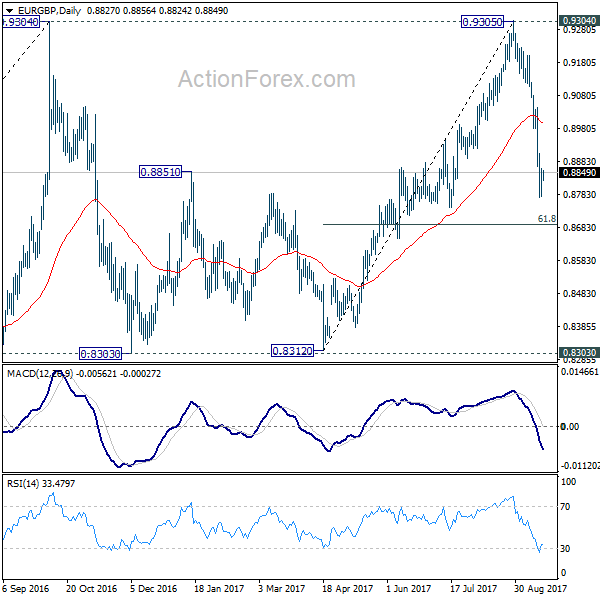
In the bigger picture, price actions from 0.9304 are viewed as a medium term corrective pattern. It's still in progress with fall from 0.9305 as the third leg. Break of 0.8303 could be seen. But we'd expect strong support from 0.8116 cluster support (50% retracement of 0.6935 to 0.9304 at 0.8120) to contain downside. Whole up trend from 0.6935 is expected to resume after consolidation from 0.9304 completes.
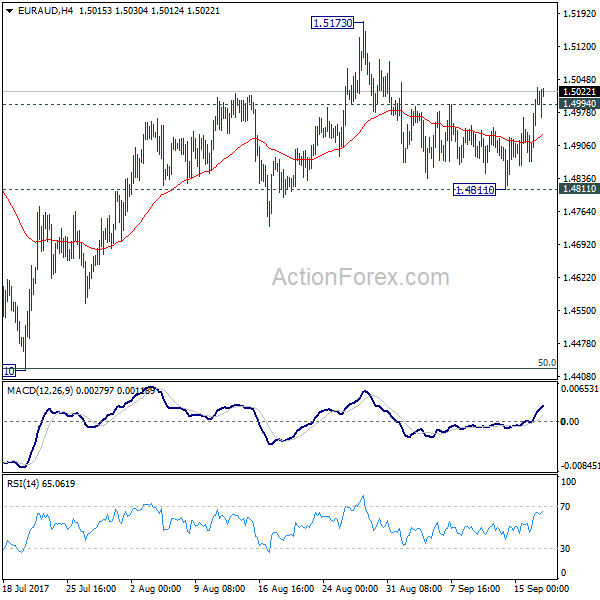
EUR/AUD Daily Outlook
Daily Pivots: (S1) 1.4913; (P) 1.4972; (R1) 1.5074; More....
EUR/AUD's rebound and break of 1.4944 minor resistance suggests that pull back from 1.5173 is completed. and rise from 1.4421 could be resuming after drawing support from 55 day EMA. Intraday bias is back on the upside for 1.5173/5226 resistance zone first. Break will resume medium term rally from 1.3624. On the downside, below 1.4811 will turn bias to the downside and extend the fall from 1.5173 to retest 1.4421 support.
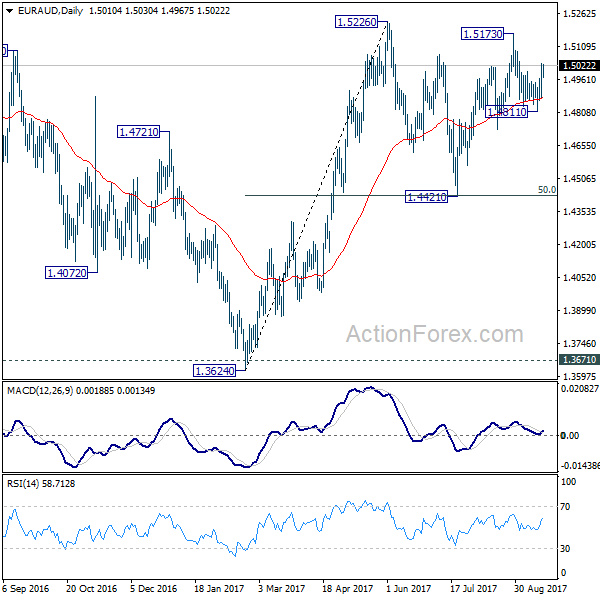
In the bigger picture, we're holding on to the view that corrective decline from 1.6587 medium term has completed at 1.3624. Rise from 1.3624 is expected to extend to retest 1.6587. The corrective structure of the price actions from 1.5226 is affirming this view. Above 1.5226 will target a test on 1.6587 key resistance. However, break of 1.4421 support will dampen our view and would drag EUR/AUD lower to retest key support zone around 1.3624.
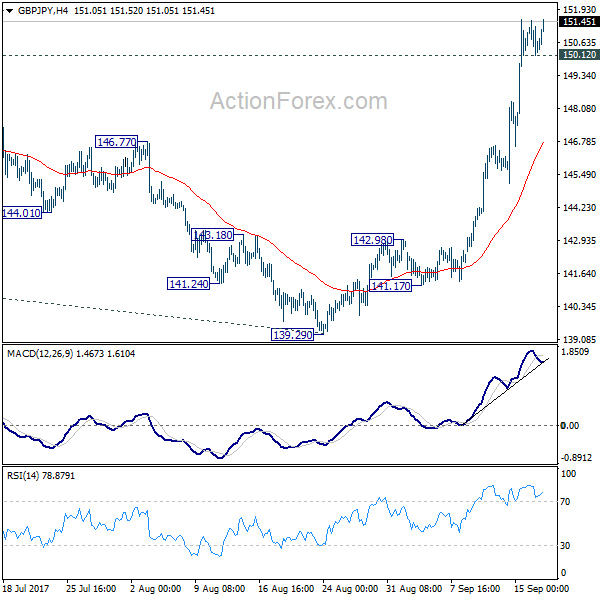
GBP/JPY Daily Outlook
Daily Pivots: (S1) 149.98; (P) 150.74; (R1) 151.35; More
With 150.12 minor support intact, intraday bias in GBP/JPY remains on the upside. Current medium term rise from 122.36 should target 61.8% projection of 122.36 to 148.42 from 139.29 at 155.39 next. On the downside, below 150.12 minor support will turn intraday bias neutral and bring consolidation before staging another rally.
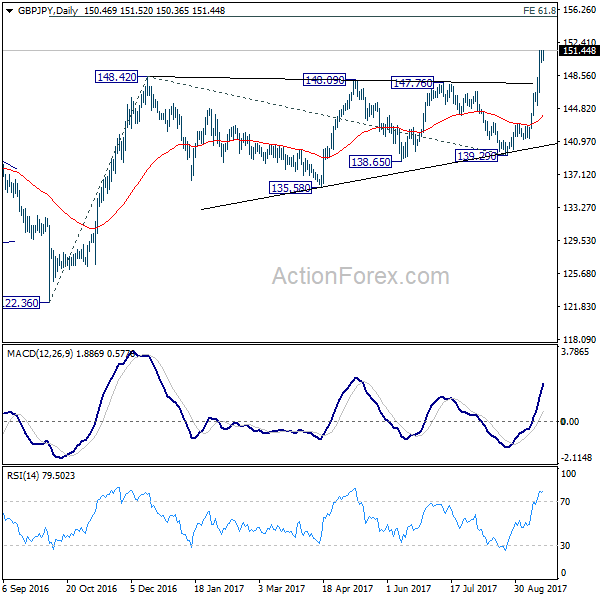
In the bigger picture, the consolidation from 148.42 should have completed and medium term rebound from 122.36 is resuming. Firm break of 38.2% retracement of 196.85 to 122.36 at 150.43 will carry long term bullish implications. In that case, GBP/JPY could target 61.8% retracement at 167.78. For now, the bullish scenario is preferred as long as 139.29 support holds.
EUR/JPY Daily Outlook
Daily Pivots: (S1) 132.68; (P) 133.05; (R1) 133.73; More...
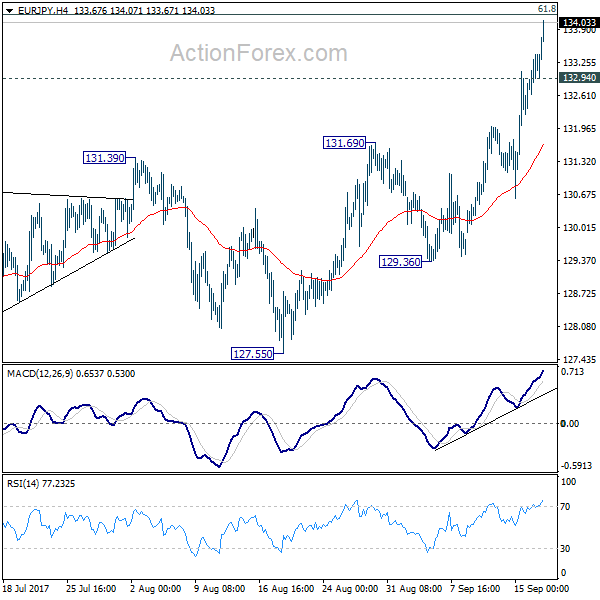
EUR/JPY's rally continues today and reaches as high as 134.07 so far. Intraday bias remains on the upside for 134.20 fibonacci level next. Firm break there will pave the way to 141.04 resistance next. On the downside, below 132.94 minor support will turn intraday bias neutral and bring consolidations. But firm break of 131.39 resistance turned support is needed to be the first sign of near term reversal. Otherwise, outlook will remain bullish in case of retreat.
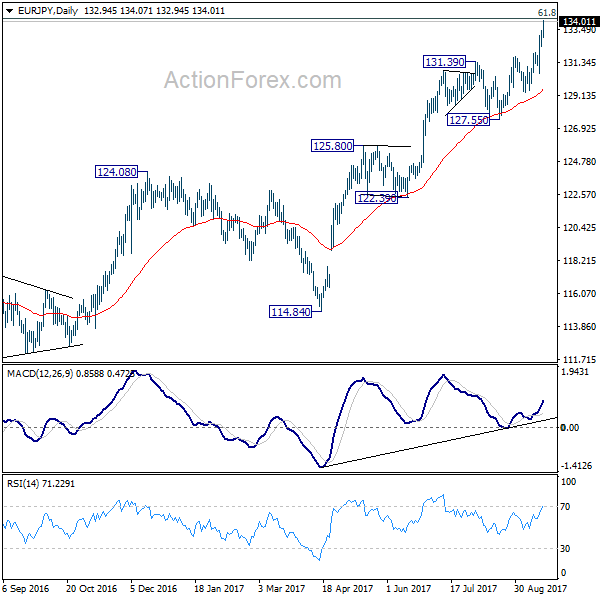
In the bigger picture, current rise from 109.03 is seen as at the same degree as the down trend from 149.76 (2014 high) to 109.03 (2016 low). as long as 124.08 resistance turned support holds, further rise is expected to 61.8% retracement of 149.76 to 109.03 at 134.20. Sustained break there will pave the way to key long term resistance zone at 141.04/149.76. On the downside, break of 127.55 support is needed to be the first signal of medium term reversal. Otherwise, outlook will remain bullish.
EUR/CHF Daily Outlook
Daily Pivots: (S1) 1.1463; (P) 1.1481; (R1) 1.1516; More... .
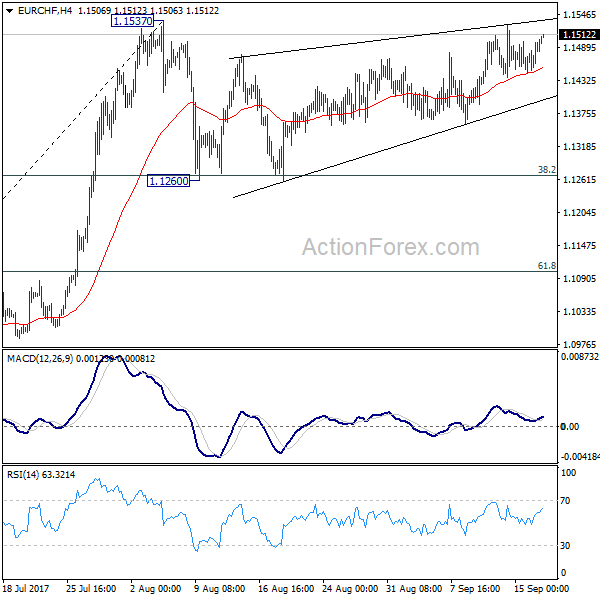
Intraday bias in EUR/CHF remains neutral and consolidation from 1.1537 could extend. Another fall might be seen. But in that case, downside should be contained by 38.2% retracement of 1.0830 to 1.1537 at 1.1267 to bring rebound. On the upside, break of 1.1537 resistance will confirm resumption of larger rally from 1.0629. In that case, EUR/CHF should target 1.2 key resistance level next.
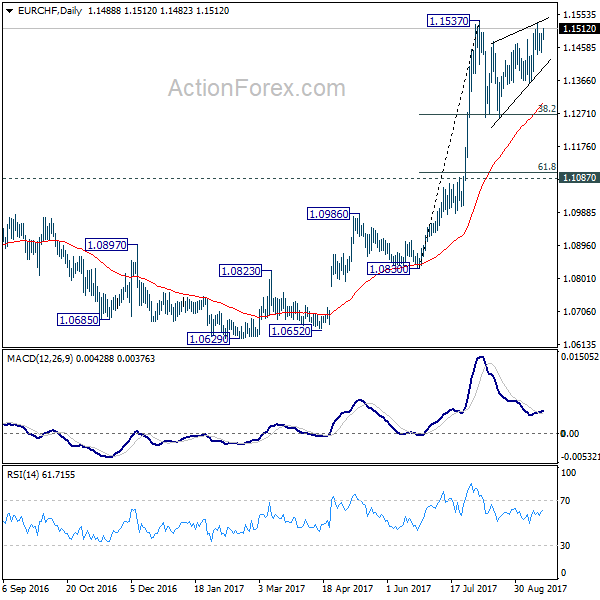
In the bigger picture, long term rise from SNB spike low back in 2015 is still in progress. EUR/CHF should now be heading back to prior SNB imposed floor at 1.2000. For now, this will be the favored case as long as 1.1087 resistance turned support holds.
AUD/USD Daily Outlook
Daily Pivots: (S1) 0.7920; (P) 0.7978; (R1) 0.8016; More...
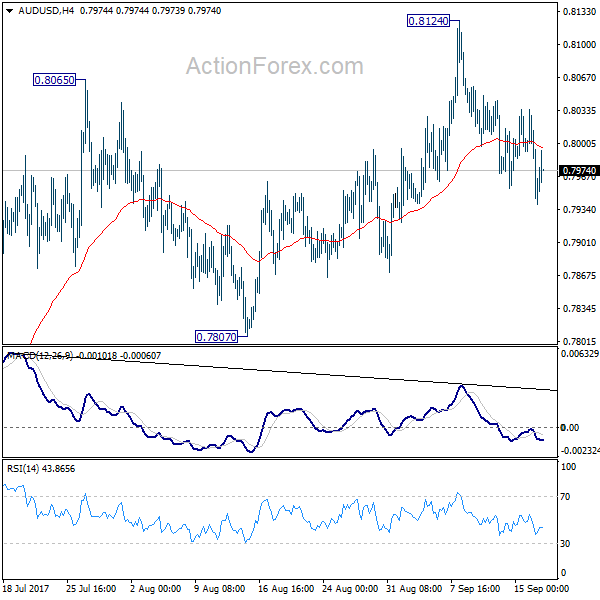
AUD/USD is still bounded in consolidation from 0.8124 and intraday bias stays neutral. Deeper fall could be seen. But still, with 0.7807 support intact, near term outlook stays bearish and another rise is expected. Break of 0.8124 will turn bias to the upside and target 100% projection of 0.6826 to 0.7833 from 0.7328 at 0.8335 next. However, considering bearish divergence condition in 4 hour MACD, firm break of 0.7807 will indicate near term reversal and turn bias back to the downside for 0.7328 key support.
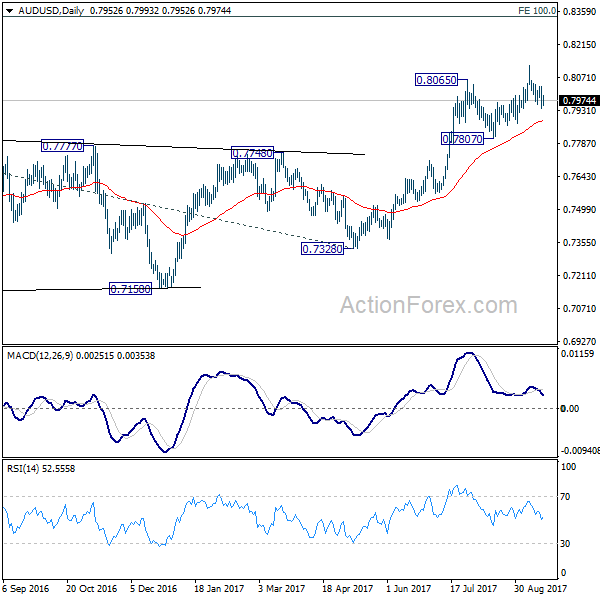
In the bigger picture, rise from 0.6826 medium term bottom is still in progress. At this point, there is no confirmation of trend reversal yet and we'll continue to treat such rebound as a corrective pattern. But in any case, break of 55 month EMA (now at 0.8090) will target 38.2% retracement of 1.1079 to 0.6826 at 0.8451. Break of 0.7807 support is needed to to be the first sign of completion of the rebound. Otherwise, further rise is now in favor.
USD/CAD Daily Outlook
Daily Pivots: (S1) 1.2195; (P) 1.2266; (R1) 1.2361; More....
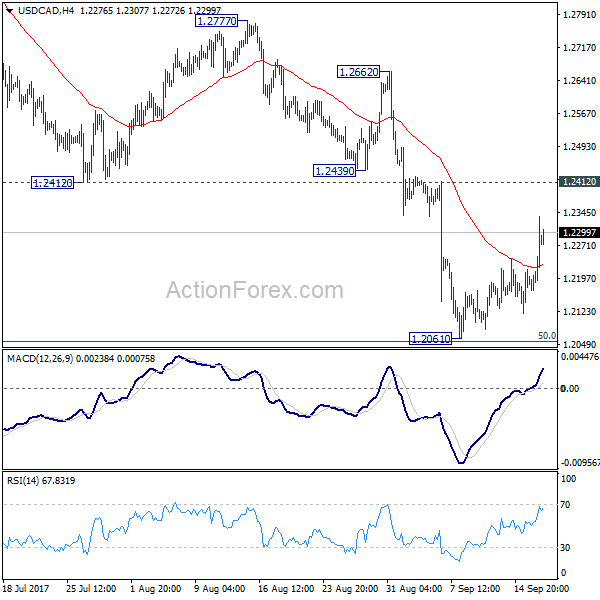
USD/CAD's rebound from 1.2061 extended higher but it's still limited below 1.2412 support turned resistance. Intraday bias remains neutral first. As noted before, we'd remain we'd remain cautious on strong support from 1.2049 key fibonacci level to bring sustainable rebound. But still, break of 1.2514 support turned resistance is needed to be the first sign of trend reversal. Otherwise, outlook will remain bearish. Firm break of 1.2049 key fibonacci level will pave the way to next fibonacci level at 1.1424.
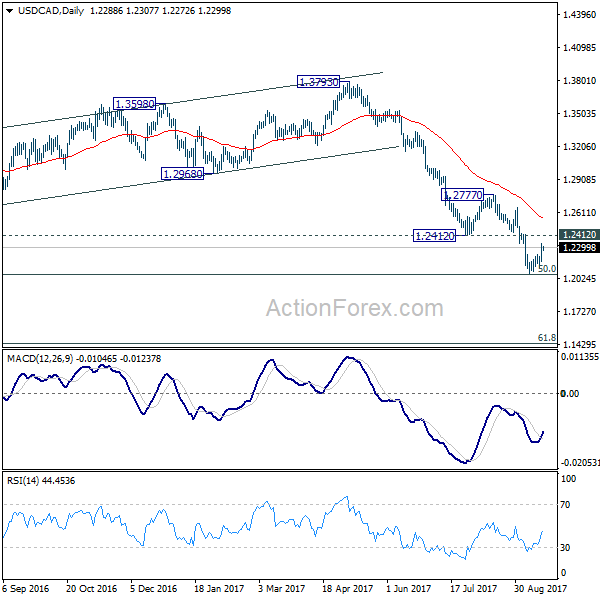
In the bigger picture, current downside acceleration is raising the chance that whole long term rise from 0.9406 (2011 low), and that from 0.9056 (2007 low) is completed at 1.4689. Focus is now on 50% retracement of 0.9406 to 1.4869 at 1.2048. As long as this level holds, we'd still favor that case that fall from 1.4689 is a correction. However, firm break of 1.2048 will indicate that fall fro 1.4689 is at least a medium term down trend and should target 61.8% retracement at 1.1424 and below.
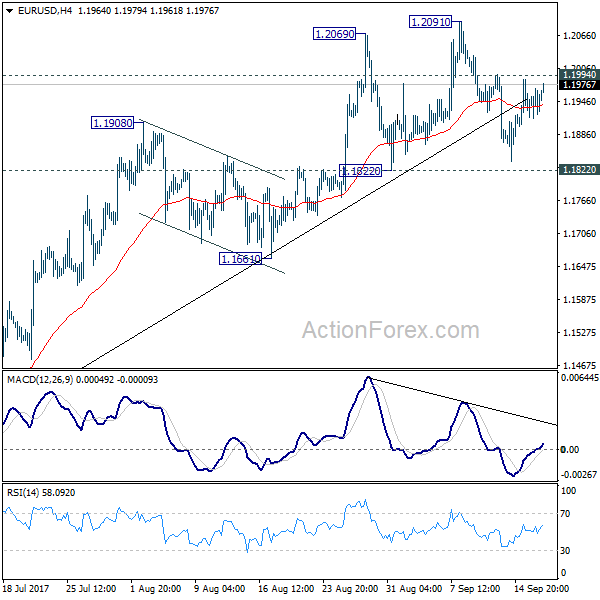
EUR/USD Daily Outlook
Daily Pivots: (S1) 1.1922; (P) 1.1945 (R1) 1.1977; More...
EUR/USD is staying in range of 1.1822/1994. Intraday bias remains neutral first. With 1.1822 support intact, near term outlook stays bullish for another rise. Above 1.1994 minor resistance will turn bias to the upside for 1.2091 first. Break there will extend larger rise from 1.0339 and target next key fibonacci level at 1.2516. But considering bearish divergence condition in 4 hour MACD, break of 1.1822 will confirm short term topping and bring deeper fall back to 1.1661 support and below.
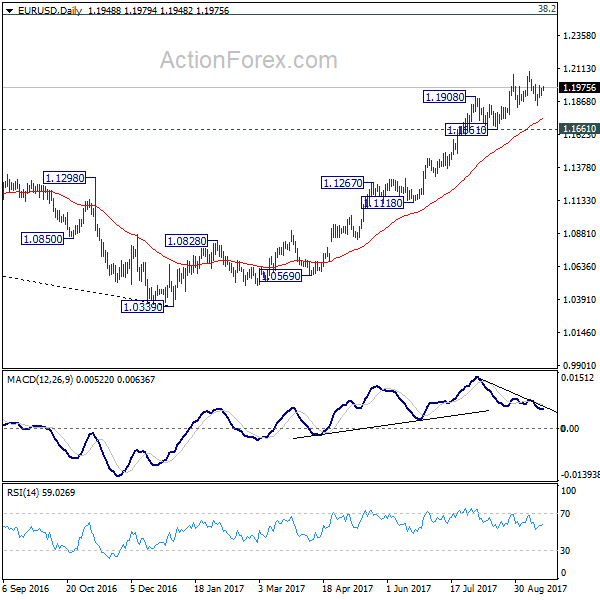
In the bigger picture, rise from medium term bottom at 1.0339 is still in progress for 38.2% retracement of 1.6039 (2008 high) to 1.0339 (2017 low) at 1.2516. However, it should be noted that there is no confirmation of trend reversal yet. That is, such rebound from 1.0399 could be a correction. And the long term fall fro 1.6039 (2008 high) could resume. Hence, we'd be cautious on strong resistance from 1.2516 to limit upside. But after all, break of 1.1661 is needed to indicate medium term topping. Otherwise, outlook will remain bullish in case of pull back.
USD/CHF Daily Outlook
Daily Pivots: (S1) 0.9585; (P) 0.9612; (R1) 0.9645; More....
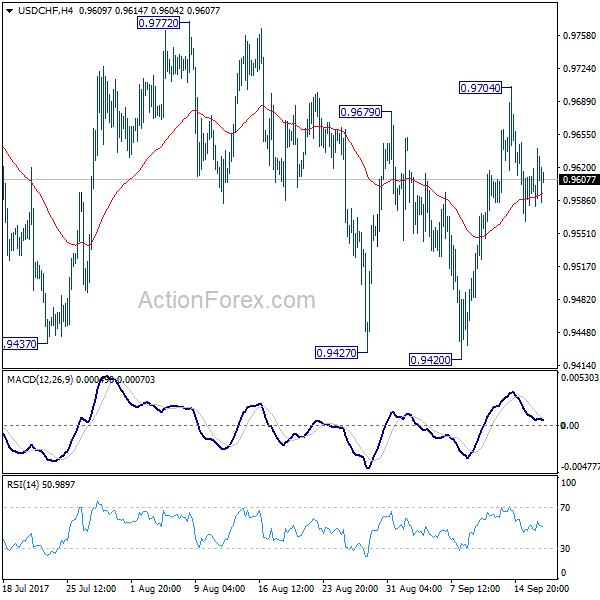
At this point, deeper fall is mildly in favor in USD/CHF for 0.9420 support. Also, with 0.9772 resistance intact, outlook remains bearish. Break of 0.9420 will resume medium term fall from 1.0342 and target next long term fibonacci level at 0.9090. However, firm break of 0.9772 will indicate trend reversal and turn outlook bullish.
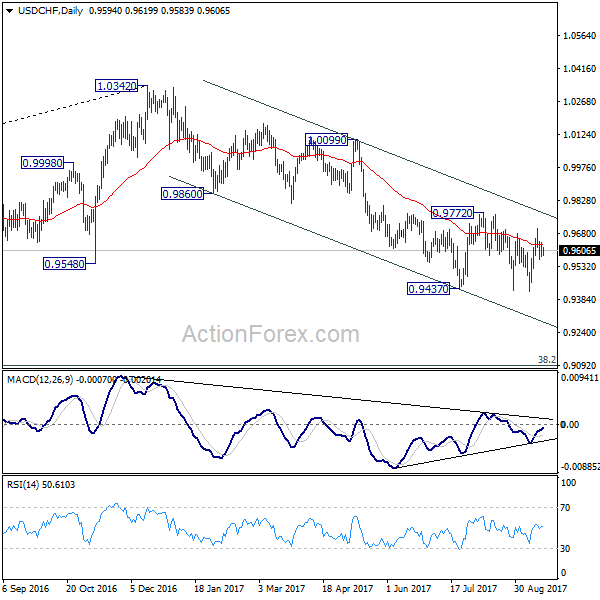
In the bigger picture, current development suggests that 0.9443 key support (2016 low) could be taken out firmly as down trend form 1.0342 extends. There are various interpretation of the price actions. But in any case, medium term outlook will stay bearish as long as 0.9772 resistance holds. Current down trend could extend to 38.2% retracement of 0.7065 (2011 low) to 1.0342 (2016 high) at 0.9090. However, break of 0.9772 will indicate that USD/CHF has successfully defended 0.9443 again and turn outlook bullish for 1.0099 resistance.