
Sample Category Title
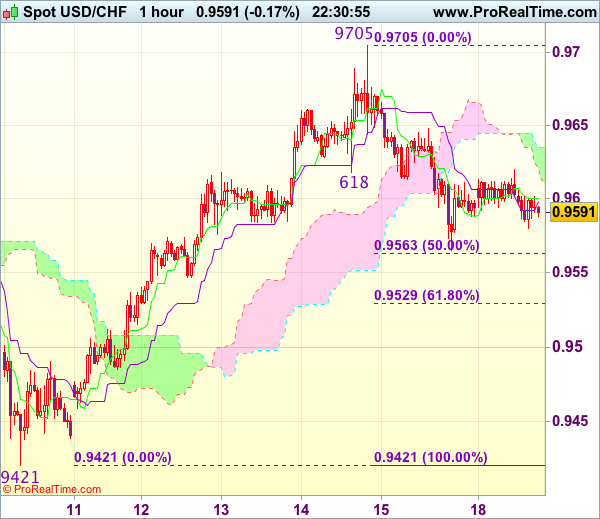
Trade Idea Wrap-up: USD/CHF – Sell at 0.9645
USD/CHF - 0.9600
Most recent candlesticks pattern : N/A
Trend : Near term up
Tenkan-Sen level : 0.9600
Kijun-Sen level : 0.9600
Ichimoku cloud top : 0.9635
Ichimoku cloud bottom : 0.9614
Original strategy :
Sell at 0.9645, Target: 0.9545, Stop: 0.9680
Position : -
Target : -
Stop : -
New strategy :
Sell at 0.9645, Target: 0.9545, Stop: 0.9680
Position : -
Target : -
Stop : -
Although the greenback recovered after finding support at 0.9565 on Friday and consolidation above this level would be seen, if our view that top has been made at 0.9705 last week is correct, reckon upside would be limited to minor resistance at 0.9648 and bring another decline later, below 0.9563-65 (50% Fibonacci retracement of 0.9421-0.9705 and said support) would extend weakness to 0.9525-30 (61.8% Fibonacci retracement), however, downside should be limited to 0.9500 and 0.9480-85 should hold.
In view of this, would not chase this fall here and would be prudent to sell dollar again on further recovery as 0.9648 should limit upside. Above 0.9680 would risk retest of said last week’s high at 0.9705, break there would extend recent rise from 0.9421 to 0.9740-50 later.
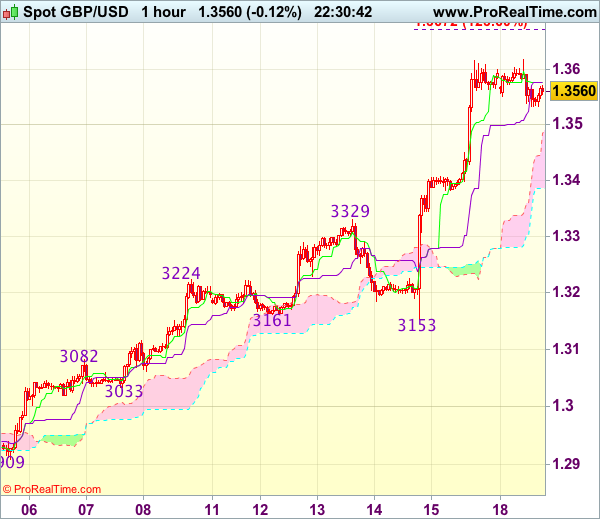
Trade Idea Wrap-up: GBP/USD – Buy at 1.3420
GBP/USD - 1.3545
Most recent candlesticks pattern : N/A
Trend : Near term up
Tenkan-Sen level : 1.3576
Kijun-Sen level : 1.3576
Ichimoku cloud top : 1.3484
Ichimoku cloud bottom : 1.3385
Original strategy :
Buy at 1.3420, Target: 1.3600, Stop: 1.3385
Position : -
Target : -
Stop : -
New strategy :
Buy at 1.3420, Target: 1.3600, Stop: 1.3385
Position : -
Target : -
Stop : -
Although cable edged higher in London morning to 1.3619, lack of follow through buying on break of Friday’s high at 1.3617 and current retreat suggest consolidation with initial mild downside bias would be seen and pullback to 1.3515-20 and then 1.3480 cannot be ruled out, however, reckon downside would be limited to 1.3420-30 and bring another rise later, above said resistance at 1.3619 would extend recent upmove to 1.3650 and possibly towards 1.3675 but upside should be limited to 1.3700-10, bring retreat later.
In view of this, would not chase this rise here and would be prudent to buy cable on subsequent pullback as 1.3420-30 should limit downside. Only below 1.3380-85 would defer and signal a temporary top is formed, bring retracement of recent rise to 1.3350, then 1.3320-25 but 1.3300 should remain intact.
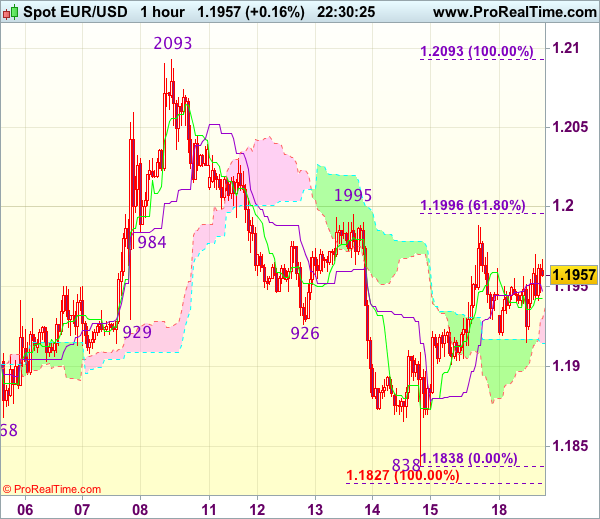
Trade Idea Wrap-up: EUR/USD – Buy at 1.1905
EUR/USD - 1.1950
Most recent candlesticks pattern : N/A
Trend : Near term down
Tenkan-Sen level : 1.1943
Kijun-Sen level : 1.1947
Ichimoku cloud top : 1.1930
Ichimoku cloud bottom : 1.1914
Original strategy :
Buy at 1.1905, Target: 1.2005, Stop: 1.1870
Position : -
Target : -
Stop : -
New strategy :
Buy at 1.1905, Target: 1.2005, Stop: 1.1870
Position : -
Target : -
Stop : -
Although the single currency retreated after meeting resistance at 1.1988 on Friday, last week’s anticipated rebound from 1.1838 suggests low has possibly been formed there and downside should be limited to 1.1900-05, bring another rebound later to 1.1995-00 (previous resistance and 61.8% Fibonacci retracement of 1.2093-1.1838), however, break there is needed to signal the fall from 1.2093 has ended, bring subsequent rise to 1.2030-35 and then 1.2050-55.
In view of this, we are looking to buy euro again on dips as 1.1900-05 should limit downside and bring another rebound. Below 1.1865-70 would abort and suggest the rebound from 1.1838 (last week’s low) has ended, bring retest of this level first.
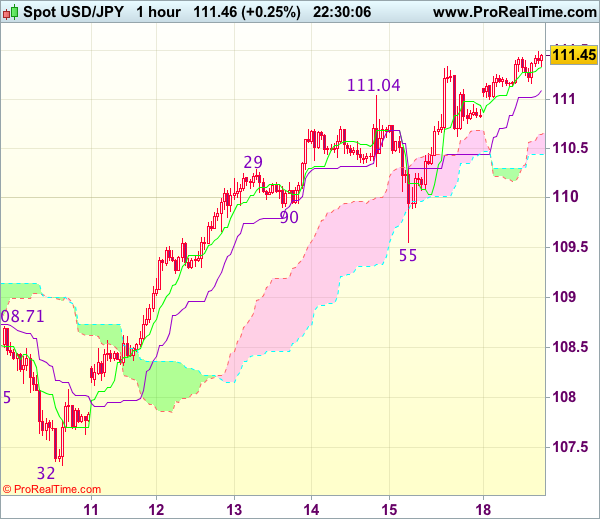
Trade Idea Wrap-up: USD/JPY – Stand aside
USD/JPY - 111.45
Most recent candlesticks pattern : N/A
Trend : Up
Tenkan-Sen level : 111.33
Kijun-Sen level : 111.10
Ichimoku cloud top : 110.64
Ichimoku cloud bottom : 110.45
New strategy :
Stand aside
Position : -
Target : -
Stop : -
Although the greenback has edged higher again after last week’s rally and bullishness remains or recent reversal from 107.32 low to extend gain to 111.55-60, however, reckon upside would be limited to 111.85-90 (61.8% projection of 107.32-111.04 measuring from 109.55) and price should falter below 112.00-10, risk from there has increased for a correction later.
In view of this, would not chase this move here and would be prudent to stand aside for now. Below 111.00 would bring correction to 110.60-65 but downside should be limited to 110.30-35 and price should stay above 110.00, bring rebound later.
Sterling: Modest Profit Taking after Last Week’s Rally
- European stock markets eke out modest gains in a quiet session, as risk sentiment brightened. Us equities open slightly higher.
- The ECB should start discussing a broader range of measures as it seeks policy normalisation rather than just focus on how and when it will dial back stimulus, Governing Council member Hansson said in a Reuters interview.
- Catalonia's economy could shrink as much as 30% and unemployment double if it gains independence, according to the Spanish economy minister Luis de Guindos.
- The annual rate of inflation in the euro area was confirmed at 1.5%. The ECB staff expects to see the headline inflation rate pull back to a low of 0.9% in the first quarter of 2018, as the consequence of negative (energy) base effects. Underlying inflation should not pull back sustainable.
- The US military staged bombing drills with South Korea over the Korean peninsula and Russia and China began naval exercises ahead of a UN General Assembly meeting where North Korea's nuclear threat is likely to loom large.
Rates
Core bonds resume correction lower
Core bonds hovered sideways during much of the session, no eco data nor other items figured on the calendar. During the afternoon session, core bonds slid suddenly lower, the Bund underperforming the US Treasuries. Trade volumes were very low. Today's price action was uneventful, but signalled that the downward correction in core bonds is not over. We are a bit surprised by the market reaction in the afternoon, as the shadow of the FOMC looms and as neither the FX nor the equity markets showed moves of similar amplitude. We suspect the correction was technical inspired.
At the time of writing, changes on the US yield curve range between +1.1 bps (2-yr) and +1.6 bps (30-yr). The German yield curve trades 0.7 bps (2-yr) to 3.6 bps (10-yr) higher. On intra-EMU bond markets, 10-yr yield spread changes versus Germany narrowed across the board (4 bps for Italy and Spain). Portuguese bonds profited much more than other credits with a 29 bps narrowing versus Germany after S&P unexpectedly raised the country's rating to investment grade (BBB-). The impact of the Irish rating upgrade by Moody's (to A2) was less spectacular. The Irish 10-yr spread fell 1 bp versus flat for the semi-core bond yields.
The Belgian debt agency successfully started this week's scheduled EMU bond supply. They tapped three OLO's for a combined €3.5B, the maximum amount on offer: OLO 82 (€1.2B 0.5% Oct2024), OLO 81 (€1.28B 0.8% Jun2027) and OLO 73 (€1.02B 3% Jun2034). The auction bid cover was 1.71. Thank to these taps, the Belgian debt agency already completed over 90% (€32B) of its stated €35B target.
Currencies
USD lingers on in technical trading
USD trading was driven by technical considerations. There was little hard news to guide trading. The dollar continues to trade soft against the euro, but holds strong against the yen. EUR/USD trades in the 1.1960 area. USD/JPY is changing hands at around 111.45. EUR/JPY extends its break beyond the 132 previous resistance.
Overnight, Asian equities gained between 0.5% and 1.0%, supported by record closing levels on WS on Friday. Chinese house price increases slowed further in August, reducing the need for additional measures to cool house prices. This added to the Chinese risk-on sentiment. The yen held near recent lows with USD/JPY trading in the 111.15 area. EUR/USD traded in the 1.1940 area.
There was little high profile news to guide trading in core EMU FI and FX. EMU August CPI (1.5% Y/Y) was confirmed as expected. European markets joined the risk-on trade from WS on Friday and from Asia this morning. The combination of a positive risk sentiment and a marginally rise in core yields kept the yen under pressure. USD/JPY and EUR/JPY tried to extend gains. EUR/JPY tested last week's top in the 133.10 area. The test initially failed. The subsequent decline of EUR/JPY also sent EUR/USD temporary back south. However, EUR/USD returned soon to the mid 1.19 area. USD/JPY drifted sideways in the lower half of the 111 big figure. Spreads on intra-EMU bond markets narrowed on positive credit news in some countries (e.g. Portugal). However, the impact on the euro, if any, was limited.
The dollar still showed no clear directional trend as US traders joined the fray. There were again several headlines indicating that relations between the US and North Korea remain tense. However, for now, the theme is more or less worked out as a driver for markets. At EUR/USD 1.1955 and USD/JPY 111.45, the dollar trades a bit soft against the euro, but remains strong against the yen.
Sterling: modest profit taking after last week's rally
After a week of very strong gains on hawkish BoE talk, sterling finally fell prey to modest profit taking. We didn't see a specific trigger. Overnight, Rightmove UK house prices were materially weaker than expected, but we doubt that these data were the real trigger. Investors holding sterling longs probably preferred to take some chips of the table ahead of an upcoming speech from BoE Carney and a key Brexit speech from UK PM May on Friday. EUR/GBP rebounded from the 0.8780 area to the 0.8835/40 area. This is a nice countermove, but it remains limited given last week's impressive sterling gains. Cable also dropped off the 1.36+ correction top and trades currently in the mid 1.35 area
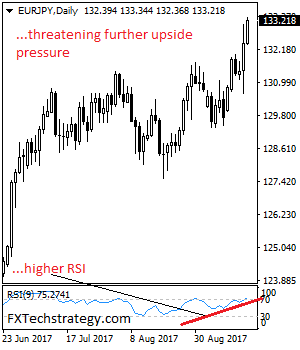
EURJPY Resumes Broader Uptrend, Remains On The Offensive
EURJPY: The pair remains offensive following its trend resumption the past week. On the downside, support comes in at the 133.00 level where a break if seen will aim at the 132.50 level. A cut through here will turn focus to the 132.00 level and possibly lower towards the 131.50 level. On the upside, resistance resides at the 132.00 level. Further out, we envisage a possible move towards the 133.50 level. Further out, resistance resides at the 134.00 level with a turn above here aiming at the 134.50 level. On the whole, EURJPY faces further bull pressure in the days ahead.
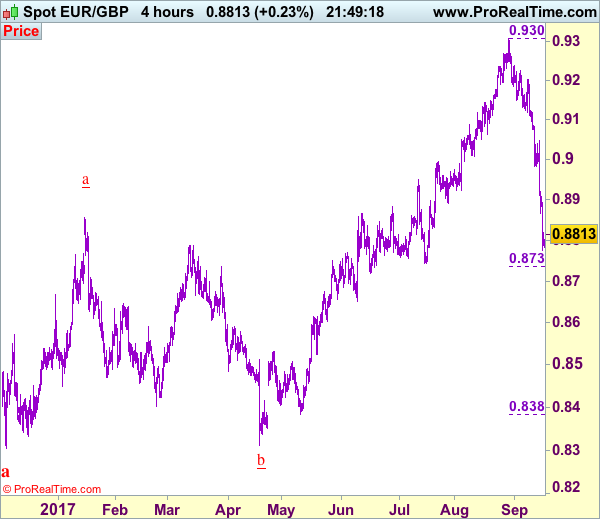
Trade Idea: EUR/GBP – Sell at 0.8900
EUR/GBP - 0.8820
Original strategy :
Sell at 0.8900, Target: 0.8780, Stop: 0.8940
Position : -
Target : -
Stop : -
New strategy :
Sell at 0.8900, Target: 0.8780, Stop: 0.8940
Position : -
Target : -
Stop : -
The single currency recovered after falling to 0.8774 on Friday, suggesting minor consolidation above this level would be seen and corrective bounce to 0.8850-60 is likely, however, reckon upside would be limited to resistance at 0.8907 and bring another decline later, below said support at 0.8774 would signal the reversal from 0.9307 top is still in progress and bearishness remains for this fall to extend weakness towards 0.8737-43 (61.8% Fibonacci retracement of 0.8384-0.9307 and previous support) but near term oversold condition should limit downside to 0.8719 support and reckon another previous chart support at 0.8652 would hold, bring rebound later.
In view of this, would not chase this fall here and we are looking to sell euro on recovery as resistance at 0.8907 would limit upside and bring another decline later. Above 0.8940-50 would defer and risk a stronger rebound to 0.8975-80 but price should falter below 0.9000 and bring another selloff next week.
Our preferred count is that, after forming a major top at 0.9805 (wave V), (A)-(B)-(C) correction is unfolding with (A) leg ended at 0.8400 (A: 0.8637, B: 0.9491 and 5-waver C ended at 0.8400. Wave (B) has ended at 0.9413 and impulsive wave (C) has either ended at 0.8067 or may extend one more fall to 0.8000 before prospect of another rally. Current breach of indicated resistance at 0.9043 confirms our view that the (C) leg has ended and bring stronger rebound towards 0.9150/54, then towards 0.9240/50.
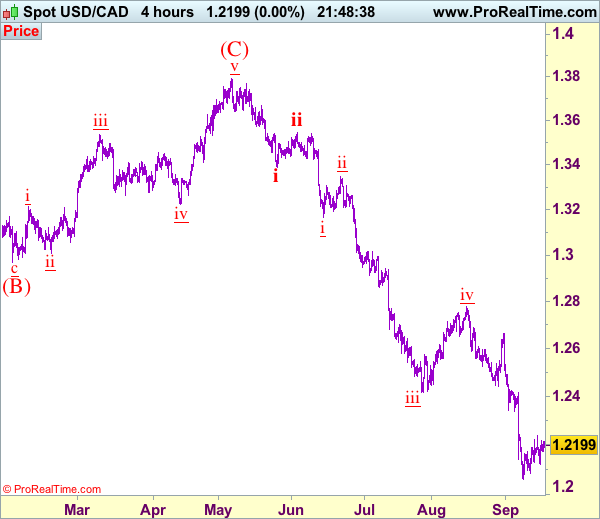
Trade Idea: USD/CAD – Hold short entered at 1.2240
USD/CAD - 1.2195
Trend: Down
Original strategy :
Sold at 1.2240, Target: 1.2080, Stop: 1.2240
Position: - Short at 1.2240
Target: - 1.2080
Stop: - 1.2240
New strategy :
Hold short entered at 1.2240, Target: 1.2080, Stop: 1.2240
Position: - Short at 1.2240
Target: - 1.2080
Stop:- 1.2240
Although the pair rebounded after finding support at 1.2121 on Friday, retaining our view that further consolidation would take place, however, as long as indicated resistance at 1.2240 holds, bearishness remains for recent decline to resume after consolidation, below said support at 1.2121 would signal the rebound from 1.2061 has ended, bring retest of this level later, below there would confirm recent decline has resumed and extend weakness towards psychological support at 1.2000 but loss of downward momentum should prevent sharp fall below 1.1950-60, bring rebound later. We are keeping our count that wave v as well as wave (C) ended at 1.3794 and impulsive wave (i ii, i ii) is now unfolding with minor wave iii ended at 1.2414, followed by wave iv correction ended at 1.2778, wave v has reached our indicated downside target at 1.2100 and may extend to 1.2000.
In view of this, we are holding on to our short position entered at 1.2240. Above 1.2240-50 would risk rebound to 1.2300 but only break there would defer and signal a temporary low has been formed, bring a stronger rebound to 1.2335-40, however, upside should be limited to resistance at 1.2429 and price should falter well below 1.2490-00.
To recap, wave B from 1.3066 is unfolding as an a-b-c and is sub-divided as a: 1.2192, b: 1.2716 and wave c is a 5-waver with i: 1.1983, ii: 1.2506, extended wave iii with minor iii at 1.0206, wave iv ended at 1.0781 and wave v as well as wave iii has ended at 0.9931, hence the subsequent choppy trading is the wave iv which is unfolding as (a)-(b)-(c) with (a) leg of iv ended at 1.0854, followed by (b) leg at 1.0108 and (c) leg as well as the wave iv ended at 1.0674. The wave v is sub-divided by minor wave (i): 0.9980, (ii): 1.0374, (iii): 0.9446, (iv): 0.9913 and (v) as well as v has possibly ended at 0.9407, therefore, consolidation with upside bias is seen for major correction, indicated target at 1.3700 and 1.4000 had been met and further gain to 1.4700 would be seen later.
Are the Markets Right to Ignore the German Election?
She has seen a key world economy through a global financial crash, presided over the biggest refugee crisis in living memory, out-served no fewer than three US Presidents, and driven German unemployment rates to a record low. With a general election just three weeks away, is Angela Merkel poised to add another four years to her term in office? FXTM's VP of Market Research and Corporate Development, Jameel Ahmad, explores what the German election could mean for the eurozone.
The Euro closed trading last week (1 September) high against both the dollar and sterling, pushing the $1.20 mark for the first time in two and a half years. Given that the financial markets have spent the last 12 months riding the waves of political uncertainty and shock election results, you could be forgiven for thinking this news heralds the start of a calmer period. But the EU still has one major hurdle left to jump.
The German Election, scheduled for 24 September, has the potential to squeeze the recent EUR gains. For the moment, the markets seem unconcerned, and happy to assume that Angela Merkel will remain firmly at the tiller of the eurozone's leading nation. The polls certainly support this theory, and Merkel's Christian Democratic Union (CDU) and its counterpart, the Christian Social Union (CSU), are expected to maintain power; a ZDF poll published on Friday shows the two leading with 39% support. An all-out majority in the Bundestag is unlikely – the CDU and CSU currently rule in coalition with the Social Democratic party (SPD); it remains to be seen which of the smaller parties will have enough clout to be a part of the coalition.
To assume that Merkel will win and the status quo maintained, is narrow-sighted at best. The examples from the EU referendum and US election in 2016 show that investors should not underestimate the risks of underpricing heading into a vote. Merkel may have a significant number of economic and social achievements under her belt, but these have a tendency to be overlooked by voters.
The reported 15-20 point margin, may be enough to allay market fears for now, but Merkel is thought to face stiff opposition from the SPD's new leader (and former President of the European Parliament) Martin Schulz. His appointment in January boosted the popularity of the party, making it a true contender for the first time in this election cycle.
A loss for Merkel, or a Theresa May-style - limping victory, would have a significant impact on financial market fluctuations, and quite possibly on European economic health. The improved sentiment around Europe this year makes it the destination of choice for investments, with major European equities and the Euro enjoying a revival.
French President Emmanuel Macron may find himself in the unexpected position of becoming the premier force in the European Union. With an integrationist agenda that rivals that of both Merkel and Schulz, Macron could be expected to expedite plans for common tax policies and a eurozone spending ministry. He would also ensure that the divorce settlement for the UK is tough, and any conflict at the Brexit negotiation table will only add to the uncertainty that has already contributed to GBP losses.
Political commentators agree that the German public have very little appetite for reform, and the global expectation is that come 25 September, Angela Merkel will once more be safely ensconced in the Chancellery. It's an outcome the financial markets seem to be buying into.
Whether that's wishful thinking or well-founded confidence remains to be seen; but given the results of other major elections and the historic EU referendum, it would hardly surprise me if in three weeks' time, I found myself writing about the shock German vote and increased market volatility.
USDJPY Tests Resistance Confluence
The USDJPY has opened the new trading week with renewed bullish trading momentum, with the pair moving to an eight-week trading high, hitting 111.42, during the European trading session.
Price-action is currently trading around a confluence of critical technical resistance, with both daily and weekly 200-period moving averages, and the USDJPY monthly pivot point all situated within a 20-pip radius of each other.
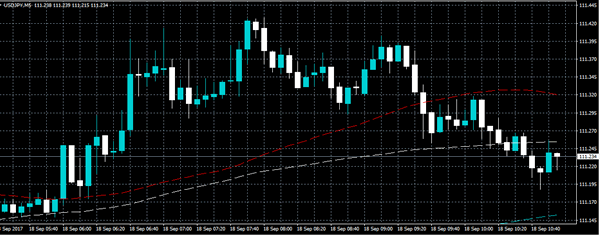
The USDJPY pair threatens further bullish advancement whilst trading above the 110.68, a series of higher-frame price closes above the 111.65 level would signal a major upside technical break-out.
Key intraday technical resistance is located at 111.48, 111.58 and 111.65. Above the 111.65 level, price-action should initially target 112.30 and 112.80.
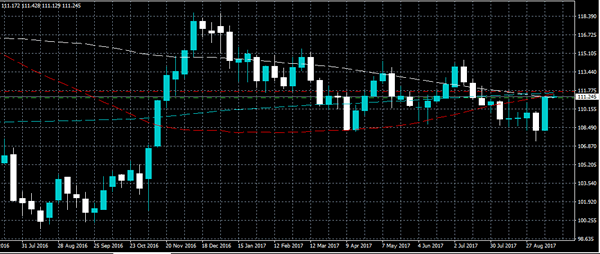
To the downside, key technical support is located at the 100-week moving average, at 111.17, with further support at 111.04.
Below the 111 level, further intraday support is found at 110.84 and 110.68.