Sample Category Title
EURUSD Tests Upside of Narrow Range
The EURUSD pair is attempting to recover bullish trading momentum, after briefly dipping below its weekly pivot point, and finding strong intraday buying interest from the 1.1915 level.
Price-action is currently trading around the 1.1960 region, after finding interim resistance from the 1.1969 level. The EURUSD pair remains intraday bullish while holding above the key 1.1957 technical level.
Traders should now look for technical price-closes above the 1.1979 level, for further confirmation of a continuation in EURUSD upside.
Key technical resistance above the 1.1979 level is located at 1.1999, 1.2030-40 and the former yearly price-high, at 1.2069.
Should price move back below the 1.1957 level, key intraday EURUSD support is found at the daily pivot point, at 1.1946, with the weekly pivot point, at 1.1938.
Below the 1.1938 level, further technical support is found at 1.1915, 1.1889 and 1.1870.
EUR/USD Mid-Day Outlook
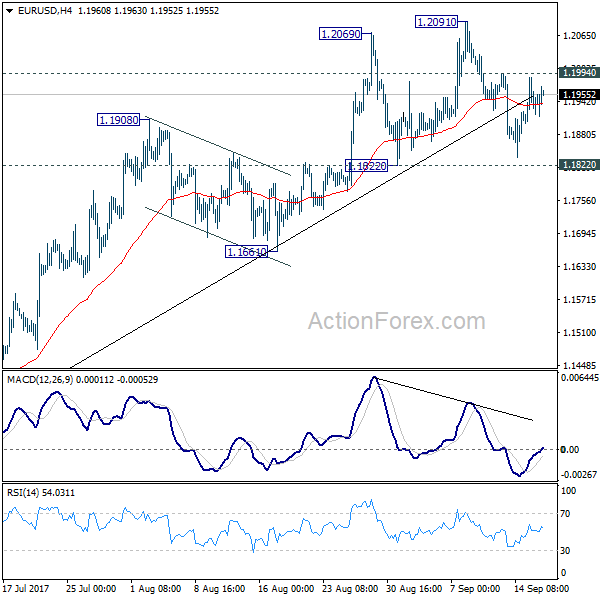
Daily Pivots: (S1) 1.1862; (P) 1.1892 (R1) 1.1947; More...
Intraday bias in EUR/USD remains neutral for the moment. With 1.1822 support intact, near term outlook stays bullish for another rise. Above 1.1994 minor resistance will turn bias to the upside for 1.2091 first. Break there will extend larger rise from 1.0339 and target next key fibonacci level at 1.2516. But considering bearish divergence condition in 4 hour MACD, break of 1.1822 will confirm short term topping and bring deeper fall back to 1.1661 support and below.
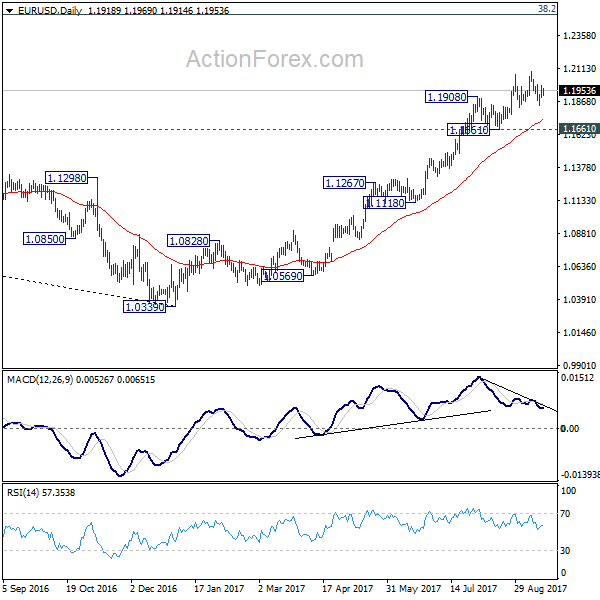
In the bigger picture, rise from medium term bottom at 1.0339 is still in progress for 38.2% retracement of 1.6039 (2008 high) to 1.0339 (2017 low) at 1.2516. However, it should be noted that there is no confirmation of trend reversal yet. That is, such rebound from 1.0399 could be a correction. And the long term fall fro 1.6039 (2008 high) could resume. Hence, we'd be cautious on strong resistance from 1.2516 to limit upside. But after all, break of 1.1661 is needed to indicate medium term topping. Otherwise, outlook will remain bullish in case of pull back.
GBP/USD Mid-Day Outlook
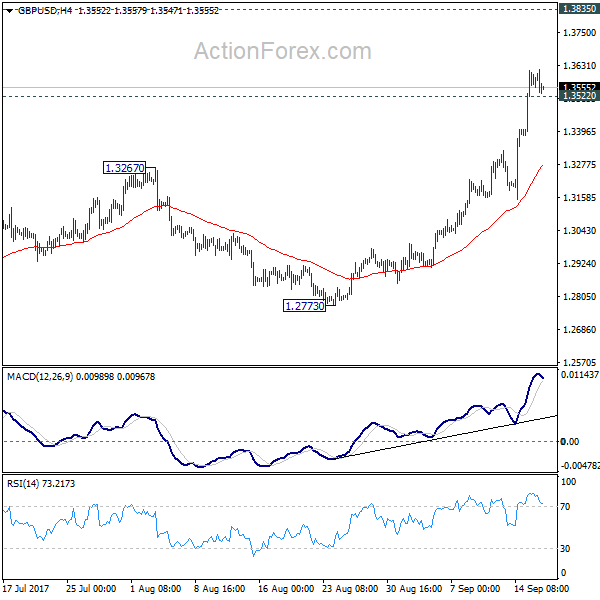
Daily Pivots: (S1) 1.3435; (P) 1.3526; (R1) 1.3674; More....
With 1.3522 minor support intact, intraday bias in GBP/USD remains on the upside for 1.3835 support turned resistance next. Break there will target 55 month EMA (now at 1.4405). On the downside, below 1.3522 minor support will turn intraday bias neutral and bring consolidations, before staging another rally.
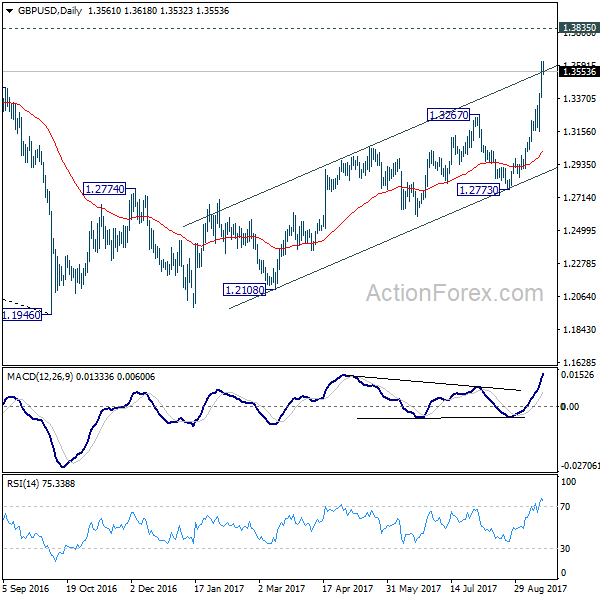
In the bigger picture, the strong break of 1.3444 key resistance now argues that the long term trend in GBP/USD has reversed. That is a key bottom was formed back in 1.1946 on bullish convergence condition in monthly MACD. Current rise from 1.1946 will target 38.2% retracement of 2.1161 (2007 high) to 1.1946 (2016 low) at 1.5466 next. In any case, medium term outlook will now stay bullish as long as 1.2773 support holds.
Trade Idea Update: USD/CHF – Sell at 0.9645
USD/CHF - 0.9597
Original strategy :
Sell at 0.9645, Target: 0.9545, Stop: 0.9680
Position : -
Target : -
Stop : -
New strategy :
Sell at 0.9645, Target: 0.9545, Stop: 0.9680
Position : -
Target : -
Stop : -
Although the greenback has recovered after finding support at 0.9565 on Friday and consolidation above this level would be seen, if our view that top has been made at 0.9705 last week is correct, reckon upside would be limited to minor resistance at 0.9648 and bring another decline later, below 0.9563-65 (50% Fibonacci retracement of 0.9421-0.9705 and said support) would extend weakness to 0.9525-30 (61.8% Fibonacci retracement), however, downside should be limited to 0.9500 and 0.9480-85 should hold.
In view of this, would not chase this fall here and would be prudent to sell dollar again on further recovery as 0.9648 should limit upside. Above 0.9680 would risk retest of said last week’s high at 0.9705, break there would extend recent rise from 0.9421 to 0.9740-50 later.

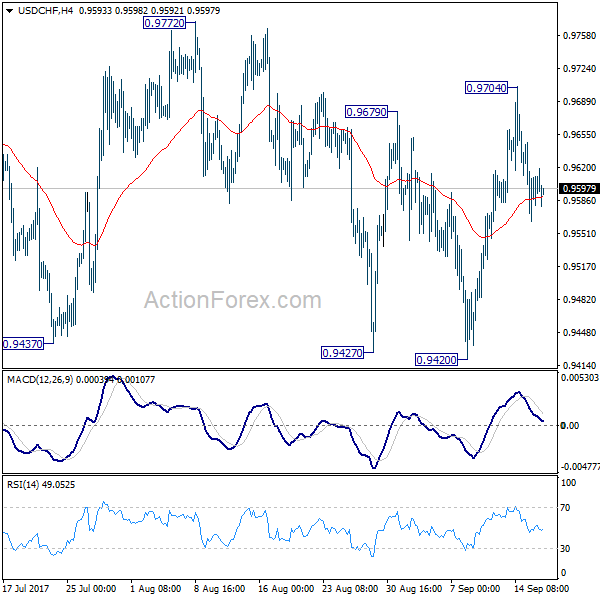
USD/CHF Mid-Day Outlook
Daily Pivots: (S1) 0.9556; (P) 0.9602; (R1) 0.9638; More....
Intraday bias in USD/CHF remains mildly on the downside for 0.9420 support. With 0.9772 resistance intact, outlook remains bearish. Break of 0.9420 will resume medium term fall from 1.0342 and target next long term fibonacci level at 0.9090. However, firm break of 0.9772 will indicate trend reversal and turn outlook bullish.
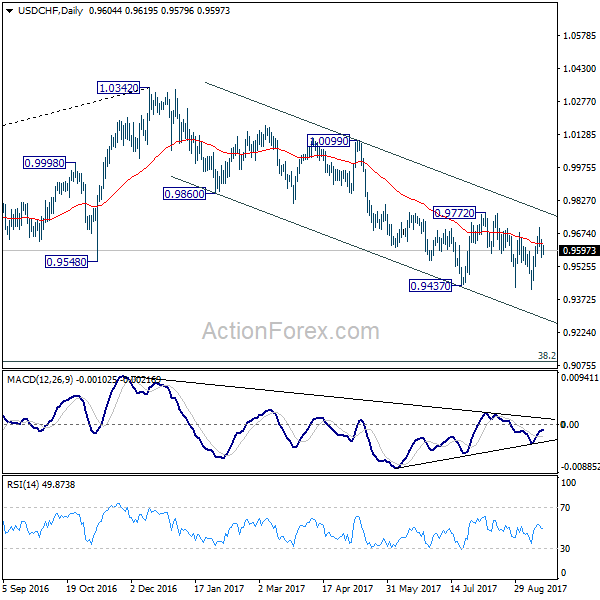
In the bigger picture, current development suggests that 0.9443 key support (2016 low) could be taken out firmly as down trend form 1.0342 extends. There are various interpretation of the price actions. But in any case, medium term outlook will stay bearish as long as 0.9772 resistance holds. Current down trend could extend to 38.2% retracement of 0.7065 (2011 low) to 1.0342 (2016 high) at 0.9090. However, break of 0.9772 will indicate that USD/CHF has successfully defended 0.9443 again and turn outlook bullish for 1.0099 resistance.
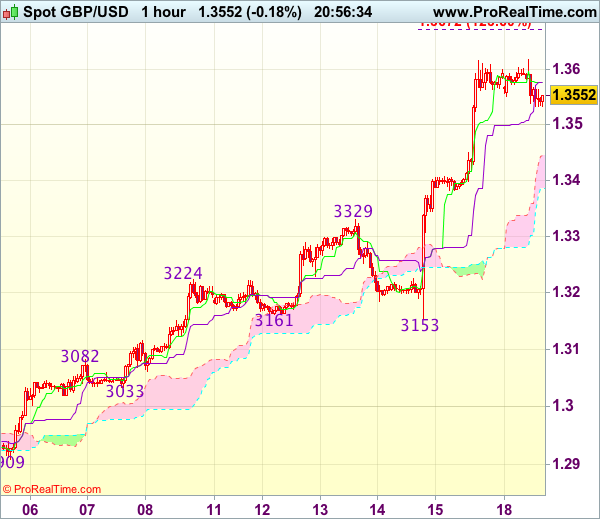
Trade Idea Update: GBP/USD – Buy at 1.3420
GBP/USD - 1.3555
Original strategy :
Buy at 1.3420, Target: 1.3600, Stop: 1.3385
Position : -
Target : -
Stop : -
New strategy :
Buy at 1.3420, Target: 1.3600, Stop: 1.3385
Position : -
Target : -
Stop : -
Although cable edged higher in London morning to 1.3619, lack of follow through buying on break of Friday’s high at 1.3617 and current retreat suggest consolidation with initial mild downside bias would be seen and pullback to the Kijun-Sen (now at 1.3518) cannot be ruled out, however, reckon downside would be limited to 1.3420-30 and bring another rise later, above said resistance at 1.3619 would extend recent upmove to 1.3650 and possibly towards 1.3675 but upside should be limited to 1.3700-10, bring retreat later.
In view of this, would not chase this rise here and would be prudent to buy cable on subsequent pullback as 1.3420-30. Only below 1.3380-85 would defer and signal a temporary top is formed, bring retracement of recent rise to 1.3350, then 1.3320-25 but lower Kumo (now at 1.3302) should remain intact.
CAC Gains Ground on Strong Eurozone Inflation Report
The CAC index has started the trading week with gains. Currently, the index is at 5,226.00, up 0.26% on the day. On the release front, Eurozone Final CPI improved to 1.5%, matching the forecast. On Tuesday, the eurozone releases its current surplus and ZEW Economic Sentiment, both of which are expected to improve.
France received a thumbs-up from the OECD last week, which released a report on the French economy. The OECD is forecasting French growth of 1.7% in 2017, compared to a 1.1% gain in 2016. The report commended President Emmanuel Macron's agenda to reform the economy, but emphasized that the government needed to cut public sector spending, which is the highest in the 35-member OECD. The report also called on the French government to overhaul the country's labor laws, including cutting pension costs and raising the current retirement age of 62 years. With President Emmanuel Macron declaring he will reform France's labor laws, powerful trade unions are mobilizing to fight back. On Tuesday, some 200,000 trade unionists came out for a mass protest. The government plans to adopt new labor rules on September 22, and two large unions have threatened to respond with a massive truckers strike on September 25, which could cause chaos across the country.
French President Emmanuel Macron, a staunch supporter of a unified Europe, is hoping to continue working with German Prime Minister Angela Merkel after the German election, and focus on reforming the eurozone. Macron's proposal includes a eurozone finance minister who would be in charge of a eurozone budget. Macron's call for greater cooperation is linked to Britain's exit from the EU, which could lead to divisions among the remaining 27 members in the bloc. However, the French ambitious plan will need Germany's support before it can become a reality. Will Germany embrace the idea? Angela Merkel has indicated that she is open to the idea, but Jean-Claude Juckner, head of the European Commission, came out against the plan last week. Juckner said he favored a finance minister for the EU but was against a separate eurozone budget and finance minister. Even if the plan is not adopted, we can expect a Macron-Merkel alliance to take steps which will strengthen Franco-German ties and further unify the eurozone.
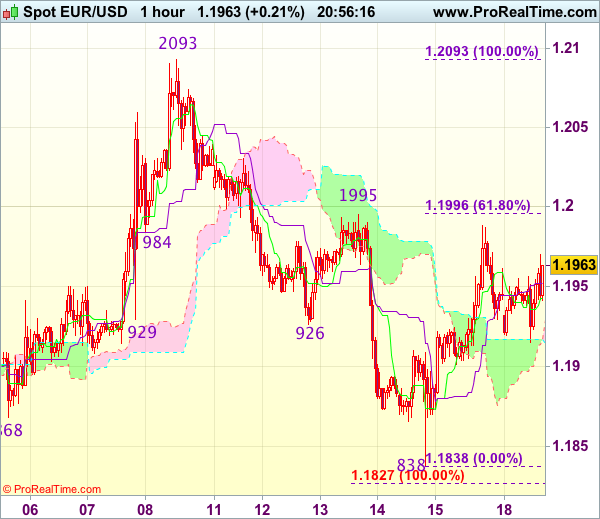
Trade Idea Update: EUR/USD – Buy at 1.1905
EUR/USD - 1.1961
Original strategy :
Buy at 1.1905, Target: 1.2005, Stop: 1.1870
Position : -
Target : -
Stop : -
New strategy :
Buy at 1.1905, Target: 1.2005, Stop: 1.1870
Position : -
Target : -
Stop : -
Although the single currency retreated after meeting resistance at 1.1988 on Friday, last week’s anticipated rebound from 1.1838 suggests low has possibly been formed there and downside should be limited to 1.1900-05, bring another rebound later to 1.1995-00 (previous resistance and 61.8% Fibonacci retracement of 1.2093-1.1838), however, break there is needed to signal the fall from 1.2093 has ended, bring subsequent rise to 1.2030-35 and then 1.2050-55.
In view of this, we are looking to buy euro again on dips as 1.1900-05 should limit downside and bring another rebound. Below 1.1865-70 would abort and suggest the rebound from 1.1838 (last week’s low) has ended, bring retest of this level first.
Trade Idea Update: USD/JPY – Stand aside
USD/JPY - 111.41
New strategy :
Stand aside
Position : -
Target : -
Stop : -
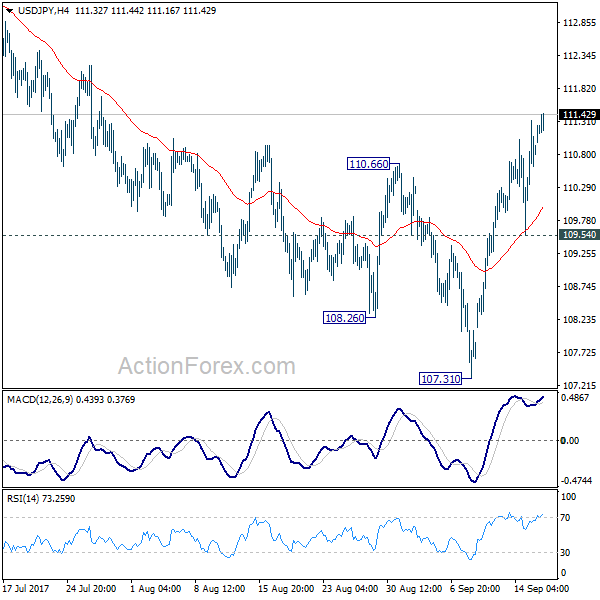
Although the greenback has edged higher again after last week’s rally and bullishness remains or recent reversal from 107.32 low to extend gain to 111.55-60, however, reckon upside would be limited to 111.85-90 (61.8% projection of 107.32-111.04 measuring from 109.55) and price should falter below 112.00-10, risk from there has increased for a correction later.
In view of this, would not chase this move here and would be prudent to stand aside for now. Below 111.00 would bring correction to 110.60-65 but downside should be limited to 110.30-35 and price should stay above 110.00, bring rebound later.
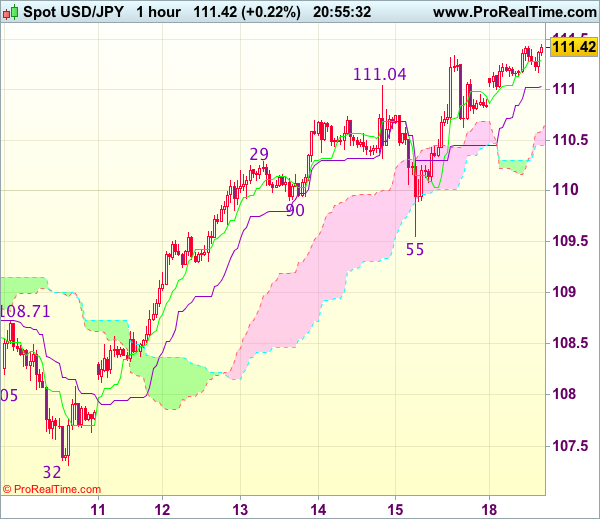
USD/JPY Mid-Day Outlook
Daily Pivots: (S1) 109.79; (P) 110.56; (R1) 111.59; More...
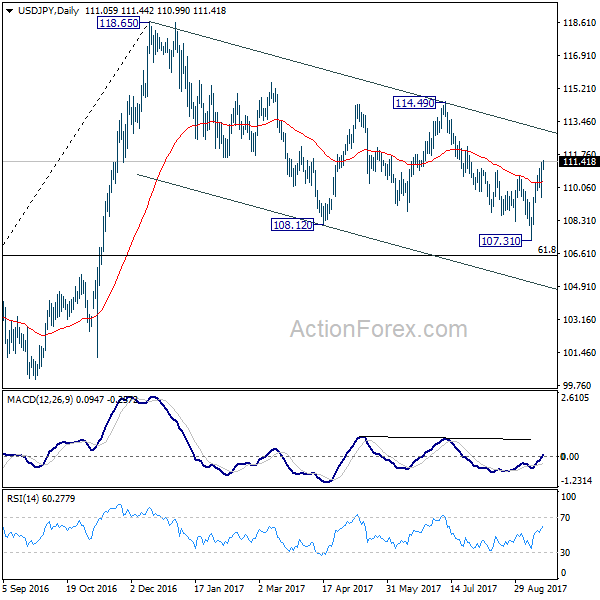
USD/JPY's rebound from 107.31 continues today and reaches 111.44 so far. Intraday bias remains on the upside for medium term channel resistance (now at 112.91). Sustained break there will argue that whole correction from 118.65 has completed too. In that case, further rise should be seen to 114.49 resistance for confirmation. On the downside, break of 109.54 support is needed to indicate completion of the rebound. Otherwise, outlook will stay cautiously bullish in case of retreat.
In the bigger picture, rise from 98.97 (2016 low) is seen as the second leg of the corrective pattern from 125.85 (2015 high). It's unclear whether this this second leg has completed at 118.65 or not. But medium term outlook will be mildly bearish as long as 114.49 resistance holds. And, there is prospect of breaking 98.97 ahead. Meanwhile, break of 114.49 will bring retest of 125.85 high. But even in that case, we don't expect a break there on first attempt.