Sample Category Title
EURUSD Intraday Analysis
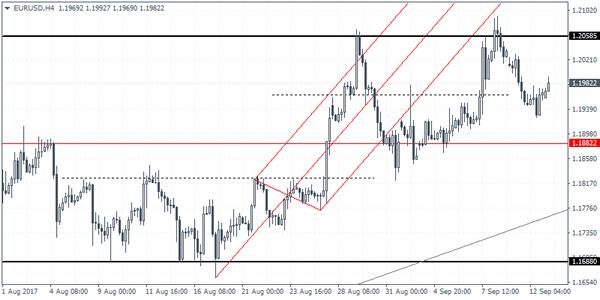
EURUSD (1.1982): The EURUSD closed with some minor gains yesterday, and price action is looking to retest the 1.2058 resistance level once again. The strong consolidation near this resistance level suggests that the bullish momentum could be intact. The reversal near the minor support at 1.1936 shows a potential cup and handle pattern in the making. Price needs to break out above 1.2058 in order to push higher. This also puts the minimum upside in EURUSD towards 1.2180 - 1.2200. However, in the event that EURUSD fails to breakout above 1.2058, we can expect the consolidation to keep the currency pair trading flat within 1.2058 and 1.1882 levels of resistance and support.
GBP Surges As Inflation Accelerates, Traders Look To Wages
The British pound maintained strong gains as the currency pair was seen trading above $1.3300. The gains came after the monthly inflation data showed a strong increase overall. Headline consumer prices accelerated 2.9%, rising sharply from 2.6% the month before and beating estimates of 2.8% increase. The core CPI also increased sharply, rising 2.7% on the month. PPI input and output prices also increased significantly suggesting that inflation in the coming months will continue to rise further.
Looking ahead, the economic data today will see the UK's labor market statistics. The average earnings will be the main focus with economists forecasting an increase in wages by 2.3%. However, with yesterday's inflation rising faster than expected, wage growth continues to lag. Elsewhere, in the US trading session, the monthly producer prices data will be released today. Overall, the data is expected to show that inflation at factory gate might have increased in August, following a modest decline the month before.
Currencies: Will (US) Data Support Further USD Gains?
Sunrise Market Commentary
- Rates: Can US eco data start a 2nd downleg in US T's this week?
Core bonds corrected lower since Friday afternoon as risk sentiment improved with new closing highs for main US equity indices. Technically, US yields regained lost support levels at key tenors. For a new upleg in US yields, we probably need strong eco data today (PPI) and later this week (CPI, retail sales, industrial production,…) - Currencies: Will (US) data support further USD gains?
Earlier this week, the dollar profited from a positive reversal in global sentiment. This risk-rebound might ease. Today and tomorrow, the focus might shift to the US price data. Will they be good enough to sustain a further USD rebound. Sterling is propelled higher by an unexpected rise in inflation. Today's wage data, if better, might reinforce the move
The Sunrise Headlines
- The bullish start to the week for US equities is still going strong, with the Dow Jones, Nasdaq and S&P 500 all notching new record closing highs. Asian stock markets trade mixed overnight.
- The Trump administration has warned China that the US will target Chinese banks unless Beijing takes much stronger measures to impose economic pain on North Korea by reducing trade and financial transactions with the regime.
- US Treasury Secretary Mnuchin casts doubt on President Trump's chances of cutting the corporate tax rate to 15%. Trump met with 6 senators including 3 Democrats who set clear conditions for future cooperation with him on taxes.
- US oil inventories jumped 6.18 million barrels last week as refineries recovered from weather disruptions. The EIA cut US output forecasts for 2017 and 2018, while also reducing its demand outlook for next year.
- The total volume of bad debts held by Italian banks shrank by €18bn in July to €173bn (lowest since 2014), in a sign that Italy's struggling financial sector is starting to benefit from stronger economic growth and greater investor interest.
- Brexit negotiators postponed next week's scheduled round of talks, adding to signs Theresa May is planning a public speech on her divorce strategy. EU and UK officials will now likely meet starting Sept. 25, people familiar said.
- Today's calendar contains EMU industrial production, US PPI number and UK labour market data. Germany, Italy and the US tap the bond market and ECB Praet speaks in Frankfurt
Currencies: Will (US) Data Support Further USD Gains?
Will (US) data support further USD gains?
The risk rebound continued yesterday, but at a slightly lower pace. This was also the case for the rise in core yields and of the dollar. Investors further reduced ‘excessive' USD long positions as tensions eased. USD/JPY still outperformed and managed to regain the 110 mark to close to session at 110.17. The dollar's rebound against the euro petered out. EUR/USD finished the session at 1.1967, from 1.1953 on Monday.
The risk rebound is losing momentum in Asia despite record closings of the Nasdaq and the S&P on WS. The rise in US yields also slows. USD/JPY stabilizes in the low 110 area. EUR/USD is returning slightly higher in the 1.19 big figure (currently 1.1985). Geopolitical tensions (North Korea) have eased this week, but the bickering continues even after the approval of new UN sanctions. The PBOC again weakened the fixing of the yuan against the dollar. This follows other measures that are seen as the PBOC trying to prevent a further protracted rebound off its currency. The CNY/CNH trade marginally stronger this morning.
The eco calendar is better filled today. Final German August inflation data and the EMU July production data won't change the picture for FX trading. In the US, the focus is on tomorrow's CPI data. However, today's PPI's might also move markets in case of a substantial surprise. Recently, moves in the dollar were mainly driven by global investor sentiment. It is interesting to see whether the data regain impact on interest rates and on the dollar. The August PPI is expected substantially higher at 0.3% M/M and 2.5% Y/Y (from 1.9%). August inflation data in other countries tended to be a bit higher than expected, but there is no one-to-one link, especially not on the level of the PPI's. The dollar is trying to build a bottoming out pattern. This process could become more solid if US data are good, or at least if they don't create new doubts. Later in the session, we keep an eye at a speech of ECB's Praet in Frankfurt. He maintained a rather soft bias of late. The dollar made a nice rebound earlier this week. The sentiment-driven rally might lose momentum and it is not that obvious that other news will already be able ready to trigger a further upleg. So, some consolidation might be on the cards
Global context. The euro remained strong last week even as the ECB delayed communication on APP tapering till October and as Draghi kept a soft tone. Markets take the view that ECB policy normalisation will come anyway. At the same time, the dollar lost further interest rate support as global uncertainty kept US yields on a downward trajectory. The decline in US yields and of the dollar has probably gone far enough given recent US eco data, which were fairly good. A technical correction occurred this week. The dollar in the first place needs an improvement in global sentiment and higher yields. US data will probably become noisy due to the impact of the hurricanes. This might cloud the Fed outlook and complicate a USD rebound. In this context, we want more confirmation that the recent USD bottoming out process might be the start of more sustained USD gains. For now we assume that further gains will be tough an limited.
Dollar sentiment remains fragile and this is visible in the technical picture of both EUR/USD and USD/JPY. EUR/USD last week set a minor new correction top at 1.2092. A return below 1.1823 would be a technical sign that the EUR/USD rally has run its course short-term. We are not that far yet. USD/JPY regained the previous range bottom at 108.13, but more confirmation is needed to conclude that the dollar is bottoming. Regaining the 110.67/95 would be a first positive sign.
EUR/USD off recent top, but technical picture hasn't changed
EUR/GBP
Will wage data support further GBP-gains?
UK eco data came in the spotlight yesterday. UK August inflation rose much more than expected from 2.6% Y/Y to 2.9%. Core inflation was also above consensus at 2.7% Y/Y. At the August policy meeting, the BoE kept a wait-and-see bias even as it was aware that inflation could reach 3.0%. The current uptick will probably force the BoE to give more weight to inflation, even as growth slows and as Brexit uncertainty persists. The sterling rebound accelerated after the CPI release. EUR/GBP dropped temporary below the 0.90 mark and finished the session at 0.9009. Cable closed the session at 1.3283, even as the dollar was well bid across the board. The UK announced that the next round of Brexit negotiations will be postponed, but it had little impact on trading.
UK labour market data will be published today. Job market data are expected to remain solid. Wage growth is expected to rise from very low Y/Y-levels (average earnings from 2.1% to 2.3%). A positive surprise will raise speculation on a (limited) BoE rate hike furhter down the road. We don't expect the BoE already to take action this week, but more positive inflation news might force Carney and Co to adapt their rhetoric. Sterling made already a good run of late, but it might still go a bit further;
From a technical point of view, EUR/GBP cleared 0.8854/80 resistance (top end June), opening the way for a protracted August rebound. The move was the result of euro strength. Simultaneously, UK price data were soft enough to keep the BoE side-lined. Recent price data amended this story. We maintain a buy-on-dips approach as we expect the combination of relative euro strength and sterling softness to persist. The 0.9415 ‘flash-crash spike' is the next target on the charts. However, we let the current correction do its job, e.g. to the technical support in the 0.88/89 area, to sell sterling versus the euro
EUR/GBP: correction continues on higher inflation data
AUDUSD Bullish Trend Intact But Upside Momentum Eases
AUDUSD is in an uptrend but is making a corrective move lower after hitting a high of 0.8124 last Friday. This was the highest level since May 2015. The key level at 0.8000 is expected to act as strong support.
The RSI and MACD oscillators are flat and are indicative of a loss in upside momentum for AUDUSD, which is expected to consolidate above 0.8000 support. A breach of this would target the August 15 low at 0.7807. Below this support, the 0.7724 level comes into view. This is the 50% Fibonacci retracement of the upleg from 0.7328 to 0.8124. A drop under this important level would shift the bias to a bearish one to target 0.7632 at the 61.8% Fibonacci. An extension lower would give scope to reach the May low at 0.7328.
Major resistance stands at 0.8124 which needs to be cleared in order for the uptrend to resume and target the next major peaks at 0.8162 and 0.8294.
Trend indicators are bullish and the 50-day and 200-day moving averages are positively aligned after the bullish crossover on July 14. Momentum oscillators are turning neutral, supporting the idea that the uptrend is easing (with a correction not to be ruled out) and is likely entering a neutral phase in the short term. The medium-term bullish trend remains intact.

EUR/USD Daily Outlook
Daily Pivots: (S1) 1.1935; (P) 1.1956 (R1) 1.1987; More...
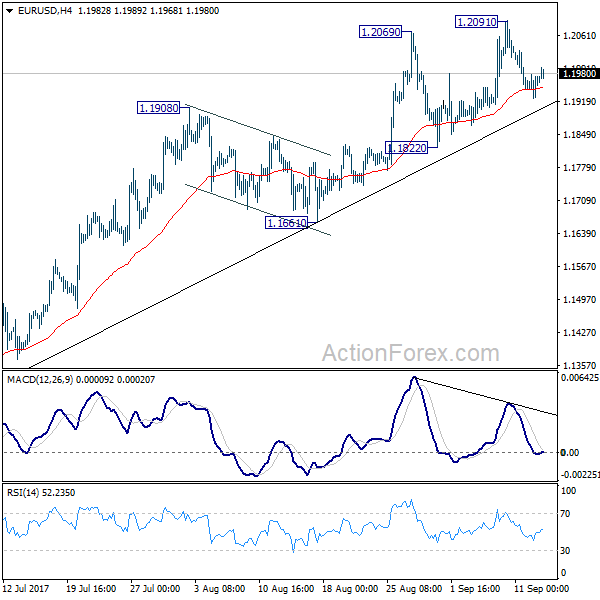
EUR/USD is staying in consolidation below 1.2091 and intraday bias remains neutral first. Overall, outlook remains bullish as long as 1.1822 support holds. Above 1.2091 will extend larger rise from 1.0339 and target next key fibonacci level at 1.2516. But considering bearish divergence condition in 4 hour MACD, break of 1.1822 will confirm short term topping and bring deeper fall back to 1.1661 support and below.
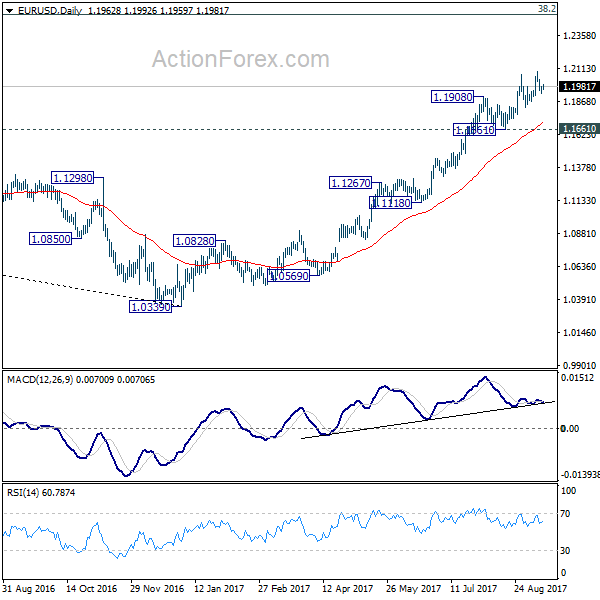
In the bigger picture, rise from medium term bottom at 1.0339 is still in progress for 38.2% retracement of 1.6039 (2008 high) to 1.0339 (2017 low) at 1.2516. However, it should be noted that there is no confirmation of trend reversal yet. That is, such rebound from 1.0399 could be a correction. And the long term fall fro 1.6039 (2008 high) could resume. Hence, we'd be cautious on strong resistance from 1.2516 to limit upside. But after all, break of 1.1661 is needed to indicate medium term topping. Otherwise, outlook will remain bullish in case of pull back.
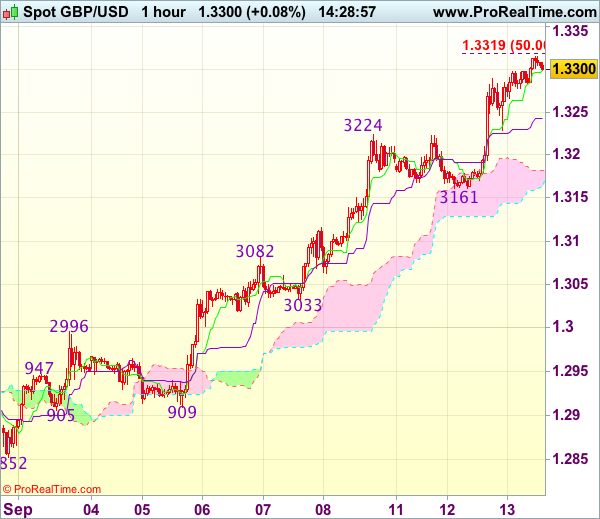
GBP/USD Daily Outlook
Daily Pivots: (S1) 1.3193; (P) 1.3245; (R1) 1.3334; More...
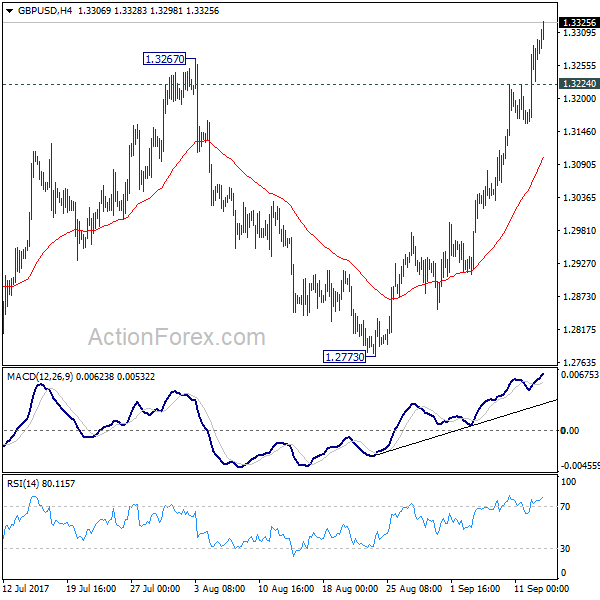
GBP/USD rises to as high as 1.3327 so far as recent rally continues. Intraday bias remains on the upside for 1.3444 key resistance next. At this point, we'd maintain that price actions from 1.1946 are still seen as a corrective pattern. Hence, we'd expect strong resistance from 1.3444 to limit upside to bring larger down trend reversal eventually. On the downside below, 1.3224 minor support will turn intraday bias neutral again. However, firm break of 1.3444 will carry larger bullish implication and target 1.3835/5016 resistance first zone first.
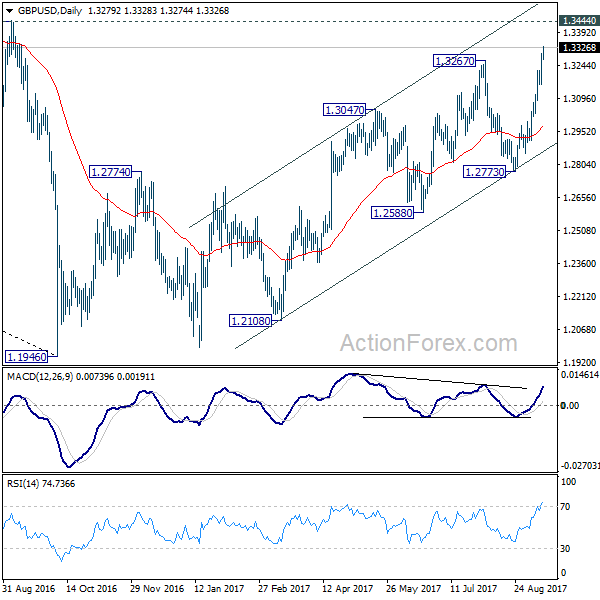
In the bigger picture, overall, price actions from 1.1946 medium term low are seen as a corrective pattern. While further rise cannot be ruled out, larger outlook remains bearish as long as 1.3444 key resistance holds. Down trend from 1.7190 (2014 high) is expected to resume later after the correction completes. And break of 1.2773 support will be the first sign that such down trend is resuming. However, considering bullish convergence condition in monthly MACD, firm break of 1.3444 will argue that whole down trend from 2.1161 (2007) has completed. And stronger rise would be seen back to 38.2% retracement of 2.1161 to 1.1946 at 1.5466.
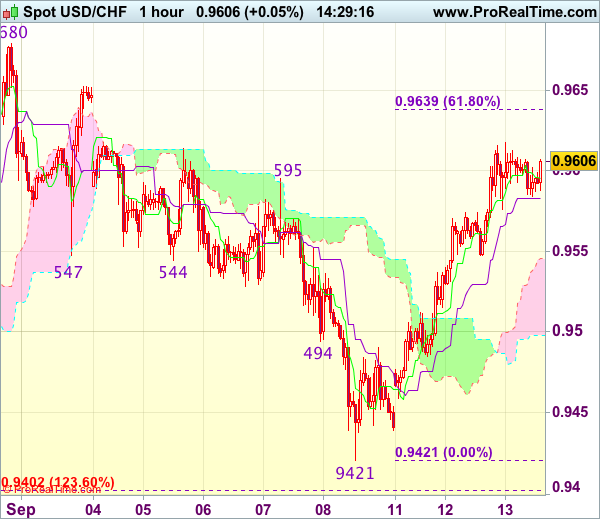
Trade Idea : USD/CHF – Buy at 0.9540
USD/CHF - 0.9596
Most recent candlesticks pattern : N/A
Trend : Near term up
Tenkan-Sen level : 0.9597
Kijun-Sen level : 0.9583
Ichimoku cloud top : 0.9545
Ichimoku cloud bottom : 0.9498
Original strategy :
Buy at 0.9540, Target: 0.9640, Stop: 0.9505
Position : -
Target : -
Stop : -
New strategy :
Buy at 0.9540, Target: 0.9640, Stop: 0.9505
Position : -
Target : -
Stop : -
The greenback has maintained a firm undertone after staging a strong rebound yesterday, the breach of previous resistance at 0.9595 adds credence to our view that low has been formed at 0.9421 and consolidation with upside bias remains for further gain to 0.9635-40 (61.8% Fibonacci retracement of 0.9773-0.9421), however, near term overbought condition would limit upside to 0.9680 and reckon resistance at 0.9698-99 would remain intact.
In view of this, we are looking to reinstate long on dips as 0.9550-55 should limit downside and bring another upmove later. Below 0.9525-30 would defer and risk correction to 0.9500 but downside should be limited and 0.9450-60 would remain intact, bring another rebound later.
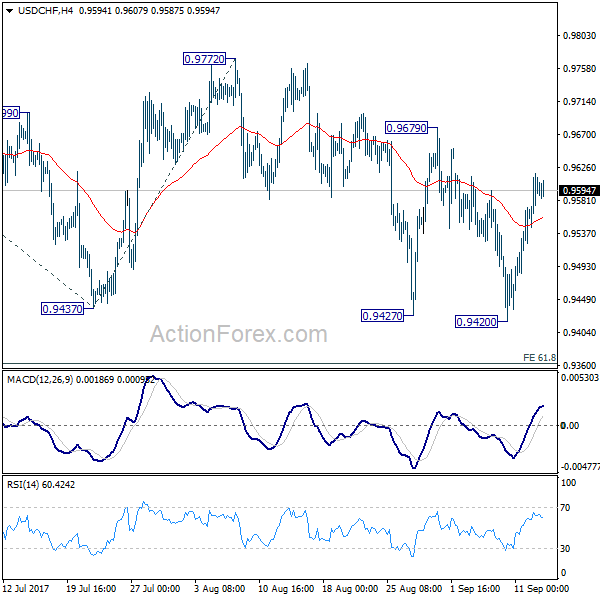
USD/CHF Daily Outlook
Daily Pivots: (S1) 0.9554; (P) 0.9586; (R1) 0.9631; More....
Rebound from 0.9420 is quite strong. But still, with 0.9679 resistance intact, outlook stays bearish. Another fall is still expected. Sustained break of 0.9420 will target 61.8% projection of 1.0099 to 0.9437 from 0.9772 at 0.9363 first. Break will target 100% projection at 0.9110 next. However, break of 0.9679 will indicate near term reversal and turn bias to the upside for 0.9772 resistance for confirmation.
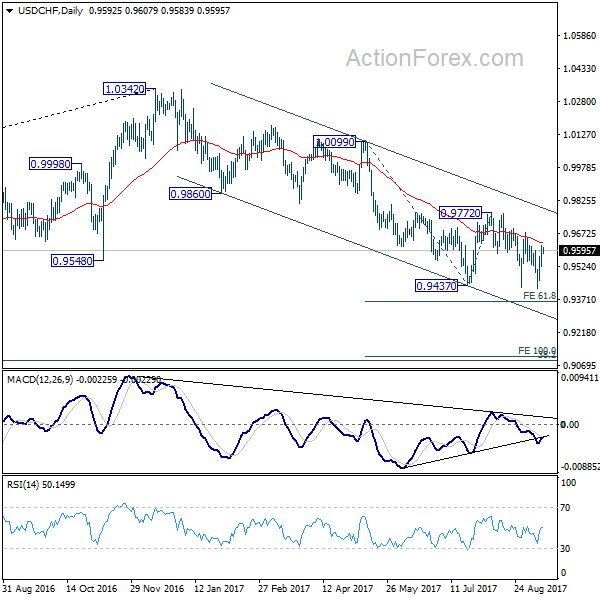
In the bigger picture, current development suggests that 0.9443 key support (2016 low) could be taken out firmly as down trend form 1.0342 extends. There are various interpretation of the price actions. But in any case, medium term outlook will stay bearish as long as 0.9772 resistance holds. Current down trend could extend to 38.2% retracement of 0.7065 (2011 low) to 1.0342 (2016 high) at 0.9090. However, break of 0.9772 will indicate that USD/CHF has successfully defended 0.9443 again and turn outlook bullish for 1.0099 resistance.
Why 0.7320 Is Significant For Kiwi Dollar?
Key Highlights
- The New Zealand Dollar is trading with a positive bias, but faces a major resistance near 0.7320 against the US Dollar.
- There are two bearish trend lines with resistance near 0.7320 formed on the 4-hours chart of NZD/USD.
- New Zealand Food Price Index in August 2017 rose 0.6%, compared with the last -0.2%.
- The US Producer Price Index for August 2017 will be released today, which is forecasted to increase by 0.3% (MoM).
NZDUSD Technical Analysis
The New Zealand Dollar recovered well from the August 2017 low of 0.7130 against the US Dollar. The NZD/USD pair is currently in the bullish zone, but faces a crucial resistance near 0.7320.
The pair already attempted twice to settle above the 0.7320-0.7340 resistance levels, but failed. There are two bearish trend lines with resistance near 0.7320 formed on the 4-hours chart. These trend lines along with the 200 simple moving average (H4) are protecting an upside break.
On the downside, there are two bullish trend lines near 0.7270 and 0.7240. Moreover, the 100 simple moving average (H4) is at 0.7230 to act as a major support.
Overall, it seems like the pair is well supported on the downside between 0.7270-0.7220. Having said that, the pair needs to break the 0.7320-0.7340 to gain further upside momentum.
New Zealand Food Price Index
Today in New Zealand, the Food Price Index (FPI) for August 2017 was released by the Statistics New Zealand. The forecast was slated for a minor rise of 0.1% compared with the previous month.
However, the actual result was above the forecast, as the FPI posted an increase of 0.6%, compared with the last -0.2%. There was a sharp rise in Butter prices in August 2017 by 11% to a new high of $5.39 a block.
Commenting on the data, the consumer's price index manager, Matthew Haigh, stated:
We have seen butter prices rising lately due to New Zealand's export driven market. Butter prices have experienced all-time highs in the global market, and this also drives the price here at home.
To sum up, the NZD/USD pair remains elevated, but it won't be easy for buyers to clear strong offers near 0.7320 and 0.7340.
Trade Idea : GBP/USD – Buy at 1.3230
GBP/USD - 1.3309
Most recent candlesticks pattern : N/A
Trend : Near term up
Tenkan-Sen level : 1.3299
Kijun-Sen level : 1.3243
Ichimoku cloud top : 1.3182
Ichimoku cloud bottom : 1.3174
Original strategy :
Buy at 1.3175, Target: 1.3275, Stop: 1.3140
Position : -
Target : -
Stop : -
New strategy :
Buy at 1.3230, Target: 1.3330, Stop: 1.3195
Position : -
Target : -
Stop : -
As cable has continued moving higher after yesterday’s rally above resistance at 1.3269, adding credence to our bullish view that medium term upmove has resumed and upside bias remains for further gain to 1.3355-60 (61.8% projection of 1.2909-1.3224 measuring from 1.3161), however, loss of near term upward momentum should prevent sharp move beyond there and reckon 1.3390-00 would hold from here, risk from there has increased for a retreat to take place later.
In view of this, would not chase this rise at current level and would be prudent to buy cable on subsequent pullback as previous resistance at 1.3224 (now support) should limit downside and bring another upmove. Below 1.3200 would defer and risk correction towards support at 1.3161 which is likely to hold from here.