Sample Category Title
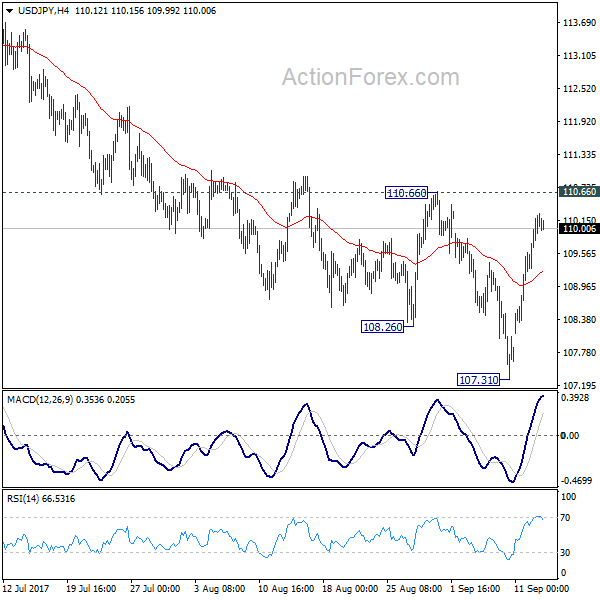
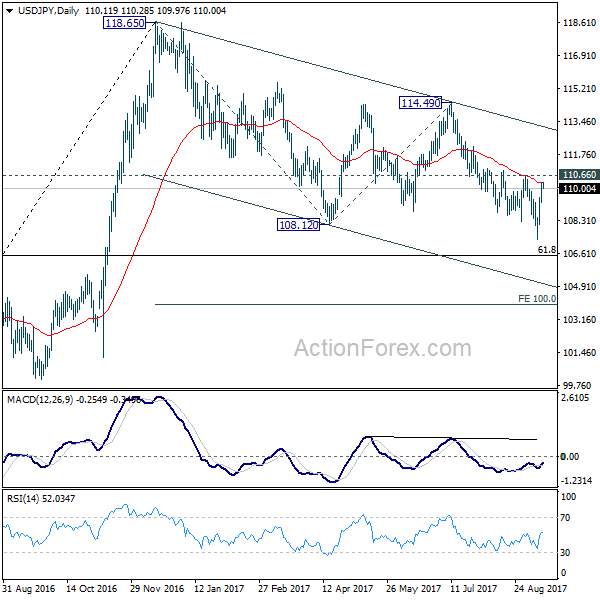
USD/JPY Daily Outlook
Daily Pivots: (S1) 109.51; (P) 109.88; (R1) 110.53; More...
Outlook in USD/JPY remains unchanged. While the rebound from 107.31 is strong, it's limited below 110.66 resistance so far. Outlook stays bearish and another fall is still expected. Break of 107.31 will extend the whole fall from 118.65 to 61.8% retracement of 98.97 to 118.65 at 106.48 first. We'd look for support from there to bring rebound. But firm break of 106.48 will extend the decline to 100% projection of 118.65 to 108.12 from 114.49 at 103.96 or below. On the upside, firm break of 110.66 will confirm short term bottoming and turn bias back to the upside.
In the bigger picture, rise from 98.97 (2016 low) is now seen as the second leg of the corrective pattern from 125.85 (2015 high). It's unclear whether this this second leg has completed at 118.65 or not. But medium term outlook will be mildly bearish as long as 114.49 resistance holds. And, there is prospect of breaking 98.97 ahead. Meanwhile, break of 114.49 will bring retest of 125.85 high. But even in that case, we don't expect a break there on first attempt.
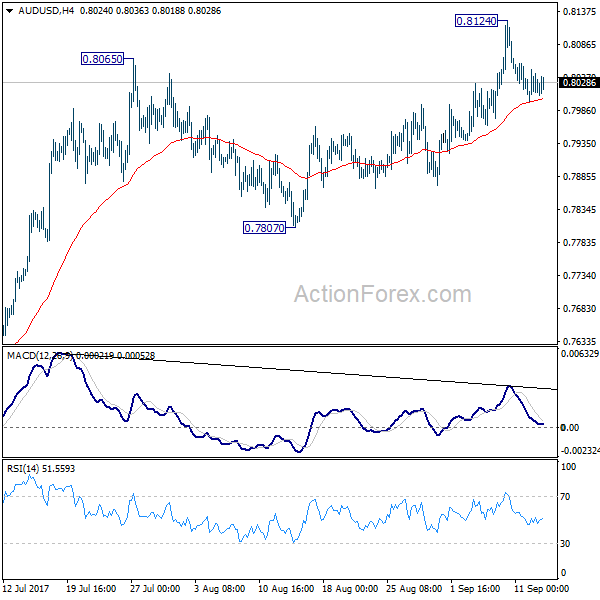
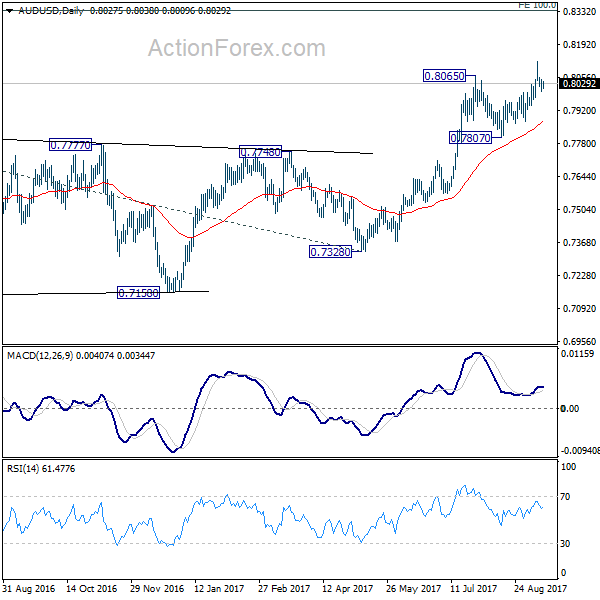
AUD/USD Daily Outlook
Daily Pivots: (S1) 0.7995; (P) 0.8022; (R1) 0.8045; More...
AUD/USD's staying in consolidation below 0.8124 temporary top. Intraday bias remains neutral for more corrective trading. . Overall, as long as 0.7807 support holds, near term outlook remains bullish for further rally. Above 0.8124 will target 100% projection of 0.6826 to 0.7833 from 0.7328 at 0.8335 next. However, considering bearish divergence condition in 4 hour MACD, firm break of 0.7807 will indicate near term reversal and turn bias back to the downside for 0.7328 key support.
In the bigger picture, rise from 0.6826 medium term bottom is still in progress. At this point, there is no confirmation of trend reversal yet and we'll continue to treat such rebound as a corrective pattern. But in any case, break of 55 month EMA (now at 0.8090) will target 38.2% retracement of 1.1079 to 0.6826 at 0.8451. Break of 0.7807 support is needed to to be the first sign of completion of the rebound. Otherwise, further rise is now in favor.
US Equities At Record Levels
US equities closed at record levels on Wednesday, as improved risk-on sentiment returned to the markets and news that the US economy will benefit if the US tax reform is passed. US Treasury Secretary Mnuchin stated on Tuesday that “tax reform could be backdated to January 1st, 2017 as it would be a “big boon for the economy.” He also commented that the Trump administration was “super focused” on ensuring tax reform would be completed by the end of the year. Such comments helped the supported rise in US Treasury Yields.
On Wednesday, Asian equity markets reached a 10-year high, although the markets remain cautious that geo-political tensions between North Korea and the US could escalate following President Trump’s comments that the recent UN sanctions against North Korea were a “very small step” and “nothing compared to what ultimately will have to happen” to deal with North Koreas’ nuclear program. Following the recent sanctions, North Korea has vowed to redouble its efforts to fight of the threat of a US invasion. With continued rhetoric, markets will remain on edge and will ultimately look to safe havens.
UK Consumer Price Index was released on Tuesday, showing increasing UK inflation rising to 2.9% (YoY) in August. GBPUSD reached a 1 year high on the news. Inflation above the Bank of England’s target of 2% has been complicating why policy makers are not raising UK interest rates. With a Bank of England Policy meeting being held on Thursday, the markets are looking for clues as to the likely timing of rate hikes.
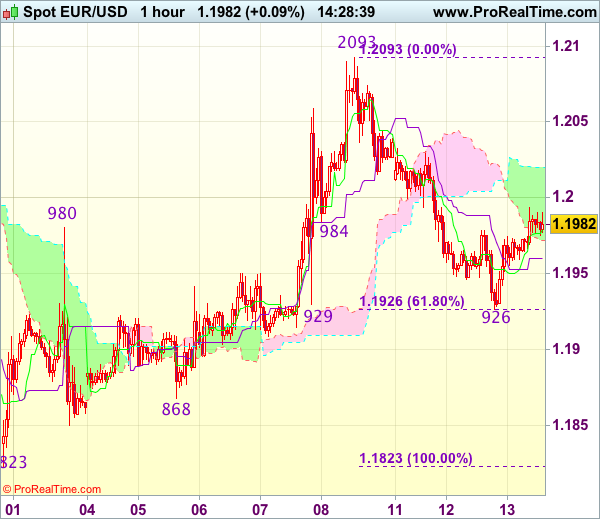
EURUSD edged higher overnight to currently trade around 1.1980.
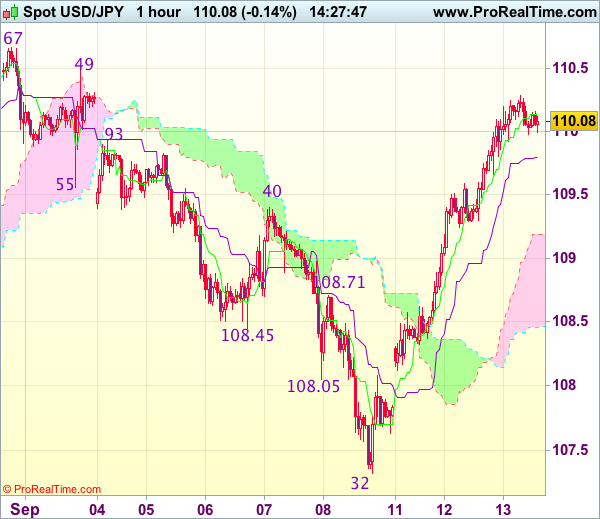
USDJPY moved higher with improved risk-on sentiment. Currently, USDJPY is trading around 110.15.
GBPUSD benefitted from, higher than expected, UK inflation data. Currently, GBPUSD is trading around 1.3300.
Gold lost ground against USD and currently trades around $1,330.
WTI was trading in a narrow range ahead of today’s EIA report. Currently, WTI is trading around $48.70.
The major economic data releases for today will be:
At 13:30 BST, the Bureau of Labor statistics, Department of Labor will release Producer Price Index (MoM) for August. As a clear indicator of commodity inflation, this release could potentially help the Federal Reserve in its plans for a further rate hike this year if the release comes in strongly. The previous release, of -0.1% is expected to be bettered with the consensus calling for an increase to 0.3%. If the release is wildly different from the consensus we can expect USD volatility.
At 15:30, the Energy Information Administration will release Crude Oil Stocks change for September 4th. The impact of Hurricane Harvey is still being felt in the US, so markets will be eager to see if the consensus comes in at 2.285M (from the previous 4.580M). Expect Oil to see volatility if the released number is significantly different than the consensus.
Trade Idea : EUR/USD – Stand aside
EUR/USD - 1.1981
Most recent candlesticks pattern : N/A
Trend : Up
Tenkan-Sen level : 1.1979
Kijun-Sen level : 1.1960
Ichimoku cloud top : 1.2020
Ichimoku cloud bottom : 1.1972
New strategy :
Stand aside
Position : -
Target : -
Stop : -
As the single currency has rebounded after falling to 1.1926 (exactly 61.8% Fibonacci retracement of 1.1823-1.2093), suggesting consolidation above this level would be seen and recovery to 1.2000 cannot be ruled out, however, reckon the upper Kumo (now at 1.2020) would limit upside and bring another decline. Below said support at 1.19256 would extend the fall from 1.2093 top to 1.1900 but loss of near term downward momentum should prevent sharp fall below previous support at 1.1868 and price should stay well above another previous support at 1.1823, bring rebound later.
In view of this, would not chase this fall here and would be prudent to stand aside in the meantime. Above 1.2020-30 (current level of the upper Kumo and previous resistance) would suggest the fall from 1.2093 has ended and bring a stronger rebound to 1.2050-60 but reckon upside would be limited to 1.2070, bring another decline.
Trade Idea : USD/JPY – Buy at 109.30
USD/JPY - 110.09
Most recent candlesticks pattern : N/A
Trend : Down
Tenkan-Sen level : 110.14
Kijun-Sen level : 109.80
Ichimoku cloud top : 108.19
Ichimoku cloud bottom : 108.46
Original strategy :
Buy at 109.00, Target: 110.20, Stop: 108.65
Position : -
Target : -
Stop : -
New strategy :
Buy at 109.30, Target: 110.30, Stop: 108.95
Position : -
Target : -
Stop : -
As the greenback has maintained a firm undertone after this week’s rally, adding credence to our view that low has been formed at 107.32 last week and mild upside bias remains for the rise from there to extend further gain towards resistance at 110.49, however, near term overbought condition should limit upside to another previous resistance at 110.67 and price should falter below 111.00, risk from there has increased for a retreat to take place soon.
In view of this, would not chase this rise here and would be prudent to buy dollar on subsequent pullback as 109.25-30 should limit downside. Below 109.00 would defer and risk correction to 108.70 but still reckon downside would be limited to 108.30-35 and bring another rally later.
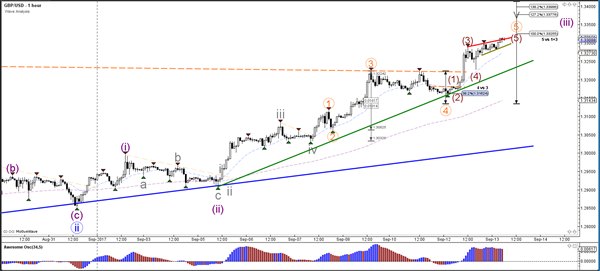
Daily Technical Analysis: GBP/USD Breaks All Resistance Levels With Wave-3 Momentum
Currency pair GBP/USD
The GBP/USD has broken above the resistance trend line (dotted orange) and previous top and is confirming its bullish momentum within waves 3 (purple and blue). A continuation of the bullish momentum seems likely even if a larger correction takes place, because that could be the wave 4 (purple) pullback.
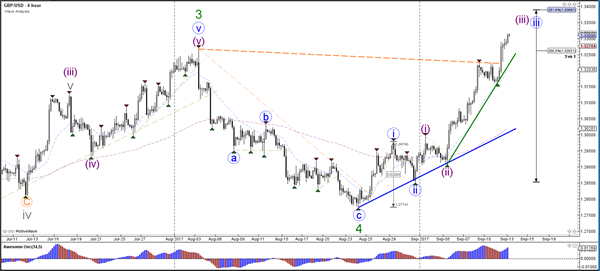
The GBP/USD is extending the bullish momentum higher and seems to be finishing waves 5 within wave 3 (purple). Eventually price could start a larger wave 4 (purple) pullback.
Currency pair EUR/USD
The EUR/USD could have completed the wave C (red) of wave 4 (blue) at the support trend line (blue) and 61.8% Fibonacci level of wave C vs A. This could be a potential bouncing spot for a continuation of wave 5 but wave C could extend lower if price breaks below the support line.
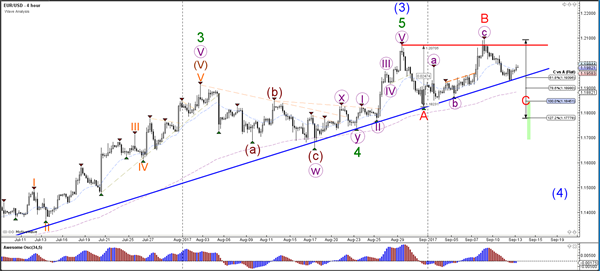
The EUR/USD seems to have completed 5 bearish waves and has broken above the resistance trend line (dotted red) which could indicate a potential bullish breakout via a wave 1-2 (purple).

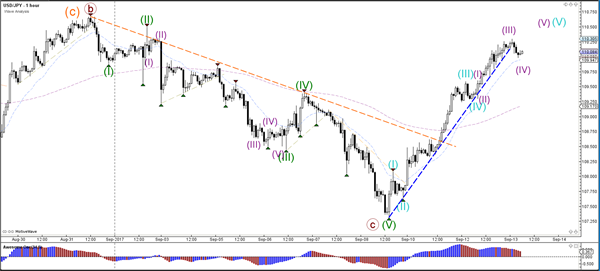
Currency pair USD/JPY
The USD/JPY bullish momentum has reached a strong resistance trend line (brown). A bearish bounce could happen here as price completes perhaps a wave 1 (brown).
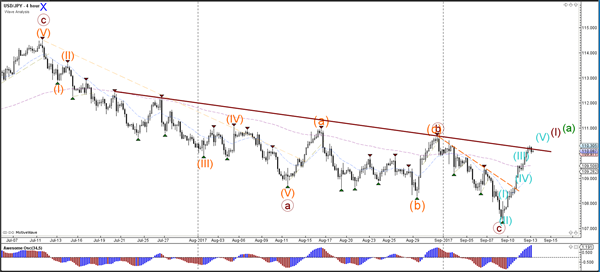
The USD/JPY is showing strong bullish momentum and seems to have built 5 waves (blue). Within wave 5 there seems to be an extension with another 5 waves (purple).
EUR/GBP Retesting Previous Daily Resistance Zone As Support
As price moves back down to retest a major zone, today’s in-play chart is EUR/GBP. But before we move onto today’s level, I want to make sure that we’re up to date with the unfolding narrative in the pair.
Each of the EUR/GBP levels that I’ve blogged about recently have all had an effect on how we got here. The way that price has stepped and reversed has been almost textbook technical behaviour and is worth a look. Go through and click each of the links to our previous EUR/GBP blogs and if you haven’t already been following along, take a look at how we got here.
First up, EUR/GBP printed a doji at resistance. As we discussed at the time, this isn’t necessarily a reversal candle, but simply indecision. But as price action unfolded, it turned out to very much be the signal that the sellers were looking for, selling each rally back into previous short term support turned resistance:
EUR/GBP Hourly:
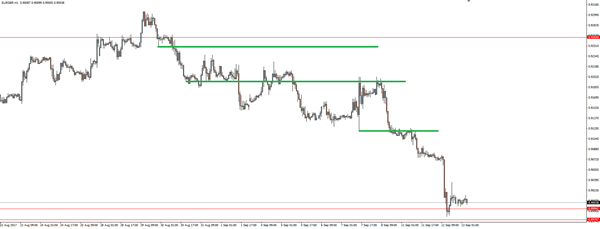
As there weren’t any pullbacks, no matter where you were shorting the level, you really couldn’t have gone wrong… But the green lines I’ve drawn on seem to be the obvious short term support turned resistance that were sold.
So from here, price continued all the way down until settling back at the previous daily swing high resistance zone that is now conventiently looking to be turning to support:
EUR/GBP Daily:
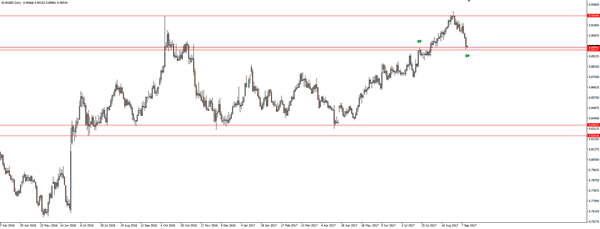
As always in my trading, this zone is support until it is broken and therefore my bias is to be fading the level. Look for the same patterns (but inverted) as the first daily chart where in this case we’d have short term resistance being turned to support where we’d buy.
Whichever way price decides to go at this zone, this is now the EUR/GBP level that we’ll look to manage our risk around.
Market Update – Asian Session: Equities And Currencies Muted, Awaiting Notable Data Tomorrow
Asia Summary
Asian equity markets opened mixed, trading remained subdued with yields falling slightly and US dollar taking a break from its recent climb. Lithium miners in Australia, Syrah Resources, Galaxy Resources rose on the news yesterday that China could accelerate its move to non-fossil fuel burning cars. Iron ore futures on China's Dalian exchange were +2%. Crude saw little movement from the release of API data, showing a build of 6.2M.
PBOC weakened the yuan for the second consecutive day and returned to its use of 7, 14 and 28 day reverse repos. Markets look ahead to tomorrow's release of China's August industrial production and fixed asset investments and Australia's employment data. The offshore yuan overnight HIBOR was +95bps to 3.05 while the 1-week rose 66bps to 3.51%.
The kiwi fell 0.4% after a report that New Zealand National Intelligence Agency has started probe of China-born parliament member Jian Yang. Yang is in the ruling National Party; The report says the probe focuses on the time that Yang spent at military colleges in China. This could be trouble heading into elections for the ruling party.
Key economic data
(JP) JAPAN AUG PPI M/M: 0.0% V 0.1%E; Y/Y: 2.9% V 3.0%E
(JP) JAPAN Q3 BSI LARGE ALL INDUSTRY Q/Q: 5.1 V -2 PRIOR; BSI LARGE MANUFACTURING Q/Q: 9.4 V 5.0E
(AU) Australia Sept Westpac Consumer Confidence Index: 97.9 v 95.5 prior, Consumer Confidence M/M: +2.5% v -1.2% prior
Speakers and Press
China/Hong Kong
(CN) China FX Regulator SAFE: No changes to foreign currency cash withdrawal rule
(CN) President Trump has warned China to get tough on North Korea and reduce trade and financial transactions or it will target Chinese banks - FT
Korea
(KR) North Korea rejects UN adding new sanctions; to establish 'practical equilibrium' with the US; will redouble efforts to increase its strength – KCNA
(KR) Bank of Korea (BOK) Gov Lee: FX swap with China not on agenda for meeting
(KR) South Korea Nuclear Safety and Security Commission: traces of radioactive xenon gas were confirmed to be from a North Korean nuclear test earlier this month, but it was unable to conclude whether the test had been for a hydrogen bomb
Japan
(JP) Japan to start watching virtual currency exchange markets from Oct - Nikkei
Australia
(AU) RBA's Harper: Currency gains being driven by weaker USD; economic growth is too weak to justify a rate hike; AUD -0.2% on the comments before returning to +0.1%
Asian Equity Indices/Futures (00:00ET)
Nikkei +0.5%, Hang Seng -0.3%; Shanghai Composite -0.1%, ASX200 +0.2%, Kospi +0.2%
Equity Futures: S&P500 -0.1%; Nasdaq100 -0.1%, Dax -0.1%, FTSE100 -0.1%
FX ranges/Commodities/Fixed Income (00:00ET)
EUR 1.1993-1.1964; JPY 110.29-109.98; AUD 0.8039-0.8011; NZD 0.7298-0.7257
Dec Gold +0.2% at $1,335/oz; Oct Crude Oil 0.0% at $48.24/brl; Sept Copper -0.3% at $3.03/lb
GLD SPDR Gold Trust ETF daily holdings +0.4% to 838.6 metric tonnes
USD/CNY *(CN) PBOC SETS YUAN REFERENCE RATE AT: 6.5382 V 6.5277 PRIOR (2nd straight weaker yuan fix)
(CN) PBOC injects combined CNY70B in 7,14 and 28-day reverse repos v skipped prior
(AU) Australia sells A$900M in Nov 2028 bonds, avg yield 2.7414%, bid to cover 4.03x
USD/PHP Philippines Central Bank (BSP) spent PHP5B over the last 2 months defending the peso
Equities notable movers
Australia/New Zealand
SEA.AU Reports H1 (A$) Net loss 5.7M v loss 20.1M y/y; Rev 44.5M v 24.2M y/y; +5%
OIC.NZ WSP NZ raises offer to NZ$1.85/shr; Board unanimously recommends offer; +6.8%
Hong Kong/China
2020.HK UBS Raised 2020.HK to Buy from Neutral; +6.4%
066570.KR To showcase car components at German motor show; +4.6%
Japan
6502.JP Board resolved to sign MOU with Bain for chip unit; targeting final decision on board meeting next week - Nikkei; +0.3%
In The UK, The Labour Market Report For July Is due
Market movers today
In the euro area, the employment figure for Q2 is due for release on Wednesday. We estimate the improvement in the labour market continued in Q2, which has been indicated by strong PMI employment indicators throughout the quarter. Specifically, we expect employment growth of 0.4% q/q in Q2.
Today also brings data on euro area industrial production in July. We expect a small rebound in the euro area but based on the unchanged German figure in July, it should be modest. We expect the euro area figure to report 0.2% monthly growth.
In the UK, the labour market report for July is due. We expect the annual growth rate in average weekly earnings excluding bonuses (3 month average) was unchanged at 2.1% y/y but see a risk of a further decline in the unemployment rate to 4.3% from 4.4%.
Selected market news
Asian shares reached a 10-year high this morning, while the rise in USD/JPY helped boost Japanese shares. Similar record highs were reached on Wall Street yesterday, as investor concerns faded about the impact of Hurricane Irma as well as North Korean tensions, despite President Trump's demands yesterday to toughen sanctions further.
In the US, Treasury Secretary Steven Mnuchin expressed doubt on Trump's goal of cutting the corporate tax rate to 15%, citing budget issues, despite the recent deal reached on the postponement of the debt limit (see Flash Comment US: Debt limit fight postponed amid increased Fed uncertainty, 7 September). The administration is currently trying to build public support for the tax reforms, also with the Democrats. Mnuchin said he hoped that a tax plan could be enacted this year, but we still think that Republicans' will struggle to agree on tax reforms internally, as the very conservative Republicans want big tax cuts financed by big fiscal spending cuts, which more moderate Republicans cannot support. Yesterday, we also got news that Trump plans to visit China in November. We do not yet know what the topics for the visit will be, but markets will focus on trade issues and North Korea.
After Monday's inflation disappointment in Norway, yesterday's Q3 Regional Network Survey was also weaker than expected, with the aggregated output index falling to 1.11 from 1.29. With low inflation, strong NOK versus Norges Bank's forecast, a cooling housing market and lower global rates, Norges Bank could easily extend the on-hold stance at its meeting next week in our view.
In France, around 223,000 protesters marched yesterday against the government's new labour reform unveiled on 31 August. The reform included a cap on payouts for unfair dismissals and greater flexibility for companies to negotiate pay and hours. Labour unions have scuppered previous efforts to weaken France's labour code, but this time there was comfort for Macron as two other unions, including the largest CFDT, declined to join the protests. Macron is determined to move on with his reforms despite a rapid decline in approval ratings (36% in August), with a reform of the unemployment benefit scheme in 2018 next on his agenda.
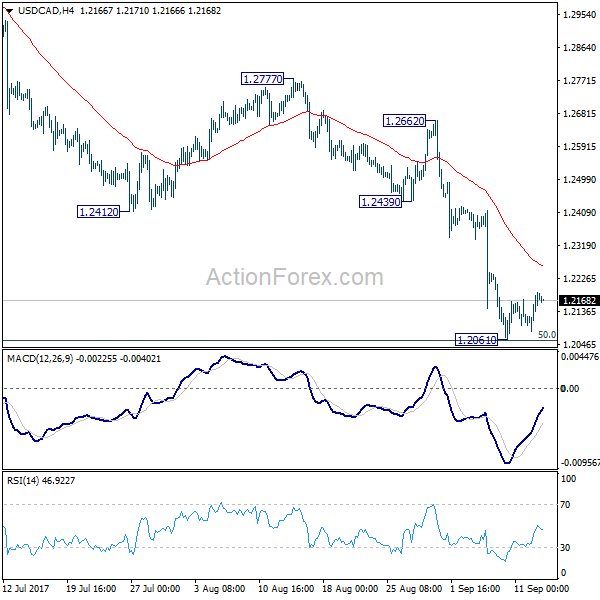
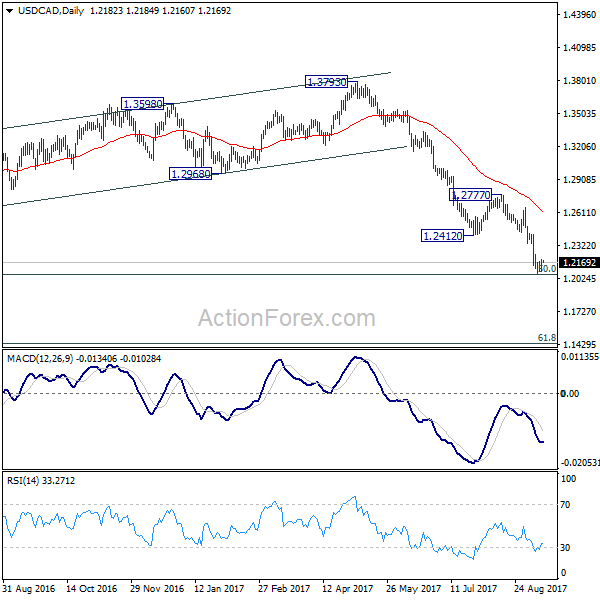
USD/CAD Daily Outlook
Daily Pivots: (S1) 1.2114; (P) 1.2152; (R1) 1.2222; More....
Intraday bias in USD/CAD remains neutral as consolidation from 1.2061 temporary low continues. We'll stay cautious on strong support from 1.2048 long term fibonacci level to bring sustainable rebound. But still, break of 1.2412 support turned resistance is needed to be the first sign of trend reversal. Otherwise, outlook will remain bearish. Firm break of 1.2048 will pave the way to next fibonacci level at 1.1424.
In the bigger picture, current downside acceleration is raising the chance that whole long term rise from 0.9406 (2011 low), and that from 0.9056 (2007 low) is completed at 1.4689. Focus is now on 50% retracement of 0.9406 to 1.4869 at 1.2048. As long as this level holds, we'd still favor that case that fall from 1.4689 is a correction. However, firm break of 1.2048 will indicate that fall fro 1.4689 is at least a medium term down trend and should target 61.8% retracement at 1.1424 and below.