Sample Category Title
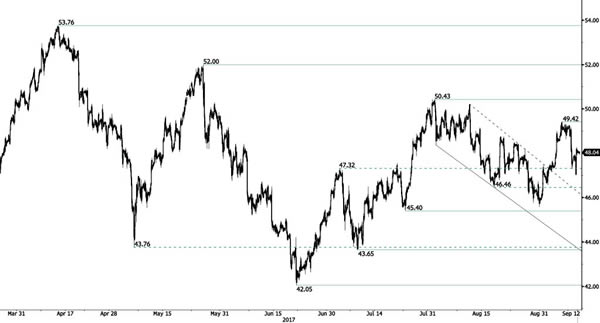
CRUDE OIL Sharp Decline
Crude oil has strongly declined after the commodity monitored the $50 level. Key support is given at 45.40 (17/08/2017 high). Strong resistance can be found at 50.43 (31/07/2017). Expected to show continued short-term bearish move.
In the long-term, crude oil has recovered after its sharp decline last year. However, we consider that further weakness are very likely. Strong support lies at 35.24 (05/04/2016) while resistance can now be found at 55.24 (03/01/2017 high).
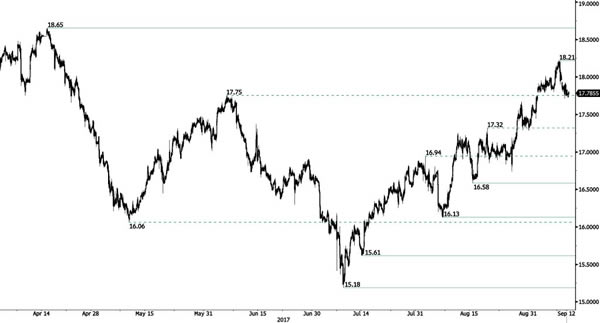
SILVER Profit-Taking
Silver has failed to reach strong resistance at 18.65 (17/04/2017 high) while support can be found at 16.58 (15/08/2017 high). The commodity lies in an uptrend channel. Expected to show another leg higher.
In the long-term, the trend is rater negative. Further downsides are very likely. Resistance is located at 25.11 (28/08/2013 high). Strong support can be found at 11.75 (20/04/2009).
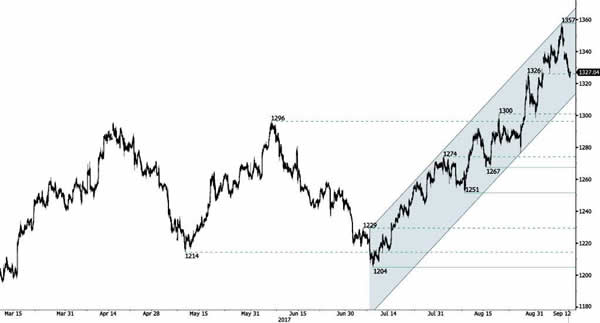
GOLD Consolidating Within Uptrend Channel
Gold has seen increased buying interest, clearing rising trend-line. Hourly support is given at a distance 1326 (gap low). Key resistance is located at 1375 (06/07/2016). Stronger support lies at 1204 (10/07/2017 high). Expected to show continued increase.
In the long-term, the technical structure suggests that there is a growing upside momentum. A break of 1392 (17/03/2014) is necessary ton confirm it, A major support can be found at 1045 (05/02/2010 low).
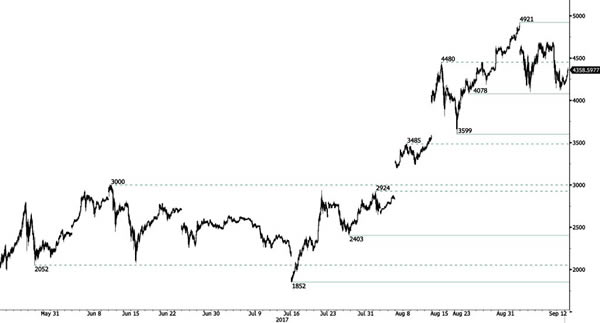
BITCOIN Renewed Buying Pressures
Bitcoin's buying interest is getting stronger again.Technical picture remain bullish as long as key support hold. Monitor the key support at 4078. Strong support lies very far at 3599 (22/08/2017 low). Key resistance can be located at 4921 (01/09/2017 high).
In the long-term, the digital currency has had an exponential growth. There are decent likelihood that the asset will reach $10'000.
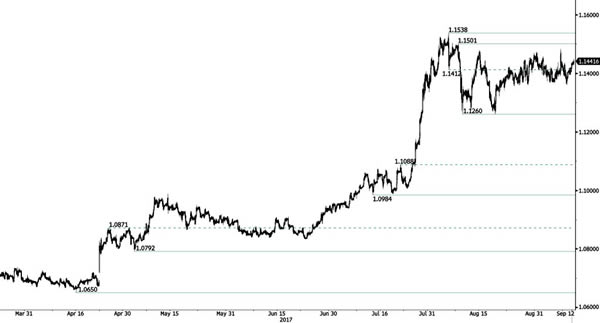
EUR/CHF Further Sideways Consolidation Likely
EUR/CHF has sharply declined near the resistance area between 1.1356 and 1.1472 Further medium-term sideways moves are favoured. Expected to show further sideways moves.
In the longer term, the technical structure has reversed. Strong resistance is given at 1.20 (level before the unpeg). Yet, the ECB's QE programme is likely to cause persistent selling pressures on the euro, which should weigh on EUR/CHF. Supports can be found at 1.0184 (28/01/2015 low) and 1.0082 (27/01/2015 low).
GBP/JPY Elliott Wave Analysis
GBP/JPY – 143.80
The British pound found good support at 141.20 and has rallied from there since, dampening our bearishness and suggesting the fall from 147.75 has ended at 139.35 instead, hence upside bias is seen for this move to extend further gain to 146.00 and later towards resistance at 146.80, however, break of latter level is needed to signal the correction from 147.75 has ended and bring further subsequent rise to 147.30-40, then retest of this recent high which is likely to hold on first testing.
Our preferred count is that larger degree wave V with circle is unfolding from 251.12 with wave (I) 219.34, (II): 241.38 and wave (III) is subdivided into 1: 192.60, 2: 215.89 (23 Jul 2008) and wave 3 ended at 118.87 earlier in 2009. The correction from there to 162.60 is wave 4 which itself is a double three and is labeled as first a-b-c ended at 151.53, followed by wave x at 139.03, 2nd a ended at 162.60, 2nd b at 146.75 and 2nd c leg of wave 4 ended at 163.00. Therefore, the decline from 163.00 to 116.85 is now treated as wave 5 which also marked the end of larger degree wave (III), hence wave (IV) major correction has commenced for retracement of the wave (III) from 241.38 and upside target at 183.95-00 (50% Fibonacci retracement of the wave (II) from 241.38) had been met, a drop below 160.00 would suggest wave (IV) has ended at 195.85, bring decline in wave (V) for initial weakness to 130 (already met) and 120.
On the downside, whilst pullback to 145.00 cannot be ruled out, reckon 144.50-60 would limit downside and bring another rise later. Below 144.00 would defer and risk weakness to 143.00 but only break of previous resistance at 143.00 (tentatively wave i top) would defer and risk weakness to 142.45-50, having said that, still reckon downside would be limited to 142.00 and support at 141.20 should remain intact, bring another rebound later.
Recommendation: Buy at 144.70 for 146.70 with stop below 143.70.

The long-term downtrend from 570.99 (29 Feb 1980) is labeled as an impulsive wave with III with circle ended at 129.77 (20 Apr 1995) and the corrective rebound to 251.12 (20 Jul 2007) is treated as wave IV with circle and the wave V with circle selloff from 251.12 has possibly ended at 116.80 (almost reached our indicated target at 116.00) and major correction has commenced from there and indicated upside target at 183.90-00 (50% Fibonacci retracement of 251.10-116.85) had been met, reckon upside would be limited to 199.80-90 (61.8% Fibonacci retracement) and bring wave (V) decline in later part of 2017.

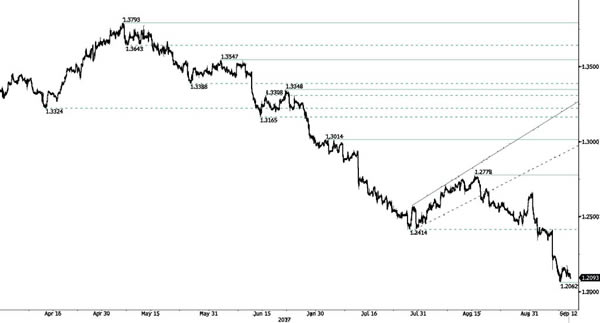
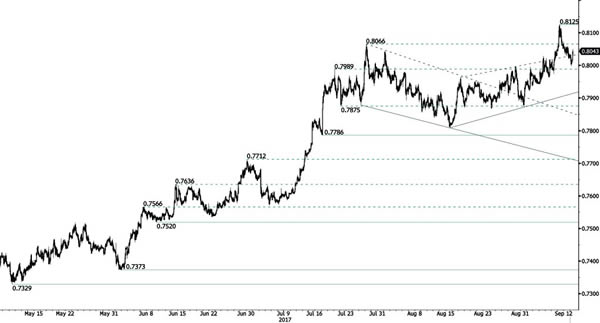
EUR/GBP Heading Lower
EUR/GBP is trading lower. However, as long as prices remain below the resistance at 0.9176 (declining trendline), the short-term technical structure is biased to the downside. Hourly support is given at 0.9095 (11/09/2017). Resistance lies at 0.9306 (29/07/2017 high).
In the long-term, the pair has largely recovered from recent lows in 2015. The technical structure suggests a growing upside momentum. The pair is trading above from its 200 DMA. Strong resistance can be found at 0.9500 (psychological level).
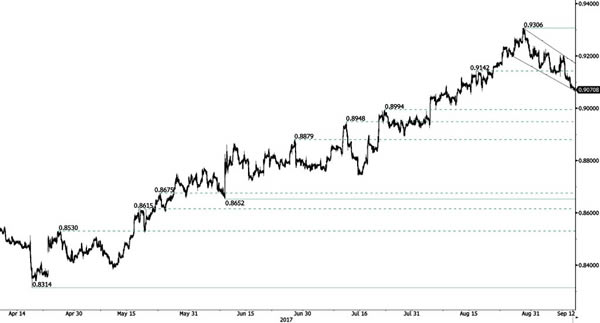
AUD/USD Bearish Consolidation Is Not Over
AUD/USD is consolidating lower after the pair surged towards 0.8125 (08/09/2017 high). Hourly support can be found at 0.8029 (intraday high). Key resistance is given at 0.8164 (14/05/2015 high). Expected to further consolidate.
In the long-term, the trend is largely negative since 2011. Key supports stands at 0.6009 (31/10/2008 low) . A break of the key resistance at 0.8295 (15/01/2015 high) is needed to invalidate our long-term bearish view.
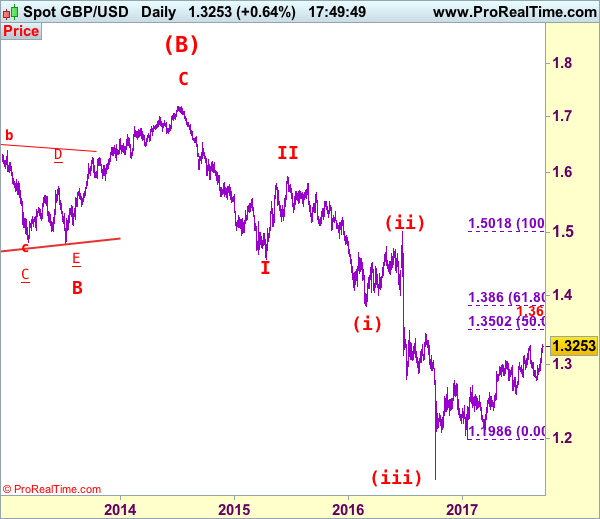
GBP/USD Elliott Wave Analysis
GBP/USD – 1.3262
Sterling continued heading north and broke above recent high at 1.3269, confirming the medium term erratic rise from 1.1986 low has resumed and bullishness remains for this move to extend further gain to 1.3300-10, then towards 1.3350-55 (50% projection of 1.2109-1.3269 measuring from 1.2774), however, reckon upside would be limited to previous chart resistance at 1.3445 and price should falter well below dynamic resistance at 1.3500-05 (50% Fibonacci retracement of 1.5018-1.1986), risk from there is seen for a retreat later.
Our preferred count on the daily chart is that cable's rebound from 1.3500 (wave (A) trough) is unfolding as a wave (B) with A ended at 1.7043, followed by triangle wave B and wave C as well as wave (B) has possibly ended at 1.7192, below support at 1.4232 would add credence to this count, then further fall to 1.4000 level would follow but reckon downside would be limited to 1.3655 support and price should stay above previous support at 1.3500.
On the downside, whilst initial pullback to 1.3200 cannot be ruled out, reckon downside would be limited to support at 1.3161 and bring another rise later. Below 1.3080-85 would defer and risk correction to 1.3015-20 but still reckon downside would be limited and as long as 1.2996 (previous minor resistance) holds, prospect of another rise remains. A drop below 1.2996 would defer and suggest top is formed instead, risk weakness to 1.2950-60 and possibly test of support at 1.2909 but price should stay above support at 1.2852, bring rebound later.
Recommendation: Buy at 1.3165 for 1.3365 with stop below 1.3065.
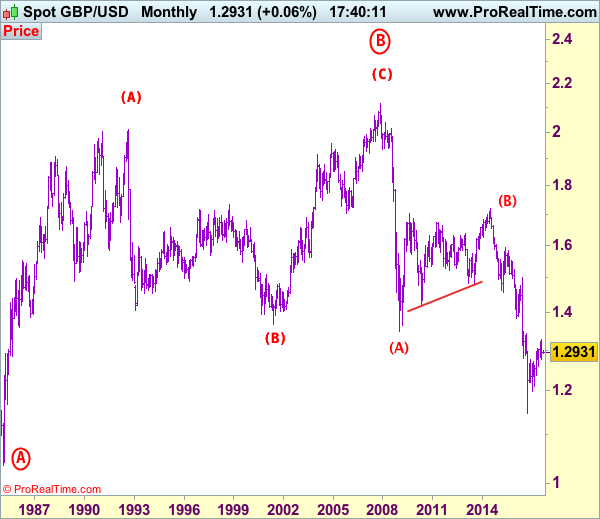
Longer term - Cable's rise from 1.0520 (Feb 1985) to 2.0100 (September 1992) is seen as [A], the decline to 1.3682 is labeled as (B) and (C) wave rally has ended at 2.1162 (9 Nov, 2007) which is also the top of larger degree wave B with circle. The selloff from there is a 5-waver with wave (A) ended at 1.3500 (23 Jan 2009), wave (B) itself is labeled as A: 1.6733, triangle wave B: 1.4813 and wave C as well as top of wave (B) ended at 1.7192 (2014), hence the selloff from there is an impulsive wave (C) with wave I : 1.4566, wave II 1.5930, an extended wave III is unfolding and already exceeded our downside target at 1.3500 and 1.3000, hence weakness to 1.2500 and possibly 1.2000 cannot be ruled out, however, price should stay well above psychological level at 1.0000.
USD/CAD Sideways Price Action After Sharp Decline
USD/CAD is consolidating. Hourly support is located at 1.1945 (29/04/2015 low). Resistance is now given at a distance at 1.2778 (15/08/2017 low). Expected to show continued short-term bearish pressures.
In the longer term, the pair has broken longterm support that can be found at 1.2461 (16/03/2015 low). Strong resistance is given at 1.4690 (22/01/2016 high). The pair is likely to head further lower.