Sample Category Title
Technical Outlook: USDJPY – Extended Recovery Eyes Strong Barrier At 110.00 Zone
The pair extends recovery above 109.38 (Fibo 61.8% of 110.66/107.31 downleg) on Tuesday, following strong bullish acceleration on Monday (the biggest one-day gain since 03 July) as dollar rallied on relief after eased tensions on North Korea and lower than expected impact from Hurricane Irma.
Studies show more room at the upside, with strong barrier at 110.00 zone (weekly Tenkan-sen / Fibo 38.2% of 114.49/107.31 descend), expected to ideally cap, as overall picture is bearish.
Conversely, sustained break above 110.00 would generate strong bullish signal for recovery extension towards key near-term barrier at 110.66 (31 Aug high) and sideline near-term bears.
Res: 110.00, 110.66, 110.90, 111.48
Sup: 109.23, 108.99, 108.60, 108.12
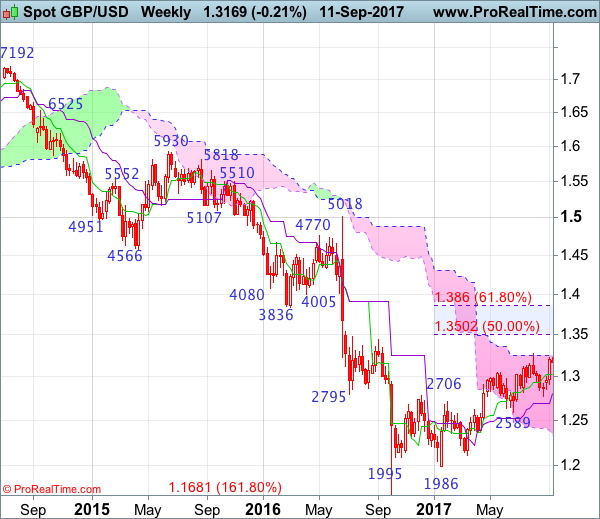
GBP/USD Candlesticks and Ichimoku Analysis
Weekly
• Last Candlesticks pattern: Shooting star
• Time of formation: 31 Jul 2017
• Trend bias: Down
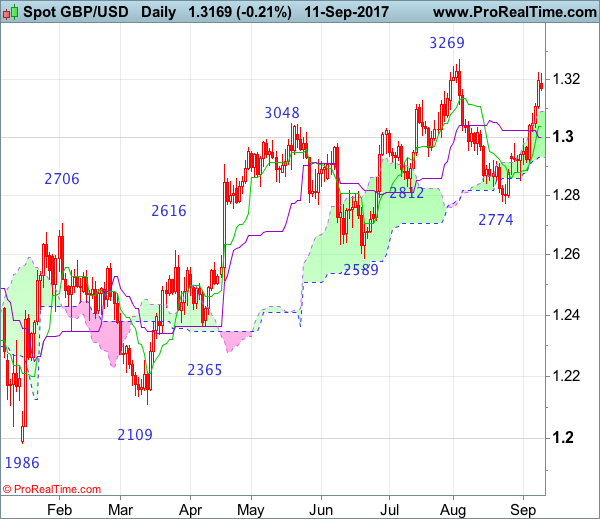
Daily
• Last Candlesticks pattern: Morning star
• Time of formation: 25 Aug 2017
• Trend bias: Near term up
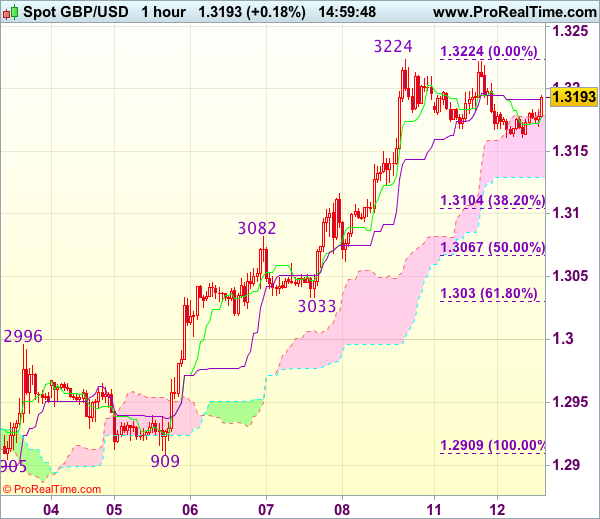
GBP/USD – 1.3172
As cable found decent demand just above 1.2900 last week and has rallied in part due to active cross-buying in sterling, suggesting recent rise from 1.2774 is still in progress and upside bias remains for further gain to1.3225-30, however, break of previous chart resistance at 1.3269 is needed to retain bullishness and signal medium term erratic rise from 1.1986 low has resumed for headway to 1.3300-10, then towards 1.3390-00 but price should falter well below 1.3500-05 (50% Fibonacci retracement of 1.5018-1.1986), bring retreat later.
On the downside, whilst initial pullback to 1.3095-00 cannot be ruled out, reckon the upper Kumo (now at 1.3087) would limit downside and bring another rise later. A daily close below the Tenkan-Sen (now at 1.3038) would defer and suggest top is possibly formed, bring test of 1.2996-99 (previous resistance and current level of the Kijun-Sen), however, break there is needed to provide confirmation, bring further fall to 1.2940-45 but support at 1.2909 should remain intact, bring rebound later.
Recommendation: Long entered at 1.2875 met upside target at 1.3020 with 145 points profit and would buy again at 1.3090 for 1.3290 with stop below 1.2990.
On the weekly chart, although last week’s rally formed a long white candlestick and gain to 1.3225-30 cannot be ruled out, break of recent high at 1.3269 is needed to retain bullishness and signal the erratic rise from 1.1986 low has finally resumed and extend gain to 1.3330-40, then towards 1.3400-10, however, near term overbought condition should prevent sharp move beyond 1.3500-05 (50% Fibonacci retracement of 1.5018-1.1986) and reckon 1.3600-10 would hold from here, risk from there is seen for a retreat later.
On the downside, expect pullback to be limited to 1.3090-00 and the Tenkan-Sen (now at 1.3022) should limit downside and bring another rise later to aforesaid upside targets. Below last week’s low at 1.2909 would defer and prolong choppy trading below said resistance at 1.3269, bring weakness to 1.2850-55 but break there is needed to signal the rebound from 1.2774 has ended, bring further fall to 1.2800, break there would indicate another leg of fall from 1.3269 top is still in progress and bring test of 1.2774, below there would extend this decline for retracement of recent upmove to 1.2685-90, however, reckon downside would be limited to previous support at 1.2589 and bring rebound later. .
Foreign Exchange Market Commentary: EUR/USD, USD/JPY, GBP/USD, GOLD, WTI CRUDE, DJIA, FTSE100, DAX
EUR/USD
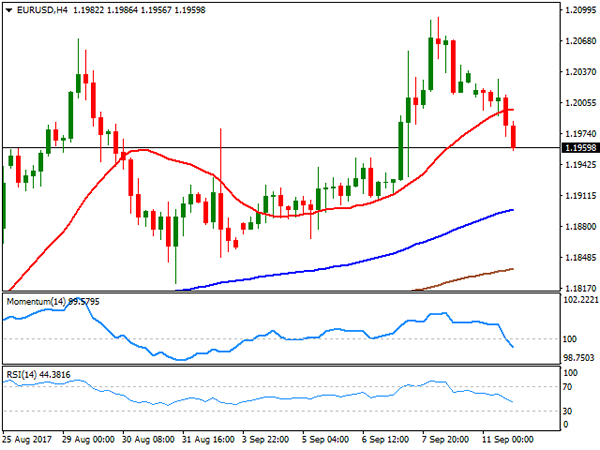
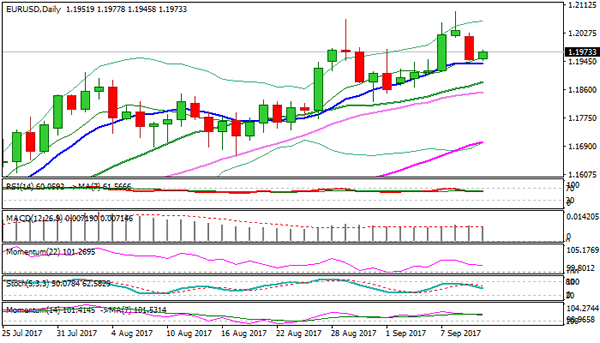
The greenback edged higher against most of its major rivals in dull Monday trading, leading to a EUR/USD decline down to 1.1956, its lowest since last Thursday, when ECB's Draghi failed to down talk the common currency. The rally was driven my resurgent optimism among investors, as Hurricane Irma´s damages Florida will be far less than initially feared, and as North Korea decided to throw a party on Saturday for the 69th anniversary of the regimen, rather than launching more missiles. Equities edged higher worldwide, while the yen, and gold were the biggest losers of the day.
The macroeconomic calendar was quite scarce, with no major releases in Europe and the US, although the week has plenty to offer, starting for this particular pair next Wednesday, with the release of German inflation, EU Industrial Production and US August inflation.
The EUR/USD pair 4 hours chart shows that the decline may extend this Tuesday, as the price has broken below its 20 SMA that lost upward strength, whilst technical indicators entered negative territory, maintaining their strong downward slopes. The decline, however, remains corrective long term, as the price would need at least to break below the 1.1800 level to be at risk of a steeper decline, something quite unlikely unless the US Federal Reserve pulls the trigger by surprise this month, which has almost null chances of happening.
Support levels: 1.2010 1.1975 1.1940
Resistance levels: 1.2070 1.2105 1.2150
USD/JPY
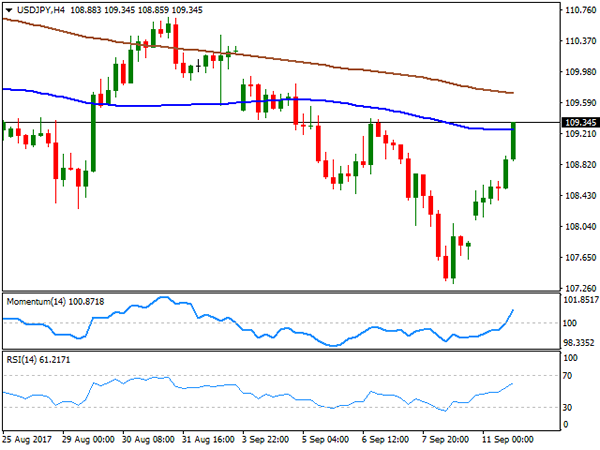
The USD/JPY pair challenged last Thursday's high in the US afternoon, surging past 109.30 amid a sharp advance in Wall Street and a solid bounce in US Treasury yields. Risk aversion eased over the weekend, with the pair gapping higher at the weekly opening, and leaving that gap unfilled at the end of the day. The yield for the 10-year government note surged to 2.12%, bouncing from 2.06%, while for the 30-year note, yields surged to 2.74% from 2.68%. There are no big news scheduled in Japan for the upcoming session, which means that the pair may keep on advancing should Asian equities follow the lead of the their overseas counterparts. The 4 hours chart for the pair shows that the price is currently advancing above its 100 SMA, while technical indicators head strongly higher within positive territory. In the same chart, the 200 SMA is the next probable bullish target and the immediate resistance at 109.70, with gains beyond the level probably resulting on an extension up to 110.25, where the pair also has an unfilled gap from two weeks ago.
Support levels: 107.65 107.30 106.90
Resistance levels: 108.10 108.45 108.90
GBP/USD
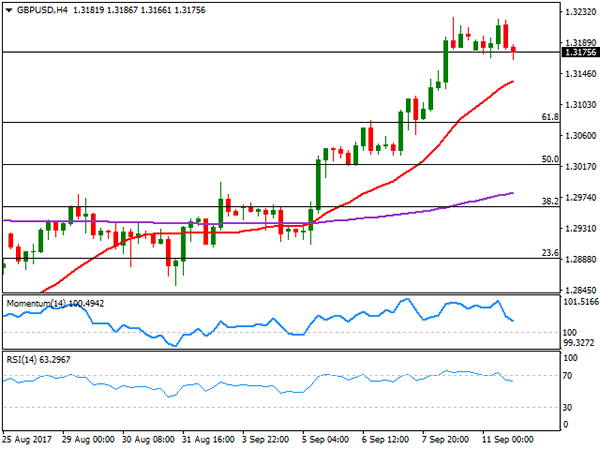
The GBP/USD closes the day marginally lower after a failed attempt to surpass Friday's high of 1.3223 early London, as dollar's recovery extended all through the day. The greenback benefited from improved risk sentiment, and a scarce macroeconomic calendar, but the Pound was among the best performers, holding on to gains ahead of the UK's Parliament key Brexit vote. Policymakers will have to decide over the EU withdrawal bill by the end of the day, but given that the government has secured a deal to get the majority in the Commons House, seems there won't be big surprises at this stage. This Tuesday, attention will center on UK's August CPI and PPI data, more relevant ahead of Thursday ECB's meeting. From a technical point of view, the 4 hours chart shows that the price is holding above a still bullish 20 SMA, but also that technical indicators have retreated from overbought territory, with the Momentum nearing its 100 level, and the RSI currently at 61, suggesting the decline could extend further, but as corrective. Beyond the mentioned Friday's high, the next big hurdle comes at 1.3266, August monthly high, with a break above this last probably triggering stops and fueling the advance.
Support levels: 1.3180 1.3130 1.3090
Resistance levels: 1.3225 1.3265 1.3300
GOLD
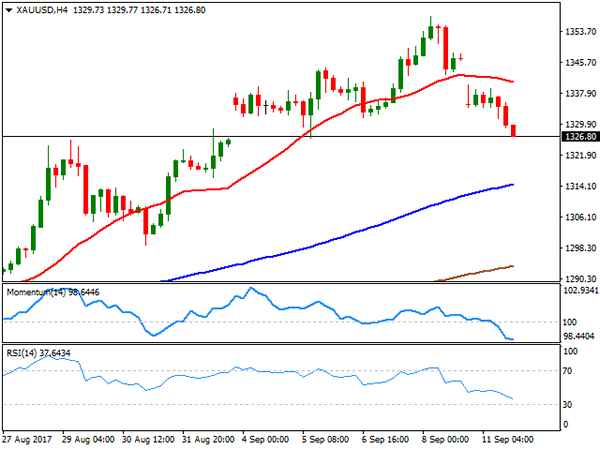
Gold prices came under strong selling pressure this Monday as risk aversion eased, with the commodity trading at its lowest in almost a week by the end of the day, around $1,326.60 a troy ounce. A stronger dollar amid easing geopolitical tensions and a strong bounce in equities pushed the commodity lower, also dumped for the sake of riskier, and more profitable assets. Curiously spot gapped lower at the weekly opening, and seems poised to fill another gap, left at the beginning of the previous week, when a North Korean nuclear test pushed the commodity higher, at 1,325.90. The daily chart for gold shows that technical indicators have begun correcting extreme overbought conditions, whilst the price remains far above all of its moving averages, in line with further downward corrections ahead. The 20 DMA particularly, stands now at 1,315.30, providing a dynamic support in the case of further dollar gains. In the 4 hours chart, the commodity is biased lower, trading below a bearish 20 SMA and with technical indicators heading sharply lower within negative territory, also leaning the scale towards the downside for the upcoming sessions.
Support levels: 1,325.90 1,315.30 1,306.60
Resistance levels: 1,337.80 1,346.30 1,355.10
WTI CRUDE OIL
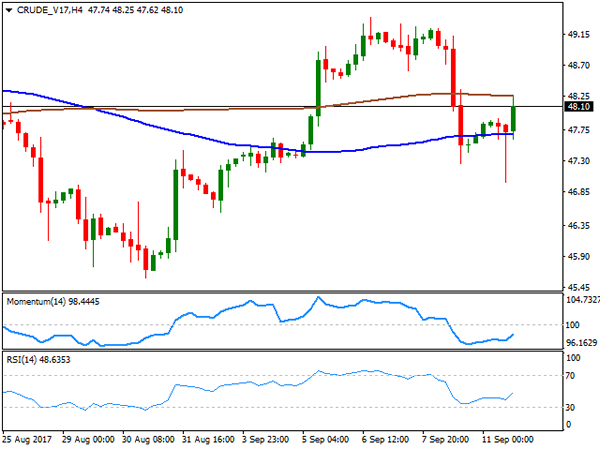
West Texas Intermediate crude futures reversed an early slide and closed the day with gains at $48.10 a barrel. Oil prices were quite volatile, as investor assessed the impact of Hurricane Irma in the US Florida. The initial decline came as a consequence of fears of diminishing demand for the black gold, but as the day went by, risk of a downturn in crude demand lessened, resulting in the late recovery. Further supporting the commodity were comments from Saudi Arabia officers, which talked about a three-month extension of the ongoing output cut deal. The daily chart presents a neutral stance, as the price remains trapped between horizontal 100 and 200 DMAs, although a brief dip below the shortest was quickly reverted, somehow indicating limited selling interest at this point. Technical indicators in the mentioned chart hold flat around their mid-lines, giving no clues on what's next for oil. In the 4 hours chart, the price is also trapped between horizontal moving averages, with selling interest containing advances around the 200 SMA, and while technical indicators resume their declines after correcting oversold conditions, leaning the scale towards the downside.
Support levels: 47.90 47.20 46.60
Resistance levels: 48.70 49.40 50.00
DJIA
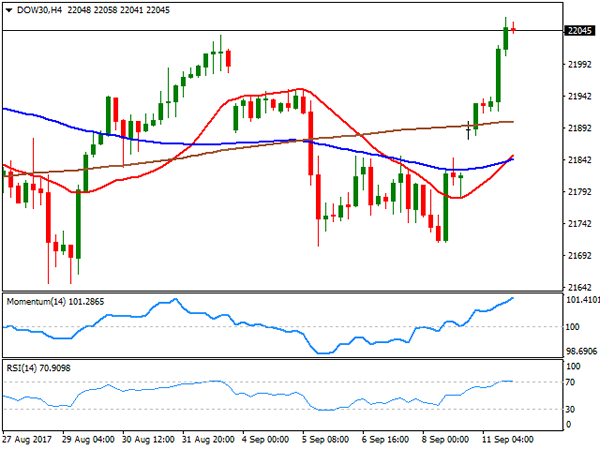
Wall Street ended the day with strong gains, as risk appetite returned after a quieter-than-expected weekend. The DJIA regained the 22,000 level, to end the day 259 higher at 22,057.37, while the Nasdaq Composite added 72 points, to 6,432.26. The S&P surged to a fresh 2017 record high after advancing 1.08%, ending the day at 2,488.11. Insurers companies followed the lead of their European counterparts, posting strong gains on Hurricane Irma consequences' relief. DowDuPont was the best performer, gaining 2.88%, followed by Travelers that advanced 2.21%. Only three members closed down, with Home Depot losing 0.91% and General Electric shedding 0.71%. The index is at its highest in 4-weeks, and technical readings in the daily chart support additional gains ahead, as the index gained upward momentum after breaking above its 20 DMA, whilst technical indicators aim north well above their mid-lines. Shorter term, and according to the 4 hours chart, the index is far above all of its moving averages, whilst technical indicators maintain their upward strength, despite being in overbought territory, also favoring a new leg higher for this Tuesday.
Support levels: 22,005 21,970 21,928
Resistance levels: 22,086 22,137 22,179
FTSE100
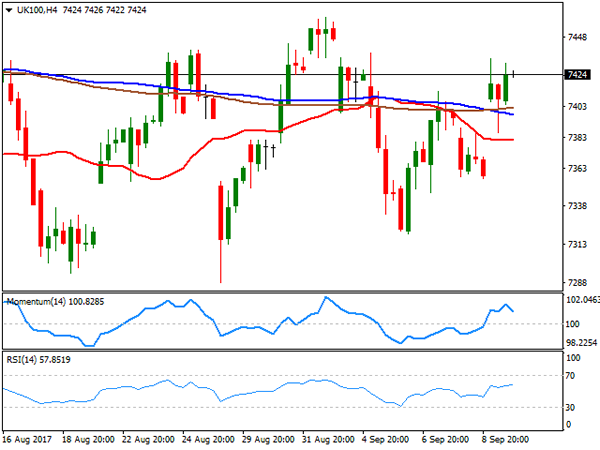
London equities ended mostly higher this Monday, with the FTSE 100 settling at 7,413.59, up by 0.49% or 36 points. Risk appetite was behind the advance after Hurricane Irma was downgraded to a tropical storm, with insurers companies surging by the most on speculation of lesser damages from the Hurricane than previously estimated. Within the Footsie, Provident Financial was the best performer, adding 3.77%, followed by EasyJet that added 3.37%. Mining-related equities edged lower, as gold fell to its lowest in over a week, resulting in Randgold Resources losing 1.54%. The worst performer was Associated British Foods that lost 4.96%. The index remains within its latest range, with a slightly positive tone in the daily chart, as technical indicators aim modestly higher above their mid-lines, whilst the index settled above its anyway directionless moving averages. In the 4 hours chart, the early gap sent the index above a congestion of moving averages, a sign of lack of directional strength, whilst technical indicators lost their upward potential, but hold within positive territory anyway.
Support levels: 7,400 7,376 7,333
Resistance levels: 7,444 7,482 7,515
DAX
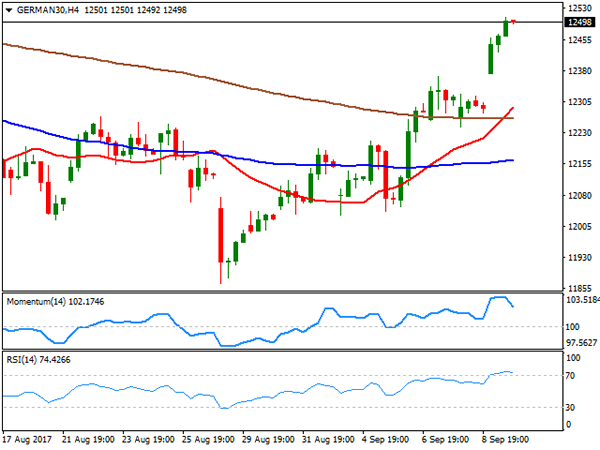
European equities edged higher, advancing by the most in almost a month, on improved market's mood. The German DAX closed at 12,475.24, up 173 points, on easing concerns over Hurricane Irma economic consequences, and a quiet North Korea celebration over the weekend, with no missiles involved. Financials were the best performers in Europe, and within the DAX, Muenchener led advancers, ending the day up 4.36%, followed by Commerzbank and Deutsche Bank, up 3.36% and 2.86% respectively. Daimler was the only one to close in the red, down by 0.07%. The daily chart for the benchmark shows that it settled above its 100 DMA for the first time since July 24th, while technical indicators keep heading higher within positive territory with uneven strength, but still favoring additional advances for this Tuesday. In the 4 hours chart, the index settled far above all of its moving averages, with the 20 SMA accelerating above the 100 and 200 SMAs, but technical indicators easing from extreme overbought readings, anticipating at least some consolidation ahead and before the next directional move.
Support levels: 12,462 12,424 12,372
Resistance levels: 12,532 12,576 12,612
USD/CHF Candlesticks and Ichimoku Analysis
Weekly
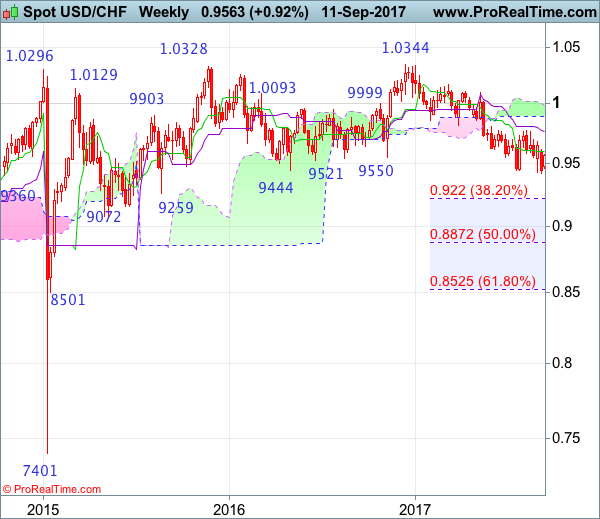
• Last Candlesticks pattern: Shooting star
• Time of formation: 7 Mar 2017
• Trend bias: Sideways
Daily
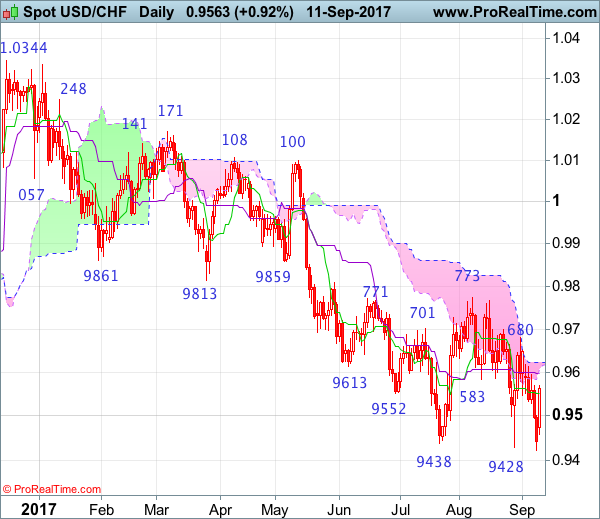
• Last Candlesticks pattern: Morning star
• Time of formation: 9 May 2017
• Trend bias: Near term up
USD/CHF – 0.9548
Although the greenback broke below previous support at 0.9428, lack of follow through selling and the subsequent rebound from last week’s low of 0.9421 suggest consolidation above this level would be seen and initial upside risk is for corrective bounce to the Kijun-Sen (now at 0.9597 but reckon the upper Kumo (now at 0.9623) would limit upside and bring another decline later. Below 0.9455-60 would bring a retest of said support at 0.9421, however, break there is needed to confirm recent decline from 1.0344 (2016 top) has resumed and extend weakness to 0.9390-00, then towards 0.9330-35, having said that, oversold condition should prevent sharp fall below previous support at 0.9259 and reckon 0.9220 (38.2% Fibonacci retracement of entire rise from 0.7401-1.0344) would hold.
On the upside, whilst recovery to the Kijun-Sen (now at 0.9597) cannot be ruled out, reckon the upper Kumo (now at 0.9623) would limit upside and bring another decline. Only a daily close above indicated resistance at 0.9680 would signal low has been formed instead, b bring further subsequent gain to 0.9698-99 resistance but price should falter well below another previous resistance at 0.9773.
Recommendation: Sell dollar at 0.9640 for 0.9400 with stop above 0.9740.
On the weekly chart, although the greenback fell briefly below previous support at 0.9428, the subsequent bounce from 0.9421 suggests consolidation above this level would be seen and corrective bounce to the Tenkan-Sen (now at 0.9597) cannot be ruled out, however, reckon upside would be limited to 0.9660-66 and bring another decline later. Below said support at 0.9421 would signal the decline from 1.0344 top is still in progress and may extend weakness to 0.9350, then towards previous support at 0.9259, however, oversold condition should prevent sharp fall below 0.9220 (38.2% Fibonacci retracement of 0.7401-1.0344) and reckon 0.9150 would hold from here, risk from there is seen for a rebound later.
On the upside, expect recovery to be limited to the Tenkan-Sen (now at 0.9597) and resistance at 0.9680 should remain intact, bring another decline later. A break of this level would risk test of 0.9765-73 (current level of the Kijun-Sen and previous resistance), however, only a sustained breach above this level would signal low is formed instead, bring a stronger rebound for retracement of recent decline to 0.9805-10, then test of the lower Kumo (now at 0.9894) but upside should be limited to the upper Kumo (now at 0.9982), price should falter well below resistance at 1.0100.
Trade Idea : USD/CHF – Target met and buy at 0.9480
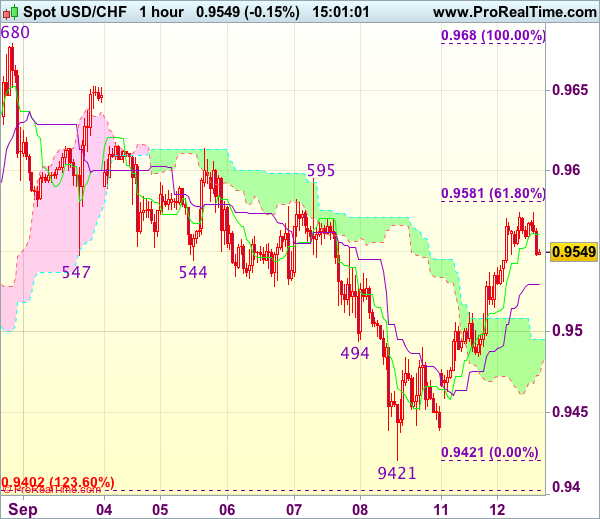
USD/CHF - 0.9548
Most recent candlesticks pattern : N/A
Trend : Down
Tenkan-Sen level : 0.9561
Kijun-Sen level : 0.9530
Ichimoku cloud top : 0.9496
Ichimoku cloud bottom : 0.9473
Original strategy :
Bought at 0.9450, met target at 0.9550
Position : - Long at 0.9450
Target : - 0.9550
Stop : -
New strategy :
Buy at 0.9480, Target: 0.9580, Stop: 0.9445
Position : -
Target : -
Stop : -
The greenback extended the rebound from 0.9421 (last week’s low) in line with our bullish expectations, our long position entered at 0.9450 met target at 0.9550 with 100 points profit, this anticipated rise adds credence to our view that low has been formed at 0.9421 and consolidation with upside bias remains for another rebound to 0.9580-81 (61.8% Fibonacci retracement of 0.9680-0.9421), then test of resistance at 0.9595, however, near term overbought condition should limit upside to 0.9640-45.
In view of this, we are looking to reinstate long on dips as the lower Kumo (now at 0.9473) should limit downside and bring another rebound. Below 0.9450 would abort and suggest the rebound from 0.9421 has ended, bring retest of this level later.
Softened Sanctions On North Korea & Fading Irma Concerns Sends S&P 500 To Record High
Investors returned from the weekend with a high appetite for risk assets, sending the S&P 500 to a new record high on Monday, with global equities edging higher across the board. Risk-on trading was driven by two factors; the absence of provocative actions from North Korea, and the fact that less damage was recorded by Hurricane Irma than previously estimated.
Although the United Nations Security Council stepped up sanctions against North Korea over its missile and nuclear programs, the UN's actions do not seem to be leading to war. The less severe measures and comments from U.S. Ambassador Nikki Haley that Pyongyang had 'not yet passed the point of no return', are pointing towards negotiations, rather than military confrontation. Eliminating North Korea's risk factor will be a positive development for financial markets, but as we have yet to find out the response from Kim Jong-un's regime, we cannot assume negotiations are going to be successful.
The damage cost of Hurricane Irma has been dialed down significantly, as it was downgraded to a tropical storm on Monday morning. Over the weekend, total damage cost estimates had exceeded 200 billion dollars, or approximately 1% of U.S. GDP; current estimates have revised this figure down to $50 billion. Insurance stocks were the prime beneficiaries yesterday, with the sector rising 1.8%.
Another factor helping equity markets is the belief that the Fed will refrain from raising rates again this year, due to the loss in economic activity caused by hurricanes Harvey and Irma. Investors are likely to continue buying stocks with overstretched valuations, because when compared to treasuries, they still look much more attractive.
Safe haven assets were sold off heavily, with gold declining 2.3%, or $32, from Friday's peak. Although the appetite for equities may further affect gold prices, investors are likely to remain cautious and hedge against many unknowns. That's why we didn't see any significant outflows from gold-backed exchange traded funds. The yellow metal is still up 10% from June's low, and we expect the $1,300 will prove to be a strong support level.
Currency markets were steady early Tuesday, with the greenback holding on to most of yesterday's gains. However, U.K. data might lead to some big swings in Sterling if it diverges from expectations. The risk of the August CPI shooting higher and leading to a more hawkish tone from BoE on Thursday, is keeping GBPUSD well supported. With no other tier one economic data on the calendar, currencies are likely to remain range-bound for the rest of the day, unless we see significant moves in U.S. treasury yields
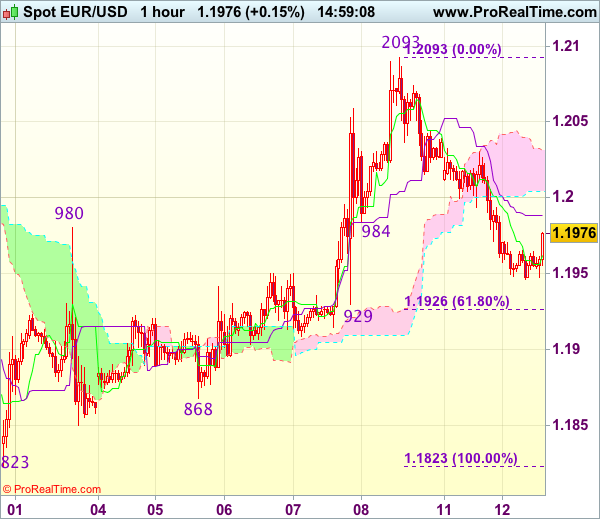
Technical Outlook: EURUSD – 10SMA So Far Contains Pullback But Deeper Correction Cannot Be Ruled Out
The Euro was higher in early Tuesday's trading after pullback from fresh multi-month high at 1.2092 was contained above initial support at 1.1935 (10SMA) that hardly impacted larger bullish picture. Fresh attempts above psychological 1.2000 barrier could be expected while 10SMA, with close above 1.2000 (also Fibo 38.2% of 1.2092/1.1945 pullback needed to signal higher low at 1.1945 and trigger further recovery. Daily studies in full bullish setup support the notion. Alternative scenario sees rising downside risk on break below 10SMA, which could extend pullback towards next strong support at 1.1883 (rising 20SMA).
Res: 1.2000, 1.2036, 1.2070, 1.2092
Sup: 1.1935, 1.1883, 1.1826, 1.1773
Trade Idea : GBP/USD – Buy at 1.3125
GBP/USD - 1.3200
Most recent candlesticks pattern : N/A
Trend : Near term up
Tenkan-Sen level : 1.3186
Kijun-Sen level : 1.3195
Ichimoku cloud top : 1.3178
Ichimoku cloud bottom : 1.3129
Original strategy :
Buy at 1.3125, Target: 1.3225, Stop: 1.3090
Position : -
Target : -
Stop : -
New strategy :
Buy at 1.3125, Target: 1.3225, Stop: 1.3090
Position : -
Target : -
Stop : -
As cable has continued trading with a firm undertone, suggesting bullishness remains for recent upmove from 1.2774 to resume after consolidation, above last week’s high at 1.3224 would extend gain to 1.3250, however, loss of near term upward momentum should prevent sharp move beyond recent high at 1.3269, risk from there has increased for a retreat to take place later.
In view of this, would not chase this rise at current level and would be prudent to buy cable on subsequent pullback as 1.3120-25 should limit downside. Only below 1.3082 (previous resistance turned support) would abort ad suggest top is possibly formed, risk test of 1.3062 but reckon support at 1.3033 would hold.
Japan: Running On All Engines
- Japan is showing itself to be in good shape as the economic upswing is the longeststanding since the crisis.
- We expect growth to continue through fiscal 2017, supported by a very strong labour market, the global economic recovery and extremely accommodative economic policies.
- As fiscal stimulus wanes next year, we are likely to see growth rates return to lower levels around potential.
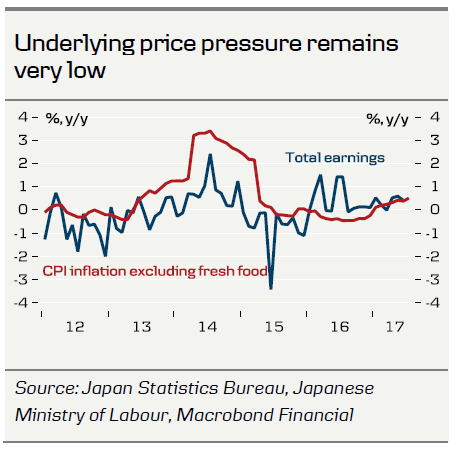
- Underlying price pressure remains very low. Higher inflation does not seem impending.
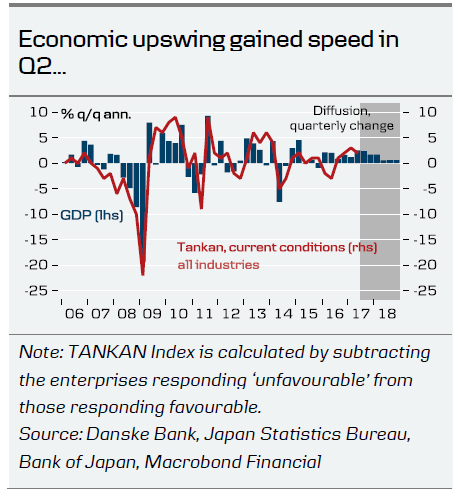
Strong momentum
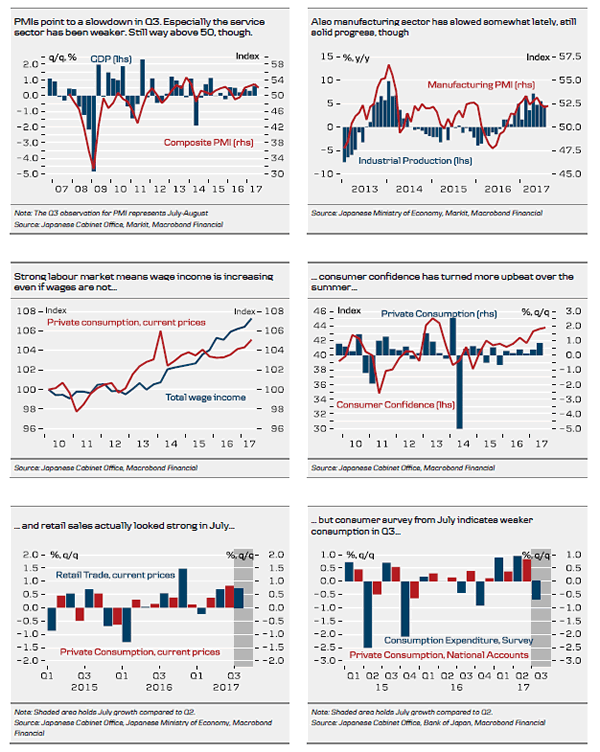
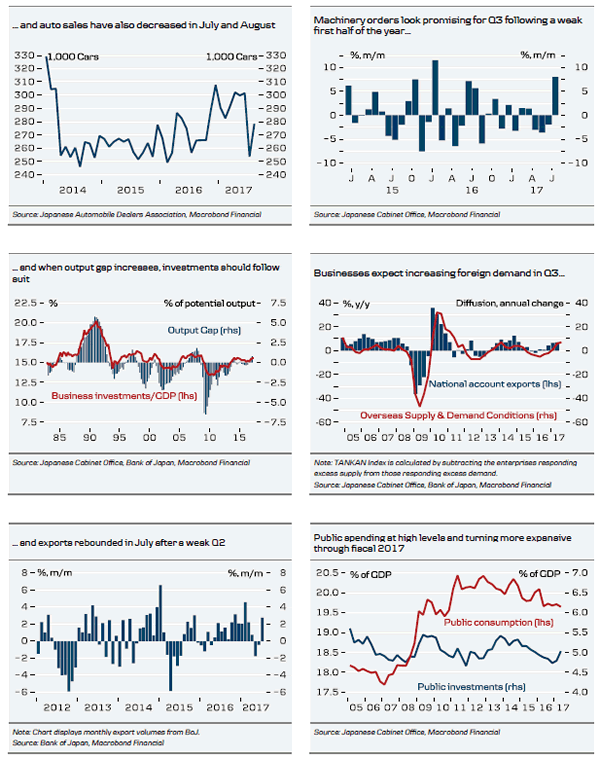
The Japanese economy picked up speed in Q2 and grew at an annualised growth of 2.5% q/q. Thus, the economic upswing continued and the last six quarters now constitute the longest period of positive growth in Japan since before the crisis. According to Bank of Japan's TANKAN survey, businesses are turning increasingly upbeat, more companies have reported favourable conditions since Q2 16 and more companies are looking for favourable conditions in Q3. On the other hand, PMIs have decreased in July and August, particularly driven by the service sector, which could signal some slowdown in domestic demand. Manufacturing PMIs have also shown some signs of slowdown, which is also what we see in industrial production over the summer. Composite PMI now stands about one index point lower than Q2, which indicates a decrease in Q3 for the first time in 2017. PMIs thus point to some slowdown in GDP growth.
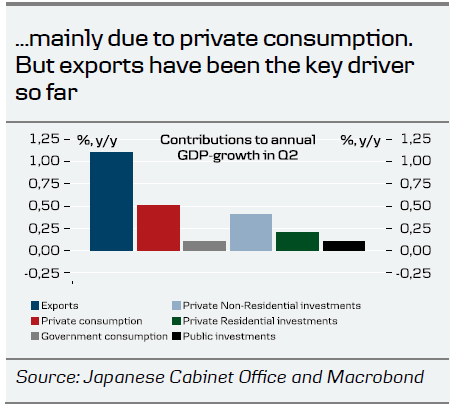
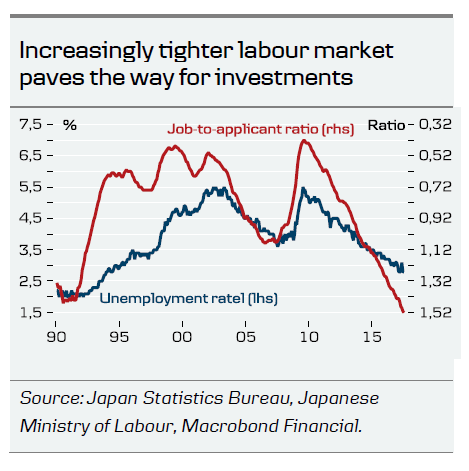
Growth was primarily driven by private consumption and investments in Q2. Looking back on the recent year, exports have been the key driver, though. We do expect more from private consumption going forward. Wage inflation remains stubbornly low but with a labour market that is turning increasingly hotter and unemployment that has fallen to even lower levels, total wage income is increasing, even if wages are not. We believe there is room for private consumption to continue contributing to growth. Consumer confidence has also remained upbeat over the summer, although it does look like some slowdown in private consumption in Q3. Both consumer surveys and auto sales have looked weak in August. Retail sales, on the other hand, was strong. We expect private consumption to stay on a positive trend but as long as wage increases remain depressed, it will probably be at a moderate pace.
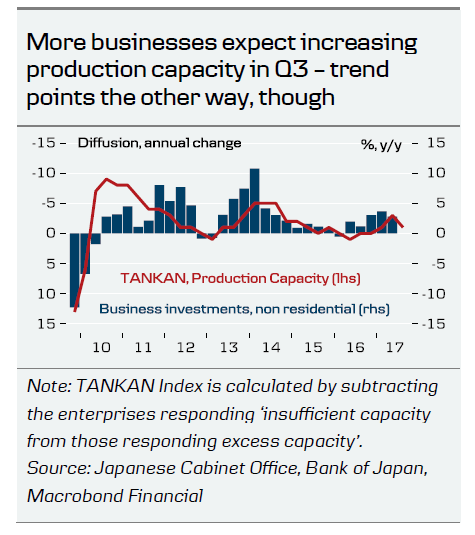
On the private demand side, we have also seen a decent pick-up in investments recently. Both business and residential investments have been increasing since the current economic upturn began in Q1 16. Indicators are mixed, as housing starts decreased in July and businesses signal a slight increase in production capacity in Q3. Machinery orders, on the other hand, rebounded in July after a weak first half of the year. Looking beyond Q3, we expect the positive trend in business investments to keep up, as the output gap increases and labour becomes an increasingly scarce resource. At the same time, the Tokyo Olympics 2020 remains supportive for investments. Bank of Japan (BoJ) has estimated that investments in infrastructure, hotels, commercial properties, etc., amount to 1.3% of annual GDP spread out over the years 2014-2021.
Overall, exports have still been the main driver of the upturn, especially over the past year. Japan is particularly dependent on the US and China, which account for close to 40% of total exports. Particularly exports to China have been key, standing at close to 20% y/y in nominal terms, but also US demand has been strong. Whereas private demand could be slowing somewhat in Q3, exports have been strong and rebounded in July. An increasing share of companies are reporting excess demand in Q2 and expectations of the same in Q3. Japanese exporters strongly benefit from the global economic upturn and the relatively weak yen.
Stimulus in place but inflation remains stubbornly low
We expect monetary policy to remain extremely accommodative throughout the forecast period, which will also be supportive for demand, both domestically and abroad. BoJ has pledged to hold measures in place until the 2% inflation target is reached. Inflation has been increasing through 2017, but mainly due to rising energy prices. Underlying price pressure in Japan remains very low and BoJ's inflation target is currently nowhere within reach. Almost three decades of very low inflation mean companies are reluctant to raise prices and try to cut back on services and streamline their operations instead of raising wages. Low worker mobility and a preference for job security over wage increases are big obstacles for wage inflation.
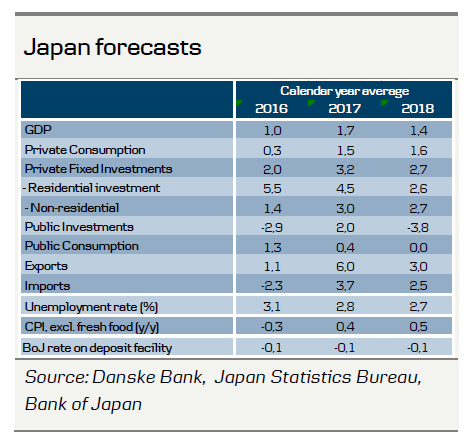
Public spending is also set to remain supportive for the economy through the fiscal year 2017, which runs from Q2 17-Q1 18. We expect to see GDP-growth around 2% q/q annualised through the rest of fiscal 2017 and a significant slowdown in fiscal 2018 when stimulus starts to wear off.
Trade Idea : EUR/USD – Stand aside
EUR/USD - 1.1977
Most recent candlesticks pattern : N/A
Trend : Up
Tenkan-Sen level : 1.1962
Kijun-Sen level : 1.1988
Ichimoku cloud top : 1.2031
Ichimoku cloud bottom : 1.2004
Original strategy :
Bought at 1.1985, stopped at 1.1950
Position : - Long at 1.1985
Target : -
Stop : - 1.1950
New strategy :
Stand aside
Position : -
Target : -
Stop : -
Although the single currency recovered after falling to 1.1947 and test of the Kijun-Sen (now at 1.1988) cannot be ruled out, reckon upside would be limited to the lower Kumo (now at 1.2004) and bring another decline later, below said support at 1.1947 would extend the fall from 1.2093 top to 1.1926-29 (61.8% Fibonacci retracement of 1.1823-1.2093 and previous support) but reckon 1.1900 would hold on first testing.
In view of this, would be prudent to stand aside for now. Above the lower Kumo (now at 1.2004) would bring test of the upper Kumo (now at 1.2031) but a sustained breach above there is needed to signal the fall from 1.2093 has ended and bring a stronger rebound to 1.2050-55 first.