
Sample Category Title
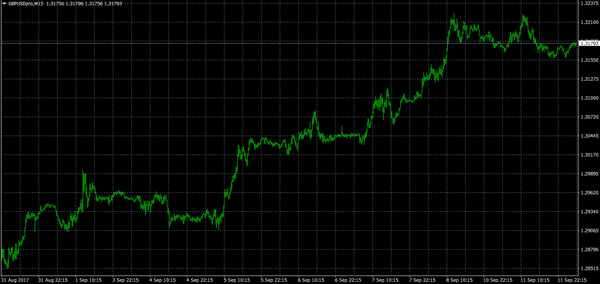
Technical Outlook: GBPUSD – Strong Inflation Numbers Today Could Drive The Price Above 2017 High At 1.3268
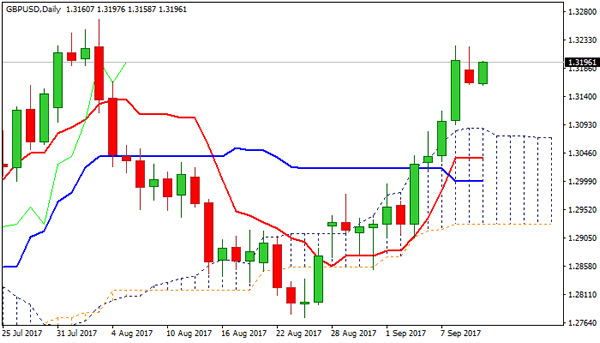
Cable regains traction and emerges above thick hourly cloud, in renewed attempt again at1.3200 barrier, following yesterday's repeated rejection at 1.3222 and daily close in red, the first after four consecutive strong bullish days.
Overall structure remains firmly bullish while the price holds above daily cloud top (1.3075) and sees scope for final push towards key barrier at 1.3268 (03 Aug peak).
UK CPI data are in focus today and may boost pound further if release comes at/above forecast at 2.8% for August (vs 2.6% in July).
Sustained break above 1.3268 (also 2017 high) would open way towards 1.3473 (weekly cloud top/50% retracement of larger 1.5016/1.1930 descend).
Conversely, weaker than expected inflation numbers could spark fresh weakness through 1.3159 (lows of today/Monday) and risk retest of daily cloud top.
Res: 1.3203, 1.3224, 1.3268, 1.3300
Sup: 1.3159, 1.3093, 1.3075, 1.3046
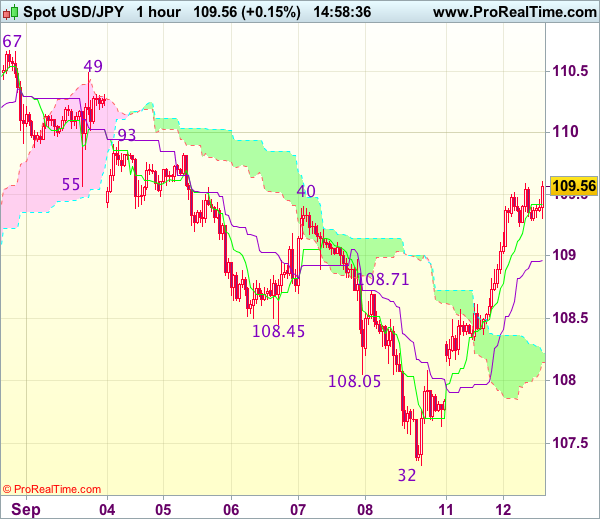
Trade Idea : USD/JPY – Hold short entered at 109.35
USD/JPY - 109.55
Most recent candlesticks pattern : N/A
Trend : Down
Tenkan-Sen level : 109.44
Kijun-Sen level : 108.96
Ichimoku cloud top : 108.22
Ichimoku cloud bottom : 108.15
Original strategy :
Sold at 109.35, Target: 108.35, Stop: 109.70
Position : - Short at 109.35
Target : - 108.35
Stop : - 109.70
New strategy :
Hold short entered at 109.35, Target: 108.35, Stop: 109.70
Position : - Short at 109.35
Target : - 108.35
Stop : - 109.70
Although the greenback has continued edging higher today and marginal gain from here cannot be ruled out, loss of near term upward momentum should prevent sharp move beyond 109.70 and bring retreat later, below the Kijun-Sen (now at 108.96) would suggest an intra-day top is formed, bring weakness to 108.60-65, break there would add credence to this view, then test of the Ichimoku cloud (now at 108.15-22) would follow but downside should be limited to 107.85, bring rebound later.
In view of this, we are holding on to our short position entered at 109.55. Above 109.70 would defer and signal low has been formed, bring a stronger rebound towards resistance at 109.93 but reckon 110.20 would hold from here due to near term overbought condition.
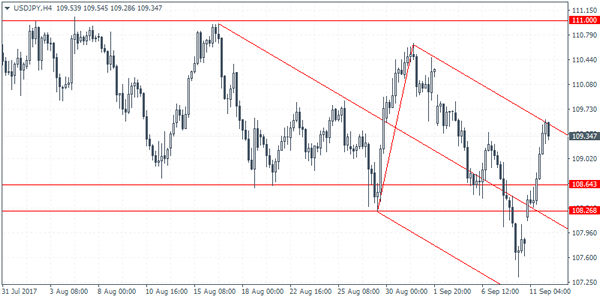
USDJPY Intraday Analysis
USDJPY (109.34): The USDJPY recovered sharply off the support level at 109.15 - 108.26, rising to post a 4-day high. In the near term, USDJPY could be seen falling back to retest the support level at 108.64 - 108.26. Establishing support here could shift the bias to the upside with price action likely to push towards 111.00. Alternately, to the downside in the event that the support fails, we could expect USDJPY falling back to the previous lows formed near 107.60.
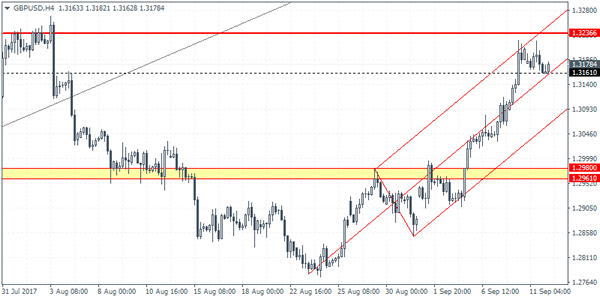
GBPUSD Intraday Analysis
GBPUSD (1.3178): The British pound remains bullish as price action remains flat above 1.3150 level. The currency pair gave up some of the gains yesterday. The rally to 1.3200 marks a test of the trend line break out following establishing support at 1.2847. Further gains could be seen coming as GBPUSD could potentially be testing 1.3236 resistance level. To the downside, minor support has been formed at 1.3161. Therefore, a breakdown below this support level could signal near-term declines. The correction could potentially push the cable down to the pending support level at 1.2980.
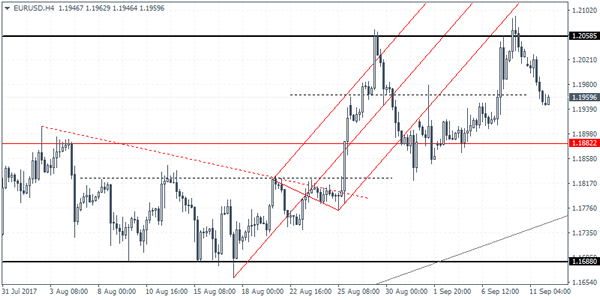
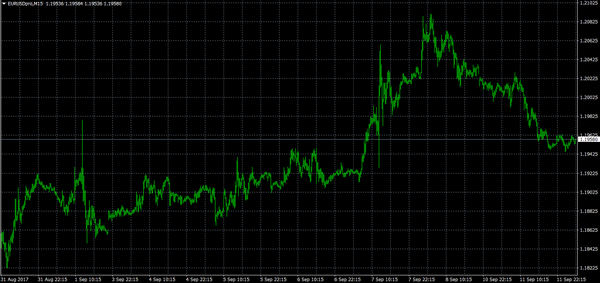
EURUSD Intraday Analysis
EURUSD (1.1959): The EURUSD extended declines sharply yesterday as price action fell to the minor support level at 1.1962. The common currency was seen posting a reversal off this level. The bias remains balanced at the moment although there is a strong chance that price action could be setting up for a bullish breakout. Resistance at 1.2058 remains the key level for the EURUSD. The current price action also signals a potential cup and handle pattern that could be forming in the near term. However, should prices continue to decline, the bullish bias in the EURUSD could ease as price is likely to fall to the next support level at 1.1882.
USD Recovers As Geopolitical Tensions Ease
The US dollar was seen recovering on Monday as geopolitical tensions eased pushing risk appetite higher. The US dollar index, which was seen trading below 91.85, was seen attempting to pull back higher after the index filled the gap from December 2014. The lack of economic data saw the markets taking cues from the global developments.
On the economic front, data yesterday saw Canada's housing starts rising 223k on the month, beating estimates of 216k and accelerating slightly higher from the previous month.
Looking ahead, the UK's inflation data will be main focus today. According to the estimates, consumer prices in the UK are forecast to accelerate 2.8% in August, up from 2.6% in July. Core consumer prices are also expected to rise 2.5%, slightly up from 2.4% previously. The data marks the start of a busy week for the British pound which will also include the UK parliamentary vote on Brexit as well as wage data and the BoE's meeting.
EURUSD Corrects Lower
The single currency continues to correct lower against the greenback, with the EURUSD pair moving below its 100-hour moving average, and reaching an intraday low of 1.1945, during the Asian trading session.
Price-action on the EURUSD suggests further intraday weakness remains possible, will sellers likely to target the euro's monthly time frame, 50-period moving average, located at 1.1871.
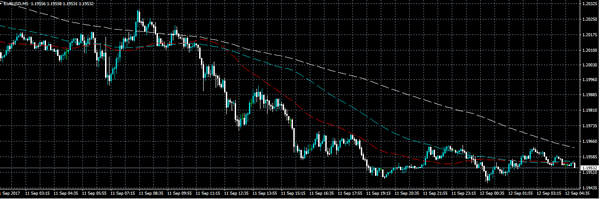
The EURUSD remains bearish on an intraday basis whilst trading below the pairs weekly pivot point, at 1.1999. Only a higher time-frame price close below the 1.1660 level can negate the euro's bullish medium-term outlook.
Key intraday technical support is located at the 200-hour moving average, at 1.1938, and the September 7th price low, at 1.1914.
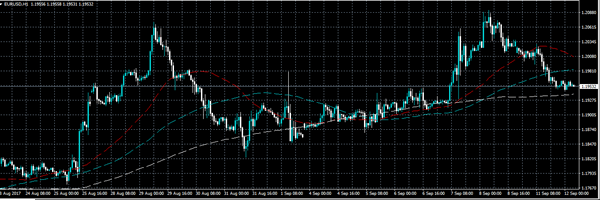
To the upside, key intraday technical resistance for the EURUSD pair is located at 1.1962, 1.1979 and 1.1999. Above the 1.1999 level, further resistance is found at the former swing price high at 1.3039.
USDJPY Risk Reversal Targets 110
The USDJPY pair has moved to a four-day trading high, hitting 109.58 during the Asian trading session, as yesterday's risk-reversal in broader markets continues, helping to boost the U.S dollar index.
Going forward, the USDJPY pair may now start to target the gap created on the price charts, on the September 1st market open, which is currently located just above the psychological 110 level, at 110.07.
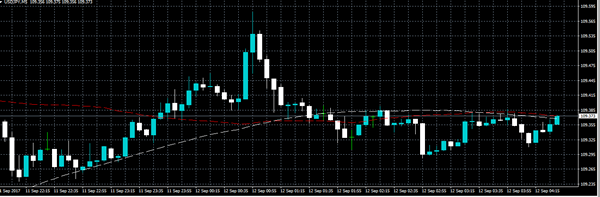
The USDJPY remains bullish on an intraday basis, while trading above the weekly pivot point, at 108.37. The recent correction in the pair may be largely technically driven, as U.S fundamentals remain weak.
Key intraday technical resistance can be found at 109.80, the 50-day moving average, at 110.07, and the July 31st swing high, at 110.67.
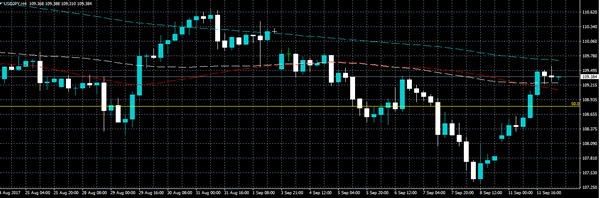
Key intraday USDJPY technical support is located at the 109.37, and the pairs 200-hour moving average, at 109.21.
Further technical support is found at the 109.00 level, which represents the 50 percent Fibonacci retracement of the 110.67 swing high, to the 107.31 swing low
UK Data On Tap For Tuesday
After a quiet start to the week, investors will turn their attention back to the economic data on Tuesday with key inflation numbers from the United Kingdom.
National Statistics in London will get the ball rolling at 08:30 GMT with a batch of inflation data covering the retail, consumer and producer levels.
The Retail Price Index is expected to show annual growth of 3.8% in August, compared with 3.6% the previous month. The Producer Price Index (PPI) Output will likely show a reading of 3.1% for the same month. The annual Consumer Price Index (CPI) likely rose to 2.8% in August from 2.6% the previous month.
The Bank of England (BOE) has already warned investors that inflation will probably overshoot its target in the short-term as ultra-loose monetary policy compensates for Brexit. Negotiations over the future of UK-EU relations officially began in June following the snap parliamentary election. The election result weakened Prime Minister Theresa May’s mandate for a ‘hard Brexit’ after the Conservatives failed to regain a parliamentary majority.
There are no other major releases scheduled for Tuesday. In the United States, the National Federation of Independent Business (NFIB) will release its monthly Business Optimism Index. Small business is the lifeblood of the world’s largest economy.
After a disastrous week, the US dollar rebounded on Monday. The DXY dollar basket rose 0.6% to finish at 91.88. The index rose slightly during Asian trading.
Last week, the greenback plunged to its lowest level since January 2015, with the euro and Canadian dollar notching multiyear highs.
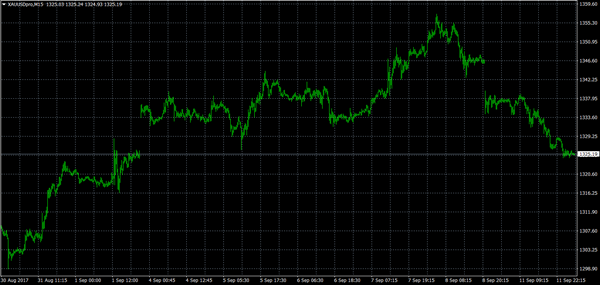
A stronger US dollar triggered a sharp downward correction for precious metals on Monday, with gold and silver prices finishing lower on the day.
EUR/USD
Like other dollar peers, the euro broke sharply lower on Monday, falling below 1.2000 US. The EUR/USD is currently trading around 1.1960. The next support level comes in at 1.1910. On the flipside, the pair will likely eye a return to 1.2000.
GBP/USD
The British pound traded within a narrow range on Tuesday, although pressure is building back toward the 1.3200 US handle. Cable last reached that milestone in early August before engaging in a multiweek correction. The 1.3200 level is the immediate resistance for the GBP/USD. A clean break above that level would lead to a test of the 1.3220 region. On the opposite side of the ledger, the 1.3150 area offers immediate support, with further downside projected at around 1.3100.
GOLD
A rebounding dollar drove gold bullion sharply lower at the start of the week. Spot prices fell nearly $20 and were down again on Tuesday. Prices are currently hovering near two-week lows. The outlook on bullion will depend largely on fundamental forces. In terms of short-term momentum, the RSI and MACD show weak underlying momentum.
US Dollar In Medium-Term Downtrend Vs Canadian Dollar
Key Highlights
- The US Dollar tumbled against the Canadian Dollar during the past few weeks and traded below 1.2200.
- There was a break below a monster bullish trend line with support at 1.3200 on the weekly chart of USD/CAD.
- Back to back interest rate hikes by the BoC prompted a sharp selling interest in USD/CAD.
- Canada's Housing Starts in August 2017 were 223.2K, more than the forecast of 212.0K.
USDCAD Technical Analysis
The US Dollar came under a lot of pressure recently against the Canadian Dollar and traded below 1.2200. The USD/CAD pair might gain bearish momentum since it is below the 100-week simple moving average.
Looking at the weekly chart of USD/CAD, it seems like the pair formed a major top at 1.3800 in April 2017. It started a downside move and traded below a monster bullish trend line with support at 1.3200.
The pair also broke the 50% Fib retracement level of the last wave from the 1.1919 low to 1.4689 high. There was even a close below 1.2100 and the 200-week simple moving average. It is a strong bearish sign and points further declines below 1.2000.
Therefore, there are high chances of USD/CAD testing the last swing low of 1.1919. If sellers remain in control, the pair might even test the 1.1236 extension of the last wave from the 1.1919 low to 1.4689 high during the coming weeks.
Canada's Housing Starts
Recently in Canada, the Housing Starts figure for August 2017 was released by the Canadian Mortgage and Housing Corporation. The market was looking 212.0K, less than the last 222.3K.
However, the actual result was better than the forecast, as the Housing Starts were 223.2K. On the other hand, there was a minor revision for the last reading from 222.3K to 222.0K.
Commenting on the data, CMHC's chief economist, Bob Dugan, stated:
Canada's trend in housing starts was above the 200,000 unit mark for the eighth consecutive month. Demand for new homes remains strong, consistent with consumer confidence which reached its highest level in ten years.
Overall, it seems like the USD/CAD pair is likely to remain in a downtrend and could even trade towards 1.1800 in the medium term.