Sample Category Title
GBPUSD Struggles To Find Direction, Maintains Range Below 1.32 After Recent Rally Fizzles Out
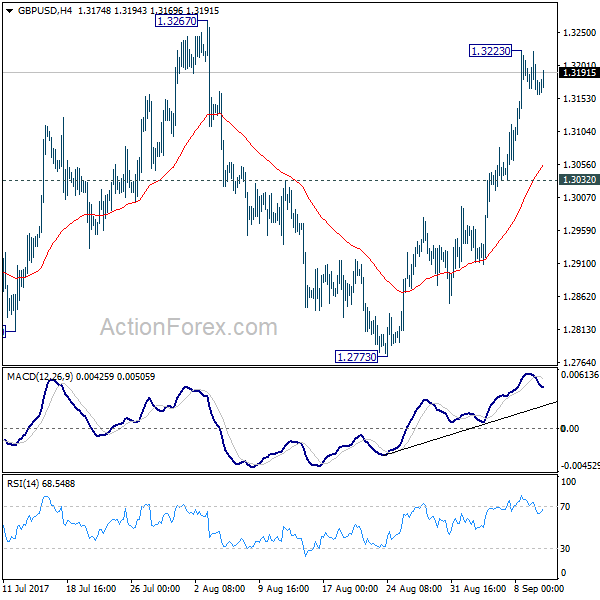
GBPUSD turned increasingly bullish in the short term after crossing above the 50-day moving average and key 1.3000 level on September 5. The odds for a bounce higher have diminished though since prices moved back below 1.3200 after hitting a high of 1.3223 this week.
Upward momentum was not maintained as the market became overextended. This is evident in the stochastics and RSI which reached overbought levels (above 80 and near 70 respectively). Consequently, AUDUSD retreated from 1.3223.
In the near term, there is limited downside risk as trend signals are bullish. The 50-day and 200-day moving averages are positively aligned after a bullish crossover in mid-May. Firm support is expected at 1.3000 and at the 50-day moving average. A drop below support at 1.2773 (August 24 low) and below the 200-day MA would bring a little more softness in the outlook for GBPUSD.
Any gains above the 1.3200 resistance level would see a move to re-test the previous high at 1.3267 and shift the bias to a more bullish one. Clearing this top would open the way to target the next major peak from a year ago at 1.3444.
Looking at the medium-term picture, it appears that the market has been ranging since July and has been pivoting around the key 1.3000 level, giving a neutral bias. Trend indicators are neutral to bullish and have not given any signs of a reversal yet. The recent strong rally from the sub-1.2800 area has lost steam at 1.3200, keeping the past 2-month range intact. The short-term bull run from sub-1.2800 has room to advance higher.
Market Concerns Abate: Risk-On Sentiment Improves
A degree of risk-on sentiment returned to the markets on Monday and in early Tuesday trading. The economic impact of Hurricane Irma, now downgraded to a tropical storm, appears to be less than originally predicted. The hardest hit region, Florida, still has millions without power and, whilst the damage caused by Irma will take weeks to recover from, the region appears to have fared better than many had initially forecast.
The markets were concerned that North Korea may celebrate their Founding Day public holiday with new missile or nuclear tests. With no such tests having occurred, concern turned to the reaction from North Korea in regards to the latest UN Security Council sanctions. The latest sanctions have imposed a ban on North Korea's textile exports and capping imports of crude oil, which were less severe than Washington had proposed. North Korea has not responded to these latest sanctions against the country. These 2 factors helped USD to recover on Monday as the markets moved away from safe havens and adopted a more risk-on sentiment.
EURUSD fell back from Friday's 32 month high of 1.2092 to trade as low as 1.19455 in early Tuesday trading. Currently, EURUSD is trading around 1.1950.
USDJPY gained from Friday's 10 month low of 107.32 to currently trade around 109.44.
GBPUSD is relatively flat overnight, currently trading around 1.3172.
Gold, with risk-on appetite returning, gave up recent gains, falling back from Friday's 12-month high of $1357.4 to currently trade around $1,323.
WTI gained over 1% on Monday and is currently holding steady, trading around $48.45.
At 09:30 BST, UK National Statistics will release Consumer Price Index (YoY) for August. Inflation has been steadily rising in the UK and the latest forecast suggests this trend is continuing. The previous release of 2.6% is expected to be beaten with this release, with a consensus of 2.8%. Such increases do leave the “door open” for the Bank of England to hike interest rates, but that is unlikely with the current sluggish growth in the UK.
Currencies: Is There Enough Ammunition For Further USD Gains?
Sunrise Market Commentary
- Rates: US yields back above key levels (previous support)
US 5-yr (1.7%), 10-yr (2.1%), and 30-yr (2.68%) yields closed back above key support levels lost last week. The crisis atmosphere made room for more positive risk sentiment. Could it mark the start of a consolidation phase going into next week's FOMC meeting? Markets are currently very dovish positioned after this Summer's uninterrupted decline in yields. - Currencies: Is there enough ammunition for further USD gains?
The dollar rebounded yesterday as the negative premium on last week's event risk was priced out. Especially USD/JPY succeeded a nice comeback. Today, there is little economic news to guide trading. The dollar rebound might slow, awaiting more news on the economic front or on other market-sensitive event risk (North Korea).
The Sunrise Headlines
- US equities joined the risk-on correction (>+1%) after a feared missile launch from North Korea never materialized and Irma was downgraded. Asian equity indices remain in positive territory this morning with Japan outperforming.
- One of the UK's biggest constitutional changes in decades came a significant step closer in today's early hours when MPs voted by a majority of 36 to move the EU Withdrawal Bill on to the next stage of parliamentary scrutiny.
- The UN Security Council unanimously adopted new sanctions against North Korea after US officials eased their demands to convince China and Russia to approve the measure.
- US inflation expectations slipped last month, with the year-ahead measure hitting its lowest level since early 2016, according to a Federal Reserve Bank of New York survey that adds to the din of surprisingly weak price measures.
- Norway's centre-right government has won a historic re-election, benefiting from a recent economic upturn and record use of money from its sovereign wealth fund. It will become the 1st right administration to serve out 2 full terms.
- Brussels will push for more thorough vetting of Chinese and other foreign investments as it seeks a more muscular trade policy to respond to criticism that the bloc does not do enough to protect its own companies.
- Today's calendar remains rather thin with only US NFIB Small Business Optimism and UK inflation data. The Netherlands and the US supply the bond market and ECB's Constancio is scheduled to speak
Currencies: Is There Enough Ammunition For Further USD Gains?
Has the USD rebound further to go?
Investors left last week's defensive bias yesterday as the damage of hurricane Irma might be less than feared. Core/US yields and equities rebounded, with the S&P closing at an all-time high. The positive context supported the dollar. USD/JPY rebounded sharply and closed the session at 109.39 (from 107.84 on Friday). The gain against the euro was more modest. EUR/USD finished at 1.1953 (from 1.2036). Comments from ECB's Coeure suggested that the ECB is not yet overly worried on the rise of the euro, but the issue is on the radar.
The risk rebound continues in Asia this morning. Japan outperforms on yesterday's sharp decline of the yen. Gains on most other markets are modest. The dollar maintains yesterday's gains against the euro and the yen, but there is no additional progress. The UN security council approved a watered-down US proposal on additional sanctions against North Korea. Markets ponder the chances on a possible reaction of North Korea. The yuan declines further as recent measures from the PBOC suggest that the central bank doesn't want a further rise of its currency.
There are again no important eco data in EMU. In the US, the NFIB small business confidence and the JOLTS job openings provide valuable info on the health of the US economy, but the series are no market movers. An unexpected decline in the NFIB sentiment might be slightly negative for the dollar. Global sentiment will probably remain the main driver for USD trading. Speeches from ECB members are a wildcard for the euro. Of late, Draghi and Co slightly reinforced their rhetoric on the impact of the stronger euro. However, they didn't sound overly worried and the (FX) market doesn't see it as a good enough reason to really delay APP tapering. So, for now, the ECB isn't a real negative for the euro yet. On the USD side of the equation, the dollar enjoyed a relief rally yesterday as the impact of potential effect risk (Irma, North Korea) subsided. A USD negative risk premium was priced out, but is there a strong enough story for sustained further USD gains? A reaction of North Korea to the new UN sections is possible and might slow the risk rally and/or the rebound of the dollar. At the same time, the impact of the hurricanes on the US economy remains unclear and this issue won't be clarified anytime soon. In this context, a forceful rebound of the dollar is not evident. Some ST consolidation might be on the cards, but the dollar remains vulnerable for all kinds of negative event risk. Interesting to see whether the US currency can extend yesterday's positive repositioning
Global context. Last week, the euro remained strong even as the ECB delayed communication on APP tapering till October and as Draghi kept a soft tone. Markets take the view that ECB policy normalisation will come anyway. At the same time, the dollar lost further interest rate support as global uncertainty kept US yields on a downward trajectory. The decline in US yields and of the dollar has probably gone far enough given recent US eco data, which were still fairly good. However, until now this assessment didn't help the dollar shortterm.
The dollar in the first place needs an improvement in global sentiment and higher yields. US data will probably become noisy due to the impact of the hurricanes. This might cloud the Fed outlook and complicate a USD rebound. Dollar sentiment remains fragile and this is visible in the technical picture of both EUR/USD and USD/JPY. EUR/USD last week set a minor new correction top at 1.2092. A return below 1.1823 would be a technical sign that the EUR/USD rally has run its course short-term. We are not that far yet. USD/JPY regained the previous range bottom at 118.13, but more confirmation is needed to conclude that the dollar is bottoming.
EUR/USD correcting of recent top, but technical picture hasn't changed
EUR/GBP
EUR/GBP correction continues
The sterling rebound that started end of August simply continued yesterday. The move was most visible against the euro as EUR/USD eased off last week's top. EUR/GBP set a new ST correction low and finished the day at 0.9080 (from 0.9119). There were no UK eco data. Investors perhaps reduced sterling shorts further ahead of Thursday's BoE policy meeting. The UK government received approval of Parliament to progress with the Brexit bill. The rise of sterling against the dollar stalled on the overall rebound of the dollar. Cable finished the day at 1.3163 (from 1.3200), but the recent top stays within reach.
UK CPI data will be published today. Headline CPI is expected to rise 0.5% M/M and 2.8% Y/Y. The consensus for core inflation stands at 2.5% Y/Y (from 2.4%). Markets will read the CPI with Thursday's BoE meeting in mind. At the August meeting, the BoE kept a wait-and-see modus and signalled no immediate rate hike. We don't expect a U-turn, but the decline of sterling and inflation near 3% might again slightly change the balance in the BoE assessment between lower growth and higher inflation. In such a scenario, markets might also raise the chance on a rate hike, supporting the corrective rebound of sterling.
From a technical point of view, EUR/GBP cleared 0.8854/80 resistance (top end June), opening the way a protracted August rebound. The move was the result of euro strength. Simultaneously, UK price data were soft enough to keep the BoE side-lined. MT, we maintain a buy EUR/GBP on dips approach as we expect the combination of relative euro strength and sterling softness to persist. The 0.9415 ‘flash-crash spike' is the next target on the charts. However, we let the current correction do its job, e.g. to the technical support in the 0.88/89 area, to sell sterling again versus the euro.
EUR/GBP: correction continues ahead of key data and BoE policy
Daily Technical Outlook And Review: EUR/USD, GBP/USD, AUD/USD, USD/JPY, USD/CAD, USD/CHF, DOW 30, GOLD
A note on lower timeframe confirming price action...
Waiting for lower timeframe confirmation is our main tool to confirm strength within higher timeframe zones, and has really been the key to our trading success. It takes a little time to understand the subtle nuances, however, as each trade is never the same, but once you master the rhythm so to speak, you will be saved from countless unnecessary losing trades. The following is a list of what we look for:
- A break/retest of supply or demand dependent on which way you're trading.
- A trendline break/retest.
- Buying/selling tails ... essentially we look for a cluster of very obvious spikes off of lower timeframe support and resistance levels within the higher timeframe zone.
- Candlestick patterns. We tend to only stick with pin bars and engulfing bars as these have proven to be the most effective.
We typically search for lower-timeframe confirmation between the M15 and H1 timeframes, since most of our higher-timeframe areas begin with the H4. Stops are usually placed 1-3 pips beyond confirming structures.
EUR/USD
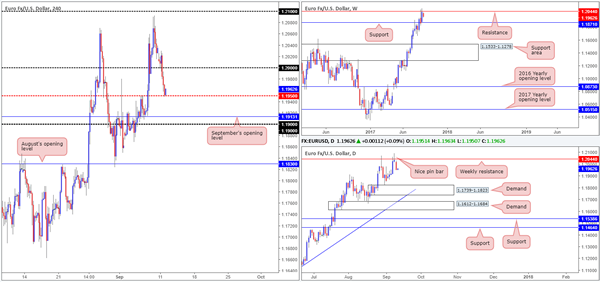
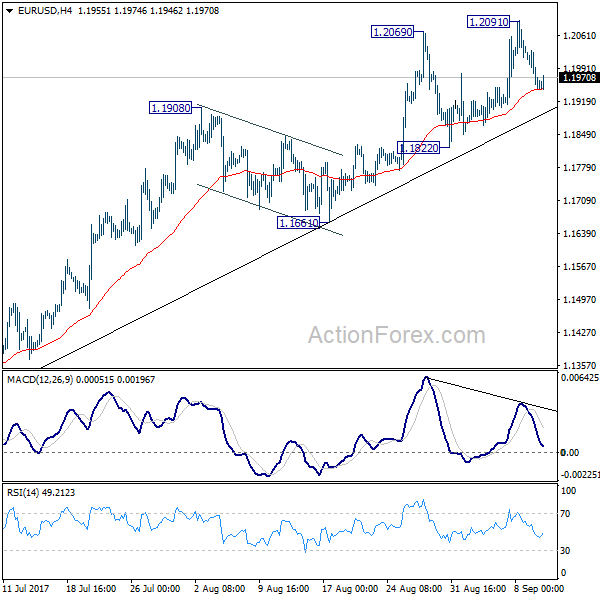
Despite a moderate bounce seen from the large psychological level 1.20 in early London on Monday, the shared currency spent the remainder of the day under pressure. Consequent to a strong dollar advance, the pair concluded the day shaking hands with a H4 mid-level support at 1.1950.
Yesterday's downside push was also likely influenced by the current weekly resistance in play at 1.2044 and Friday's closing bearish pin bar. Should price continue to fall from here, the next support target in the firing range can be seen on the weekly timeframe at 1.1871, followed closely by daily demand plotted at 1.1739-1.1823.
Suggestions: With the bigger picture suggesting that further selling could be seen down to at least the 1.1871 mark, a short beyond 1.1950 could be an option today. In addition to this, we also see that the USDX shows room for the currency to appreciate up to as far as the weekly resistance at 11854, thus further bolstering EUR sellers.
A H4 close beyond 1.1950, along with a retest and a lower-timeframe confirming sell signal (see the top of this report for information on how to use lower-timeframe structure) would, in our view, be enough to warrant a sell trade here. Nevertheless, do make sure that you monitor the trade since H4 price may stall at September's opening line drawn from 1.1913/1.19 handle.
Data points to consider: No high-impacting news events scheduled for release today.
Levels to watch/live orders:
- Buys: Flat (stop loss: N/A).
- Sells: Watch for H4 price to engulf 1.1950 and then look to trade any retest seen thereafter ([waiting for a lower-timeframe sell signal to present itself following the retest is advisable] stop loss: dependent on where one confirms the number).
GBP/USD:
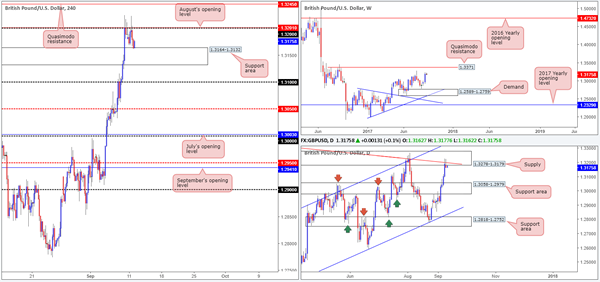
As can be seen from the H4 chart, the British pound was unable to muster enough strength to close beyond the 1.32 handle on Monday, despite an earnest attempt from the bulls during London. The move brought the candles down to a nearby support area placed at 1.3164-1.3132, which, as you can see, is currently reinforcing the unit at the moment.
Weekly price, in our view, maintains a bullish view due to room being seen for the pair to rally up to as far as the Quasimodo resistance level at 1.3371. On the other side of the coin, however, daily action is seen crossing swords with supply at 1.3278-1.3179 (boasts a nice-looking trendline resistance taken from the high 1.3480). Also noteworthy is the USDX shows room for the currency to advance up to the weekly resistance at 11854.
Suggestions: With weekly price showing gains could be on the horizon, daily price trading at supply and H4 action showing interest from a support area, where does one step from here?
Well, a buy in this market will, of course, place you against daily flow. However, another cautionary point to consider is how close the 1.32 handle is positioned. Shorts, from our perspective, are just as challenging. Not only do you have the current H4 support area in view, but you may also be selling into potential weekly flow.
Given the above notes, the desk has opted to remain on the sidelines for the time being.
Data points to consider: UK Inflation figures at 9.30am GMT+1.
Levels to watch/live orders:
- Buys: Flat (stop loss: N/A).
- Sells: Flat (stop loss: N/A).
AUD/USD
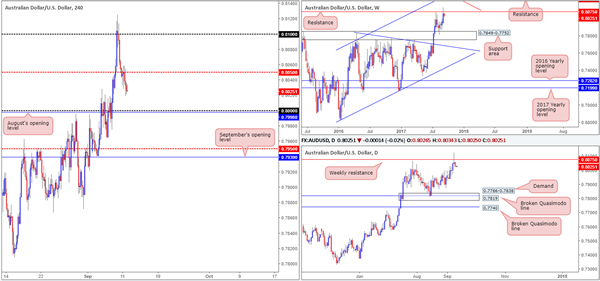
Using a top-down approach this morning, we can see weekly price beginning to ease from resistance plotted at 0.8075. Providing that the bears remain in the driving seat here, the next downside target in view is the support area positioned at 0.7849-0.7752. On top of this, traders may have also noticed that Friday's trade chalked up a nice-looking bearish pin bar from the noted weekly resistance. To our way of seeing things, downside looks relatively cramped on the daily scale with little clear demand seen until we revisit the 0.7786-0.7838 area.
For those who read Monday's report you may recall us mentioning that if the H4 mid-level support at 0.8050 was consumed, coupled with a retest and a reasonably sized H4 bearish candle in the shape of a full, or near-full-bodied formation, we would look to sell. With the setup coming to fruition yesterday, we took a short trade from 0.8038 and placed a stop at 0.8060 (two pips above the rejection candle's wick).
Suggestions: For traders who also managed to short this market, we'll be looking to take partial profits around the key 0.80 level/August's opening line at 0.7998. Beyond here, the H4 mid-level support at 0.7950 looks attractive, followed closely by September's opening level at 0.7939.
Data points to consider: No high-impacting news events scheduled for release today.
Levels to watch/live orders:
- Buys: Flat (stop loss: N/A).
- Sells: 0.8038 ([live] stop loss: 0.8060).
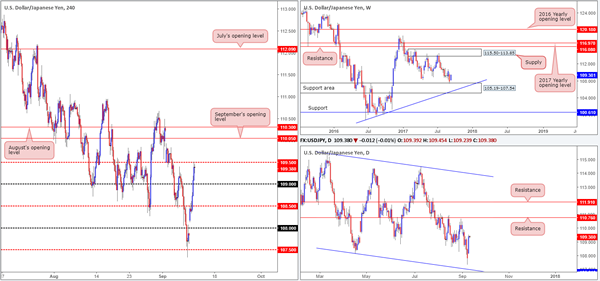
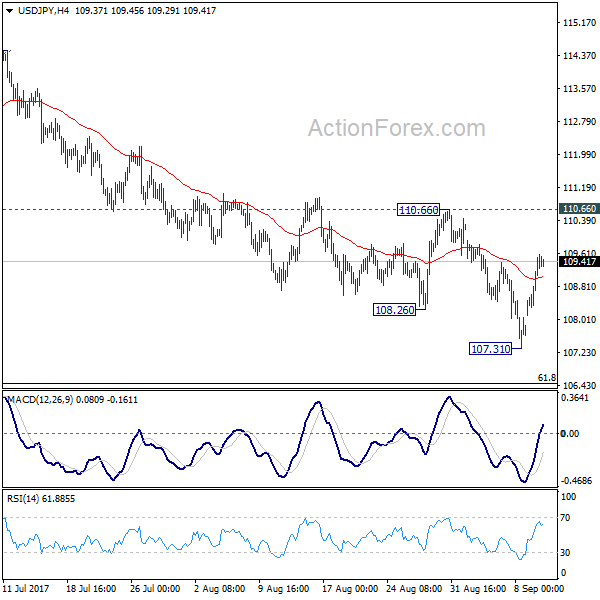
USD/JPY:
Leaving the weekend gap unfilled, recent action shows the USD/JPY extended Friday's bounce from the H4 mid-level support at 107.50 on Monday. Taking out both H4 mid-level resistance at 108.50 and the 109 handle, price was able to connect with the H4 mid-level resistance at 109.50 by the day's end.
According to the USDX charts, the currency has room to advance up to as far as weekly resistance pegged at 11854. Similarly, both the weekly and daily charts on the USD/JPY also show room for further upside. Weekly action is currently trading from a support area at 105.19-107.54, with room to rally north as far as supply coming in at 115.50-113.85. On the daily timeframe, however, the next upside hurdle is seen at 110.76 (a resistance level).
Suggestions: We see two possible scenarios playing out today:
1. A close above 109.50. This – coupled with a retest and a lower-timeframe buy signal could provide one entry into the market (see the top of this report for information on how to use structure on the lower timeframes for entry), targeting September's opening line at 110.05, followed closely by August's opening level at 110.30.
2. A retest of the 109 handle. Similar to option 1, could also be an option should this retest be accompanied by a lower-timeframe buy signal, targeting 109.50 as an initial take-profit zone.
Data points to consider: No high-impacting news events scheduled for release today.
Levels to watch/live orders:
- Buys: Watch for price to engulf 109.50 and then look to trade any retest seen thereafter ([waiting for a lower-timeframe confirming signal to form following the retest is advised] stop loss: dependent on where one confirms this number). 109 region ([waiting for a lower-timeframe confirming signal to form is advised] stop loss: dependent on where one confirms this number).
- Sells: Flat (stop loss: N/A).
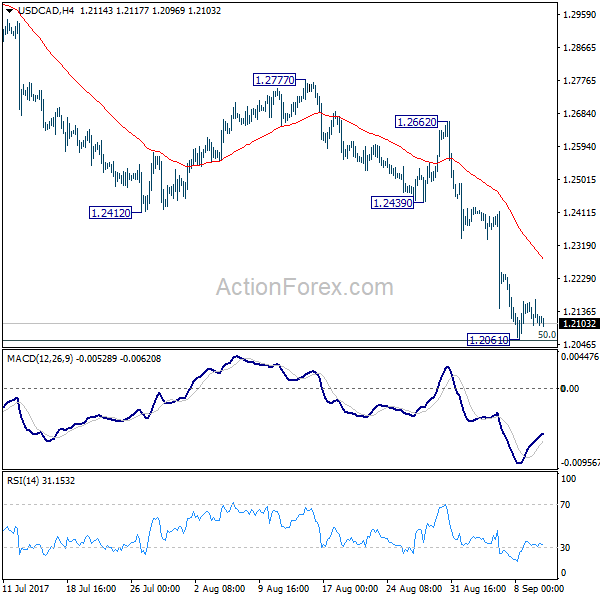
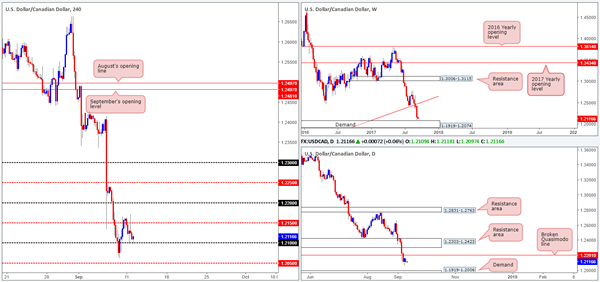
USD/CAD
Although weekly activity recently clashed with demand at 1.1919-1.2074, there has been little bullish intent registered from here. Technically speaking, this likely has something to do with H4 candles failing to muster enough strength to take out the mid-level resistance at 1.2150. However, even if H4 price manages to hold above 1.2150, the path north is still paved with obstacles.
Not only do we have a weekly resistance plotted on the USDX weekly chart at 11854, we also see a nearby daily broken Quasimodo line at 1.2201 on the loonie chart, followed closely by a resistance area at 1.2303-1.2423. Couple this with a strong down trending market, and buys no longer appear as attractive as they initially did from the weekly chart!
Suggestions: Despite weekly demand in play, we are not looking to become buyers in this market right now. A decisive close below 1.21 could, therefore, open the trapdoor down to H4 mid-level support at 1.2050, shadowed closely by the top edge of daily demand at 1.1919-1.2006.
Data points to consider: No high-impacting news events scheduled for release today.
Levels to watch/live orders:
- Buys: Flat (stop loss: N/A).
- Sells: Watch for H4 price to engulf 1.21 and then look to trade any retest seen thereafter ([waiting for a H4 bearish candle to form following the retest – preferably in the shape of a full, or near full-bodied candle – is advised] stop loss: ideally beyond the candle's wick).
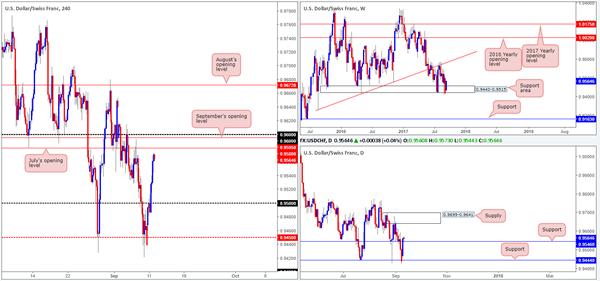
USD/CHF:
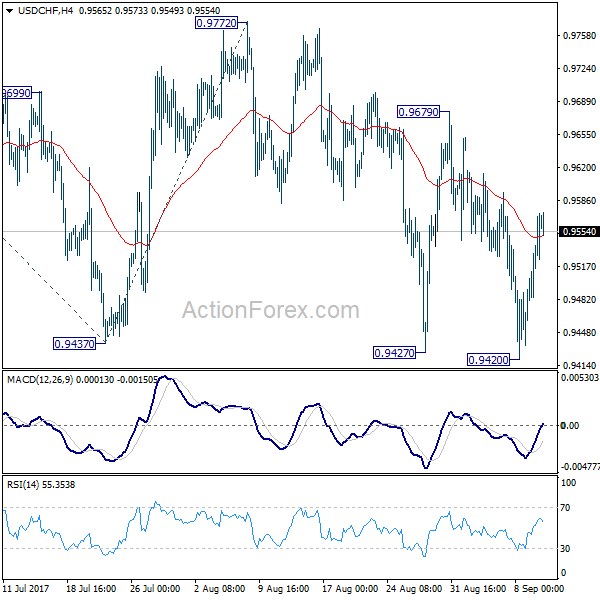
The USD/CHF maintained its bullish stance on Monday, consequently breaking through the 0.95 handle and closing the day just ahead of July's opening level at 0.9580. Adding to that, the unit also crossed above daily resistance pegged at 0.9546 (now an acting support) and has possibly opened up the path north to supply drawn from 0.9699-0.9641. This – coupled with weekly price trading from a support area at 0.9443-0.9515, certainly places bulls in a favorable position this morning.
While we cannot deny the buyers do look in fine form at the moment, the bull run could be tested today as not only is there July's opening level seen just ahead, there's also September's opening line at 0.9595, as well as the 0.96 handle!
Suggestions: Usually, we would simply wait for the buyers to close price above the noted H4 resistances, and then proceed to look for buys. However, 40 pips above 0.96 we have the lower edge of daily supply positioned at 0.9641! Therefore, to trade above 0.96, you would have to make sure that you have adequate risk/reward in place once price struck the 0.9640 mark. If not, it would not be a trade worth taking, in our humble opinion.
Data points to consider: No high-impacting news events scheduled for release today.
Levels to watch/live orders:
- Buys: Flat (stop loss: N/A).
- Sells: Flat (stop loss: N/A).
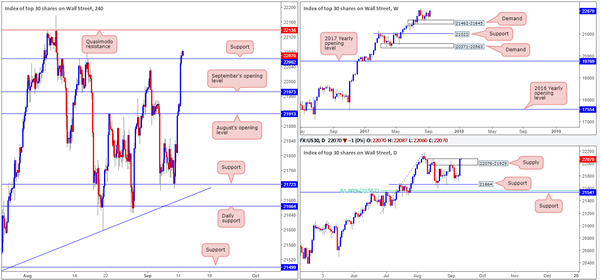
DOW 30
Hurricane Irma threat has receded and caused less damage than anticipated, consequently lifting US equity prices higher on Monday. The index, as you can see, ran through both August and September's opening levels at 21913/21973, as well as H4 resistance at 22062. What's more, we also saw daily price close around the top edge of a daily supply base carved from 22076-21929. Up on the weekly timeframe, however, price remains afloat above demand at 21462-21645 with little overhead resistance to contend with.
Suggestions: Having seen price already respect the recently engulfed H4 resistance as support, along with both weekly and daily price looking as though they'll both stretch further north, a long from this region is of interest this morning.
Ultimately, we're looking for a second retest of the H4 support line along with a reasonably sized H4 bull candle. Assuming we see this take shape, a long position will be executed, targeting the H4 Quasimodo resistance at 22138 as an initial take-profit line.
Data points to consider: No high-impacting news events scheduled for release today.
Levels to watch/live orders:
- Buys: 22062 region ([waiting for a reasonably sized H4 bullish candle to form – preferably a full, or near-full-bodied candle – is advised] stop loss: ideally beyond the candle's tail).
- Sells: Flat (stop loss: N/A).
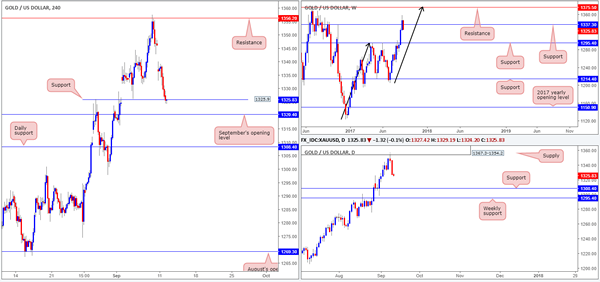
GOLD:
Following Monday's somewhat aggressive opening gap, the metal entered into a temporary consolidation, before turning red and pushing down to H4 support pegged at 1325.9. Looking at how deep price has pressed below the support, our guess is the majority of stops have already been triggered, thus potentially opening the market up to a move down to September's opening level at 1320.4.
Weekly price, as you can see, has crossed back below support at 1337.3 and may now be heading down to support coming in at 1295.4. Down on the daily timeframe, Friday's rejection from supply at 1367.3-1354.2 saw strong sellers enter the market on Monday, placing support at 1308.4 in the firing range.
Suggestions: We really like the look of September's opening line at 1320.4 as a possible buy zone today. This may seem a little risky given both weekly and daily timeframes show further downside could be on the cards. However, take a look at the USDX chart – price is nearing weekly resistance at 11854. A dollar move up to this weekly level could see the dollar collapse and therefore push the yellow metal higher!
Before a long can be considered from 1320.4, nevertheless, we would advise waiting for a lower-timeframe confirming signal to take shape (see the top of this report for information). This will help gauge whether buying pressure is present or not.
Levels to watch/live orders:
- Buys: 1320.4 region ([waiting for a lower-timeframe confirming buy signal to form is advised] stop loss: dependent on where one confirms this area).
- Sells: Flat (stop loss: N/A).
Daily Technical Analysis: EUR/USD Builds ABC Retracement Back To Support Trend Line
Currency pair EUR/USD
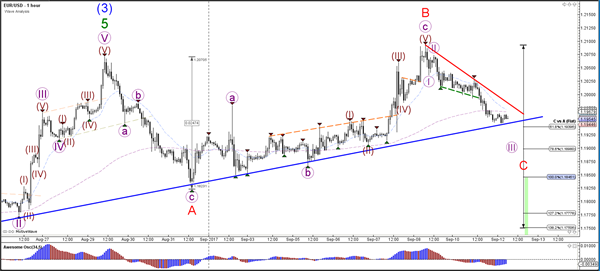
The EUR/USD continued to move lower as it approaches the support trend line (blue) yet again. The bearish bounce is indicating that the recent bullish momentum is probably a wave B (red), which is part of a larger ABC (red) correction.
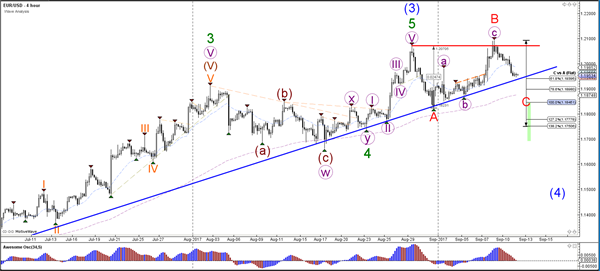
The EUR/USD did not confirm the bullish break yesterday and in fact invalidated the bullish wave 4. A bearish 5 wave pattern seems to be unfolding within wave C (red).
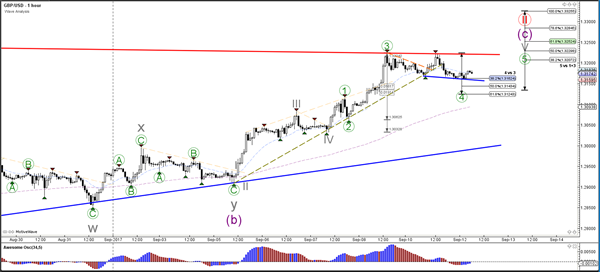
Currency pair GBP/USD
The GBP/USD is challenging a deep 88.6% resistance Fibonacci retracement level of wave 2 vs 1 (red). A break above the 100% Fib level invalidates that wave 2 (red). Price could either be in an ABC (purple) correction or in a wave 123.
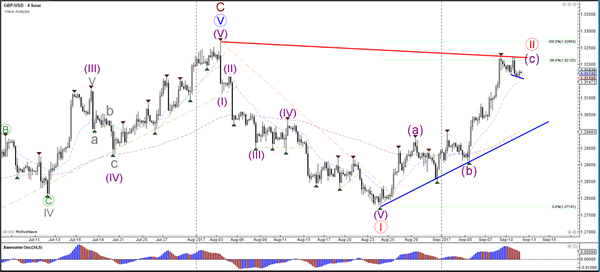
The GBP/USD is retested an important resistance trend line (red) but failed to break above it. This could have completed wave 5 (green) if price manages to break below the 61.8% Fib of wave 4 vs 3.
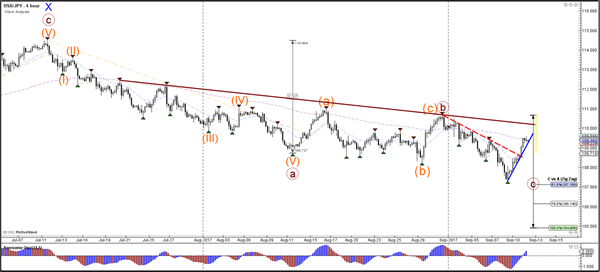
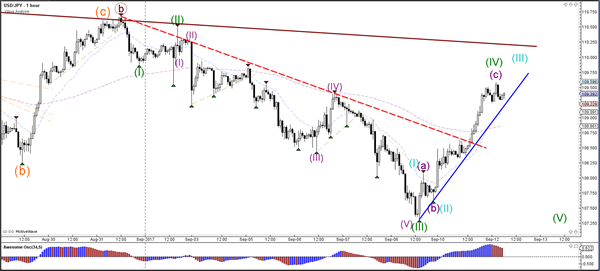
Currency pair USD/JPY
The USD/JPY showed a strong bullish reaction at the 61.8% Fibonacci target of wave C vs A (brown), which could indicate a change of trend direction. A break above resistance (brown) would confirm that. A break below support (blue) could price challenge the bottom.
The USD/JPY is showing strong bullish momentum, which makes a wave 4 (green) unlikely but price needs to break above 109.87 to invalidate it. The alternative is a 123 (blue) bullish wave count.
EUR/USD Daily Outlook
Daily Pivots: (S1) 1.1923; (P) 1.1976 (R1) 1.2005; More...
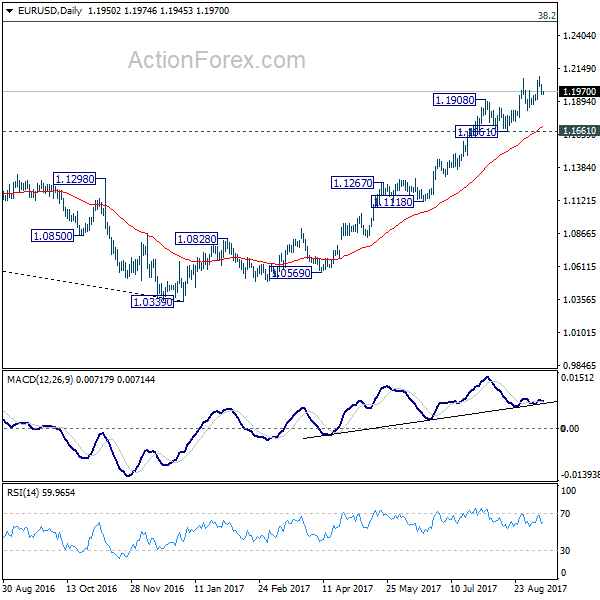
Intraday bias in EUR/USD remains neutral at this point. Overall, outlook remains bullish as long as 1.1822 support holds. Above 1.2091 will extend larger rise fro 1.0339 and target next key fibonacci level at 1.2516. But considering bearish divergence condition in 4 hour MACD, break of 1.1822 will confirm short term topping and bring deeper fall back to 1.1661 support and below.
In the bigger picture, rise from medium term bottom at 1.0339 is still in progress for 38.2% retracement of 1.6039 (2008 high) to 1.0339 (2017 low) at 1.2516. However, it should be noted that there is no confirmation of trend reversal yet. That is, such rebound from 1.0399 could be a correction. And the long term fall fro 1.6039 (2008 high) could resume. Hence, we'd be cautious on strong resistance from 1.2516 to limit upside. But after all, break of 1.1661 is needed to indicate medium term topping. Otherwise, outlook will remain bullish in case of pull back.
GBP/USD Daily Outlook
Daily Pivots: (S1) 1.3141; (P) 1.3182; (R1) 1.3203; More...
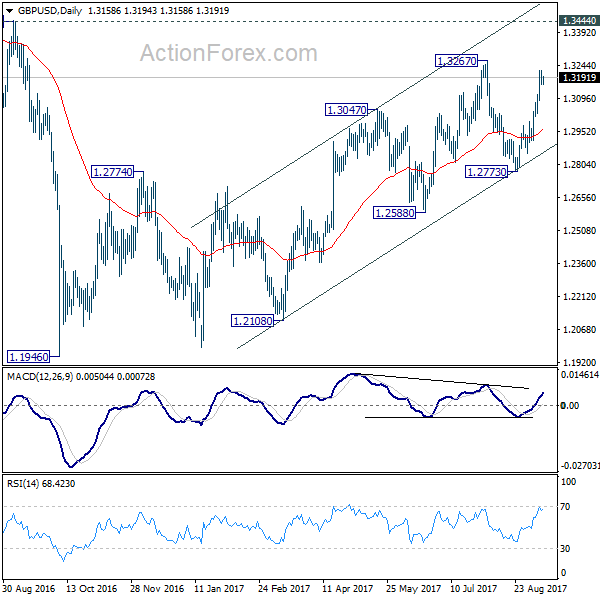
A temporary top is in place at 1.3223 in GBP/USD and intraday bias is turned neutral first. Further rally is expected as long as 1.3032 support holds. Above 1.3223 will target 1.3267 first. Break will resume whole rise from 1.1946 and target 1.3444 key resistance next. But again, price actions from 1.1946 are still seen as a corrective pattern. Hence, we'd expect strong resistance from 1.3444 to limit upside to bring larger down trend reversal eventually. On the downside, break of 1.3032 will indicate near term reversal and turn bias back to the downside for 1.2773 support instead.
In the bigger picture, overall, price actions from 1.1946 medium term low are seen as a corrective pattern. While further rise cannot be ruled out, larger outlook remains bearish as long as 1.3444 key resistance holds. Down trend from 1.7190 (2014 high) is expected to resume later after the correction completes. And break of 1.2773 support will be the first sign that such down trend is resuming.
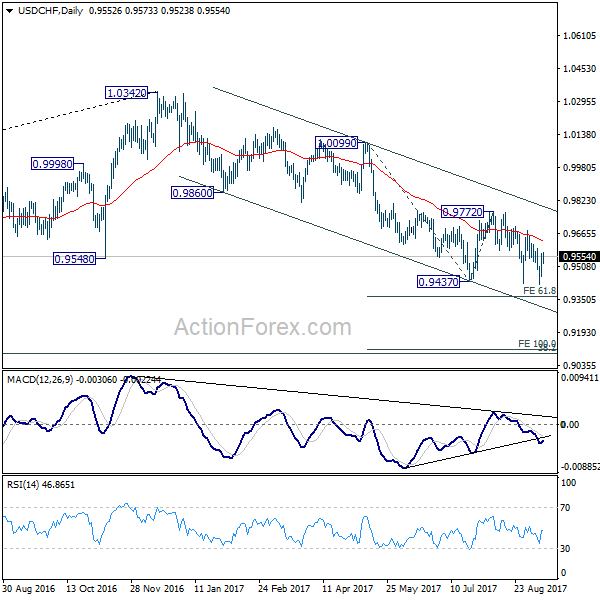
USD/CHF Daily Outlook
Daily Pivots: (S1) 0.9491; (P) 0.9529; (R1) 0.9603; More....
Intraday bias in USD/CHF remains neutral for consolidation above 0.9420 temporary low. But after all, near term outlook remains bearish as long as 0.9679 resistance holds. Deeper fall is still expected. Sustained break of 0.9420 will target 61.8% projection of 1.0099 to 0.9437 from 0.9772 at 0.9363 first. Break will target 100% projection at 0.9110 next.
In the bigger picture, current development suggests that 0.9443 key support (2016 low) could be taken out firmly as down trend form 1.0342 extends. There are various interpretation of the price actions. But in any case, medium term outlook will stay bearish as long as 0.9772 resistance holds. Current down trend could extend to 38.2% retracement of 0.7065 (2011 low) to 1.0342 (2016 high) at 0.9090. However, break of 0.9772 will indicate that USD/CHF has successfully defended 0.9443 again and turn outlook bullish for 1.0099 resistance.
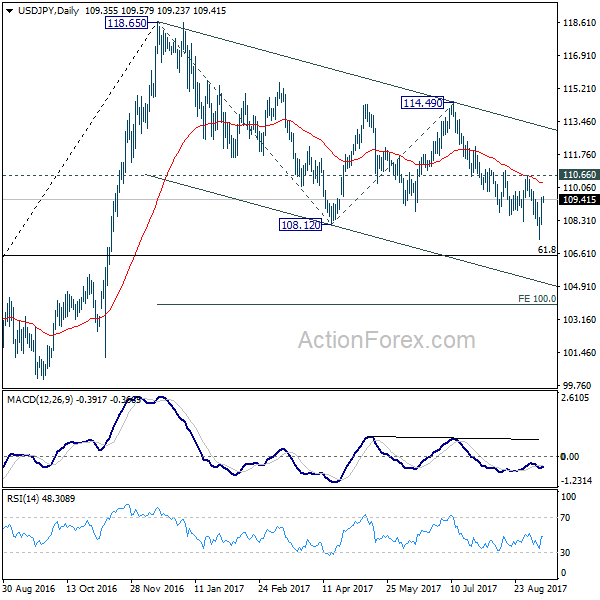
USD/JPY Daily Outlook
USD/JPY's rebound fro 107.31 extends today. But still it's staying well below 110.66 near term resistance. Outlook remains bearish with intraday bias staying neutral first. Below 107.31 will extend the whole fall from 118.65 to 61.8% retracement of 98.97 to 118.65 at 106.48 first. We'd look for support from there to bring rebound. But firm break of 106.48 will extend the decline to 100% projection of 118.65 to 108.12 from 114.49 at 103.96 or below.
Daily Pivots: (S1) 108.47; (P) 108.99; (R1) 109.88; More...
USD/JPY's rebound fro 107.31 extends today. But still it's staying well below 110.66 near term resistance. Outlook remains bearish with intraday bias staying neutral first. Below 107.31 will extend the whole fall from 118.65 to 61.8% retracement of 98.97 to 118.65 at 106.48 first. We'd look for support from there to bring rebound. But firm break of 106.48 will extend the decline to 100% projection of 118.65 to 108.12 from 114.49 at 103.96 or below.
In the bigger picture, rise from 98.97 (2016 low) is now seen as the second leg of the corrective pattern from 125.85 (2015 high). It's unclear whether this this second leg has completed at 118.65 or not. But medium term outlook will be mildly bearish as long as 114.49 resistance holds. And, there is prospect of breaking 98.97 ahead. Meanwhile, break of 114.49 will bring retest of 125.85 high. But even in that case, we don't expect a break there on first attempt.
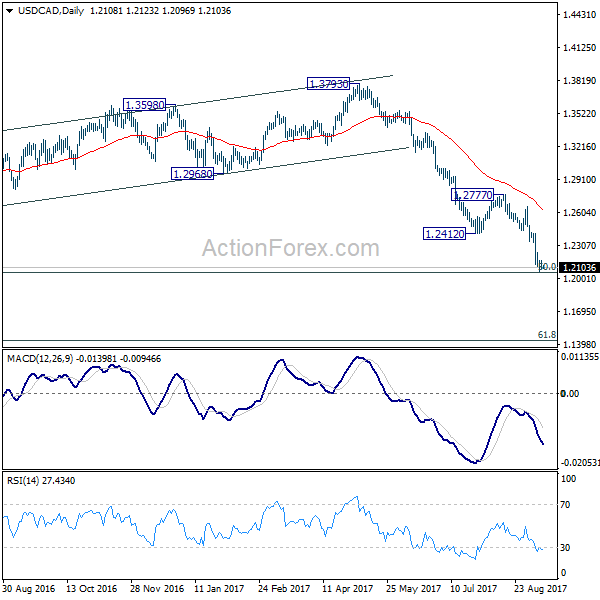
USD/CAD Daily Outlook
Daily Pivots: (S1) 1.2081; (P) 1.2125; (R1) 1.2154; More....
USD/CAD is staying consolidation above 1.2061 temporary low. Intraday bias remains neutral first. At this point, we'd remain cautious on strong support from 1.2048 long term fibonacci level to bring sustainable rebound. But still, break of 1.2439 support turned resistance is needed to be the first sign of trend reversal. Otherwise, outlook will remain bearish. Firm break of 1.2048 will pave the way to next fibonacci level at 1.1424.
In the bigger picture, current downside acceleration is raising the chance that whole long term rise from 0.9406 (2011 low), and that from 0.9056 (2007 low) is completed at 1.4689. Focus is now on 50% retracement of 0.9406 to 1.4869 at 1.2048. As long as this level holds, we'd still favor that case that fall from 1.4689 is a correction. However, firm break of 1.2048 will indicate that fall fro 1.4689 is at least a medium term down trend and should target 61.8% retracement at 1.1424 and below.