Sample Category Title
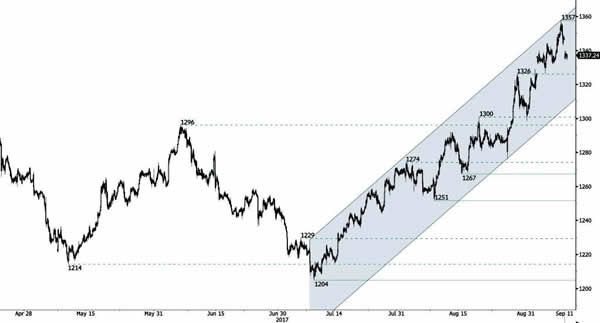
GOLD Consolidating Within Uptrend Channel
Gold has seen increased buying interest, clearing rising trend-line. Hourly support is given at a distance 1326 (gap low). Key resistance is located at 1375 (06/07/2016). Stronger support lies at 1204 (10/07/2017 high). Expected to show continued increase.
In the long-term, the technical structure suggests that there is a growing upside momentum. A break of 1392 (17/03/2014) is necessary ton confirm it, A major support can be found at 1045 (05/02/2010 low)
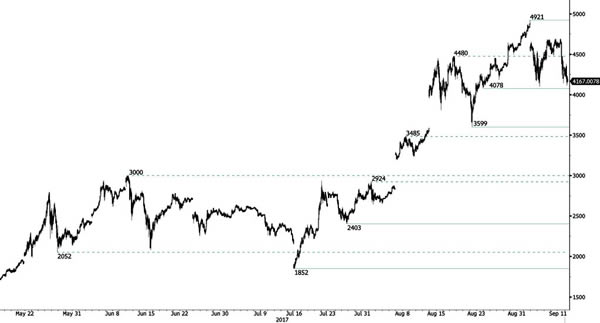
BITCOIN Consolidating Above $4000
Bitcoin has seen some buying interest. However, short term selling pressure suggests a limited upside potential. However, technical picture remain bullish as long as key support hold. Monitor the key support at 4078. Strong support lies very far at 3599 (22/08/2017 low). Key resistance can be located at 4921 (01/09/2017 high).
In the long-term, the digital currency has had an exponential growth. There are decent likelihood that the asset will reach $10'000.
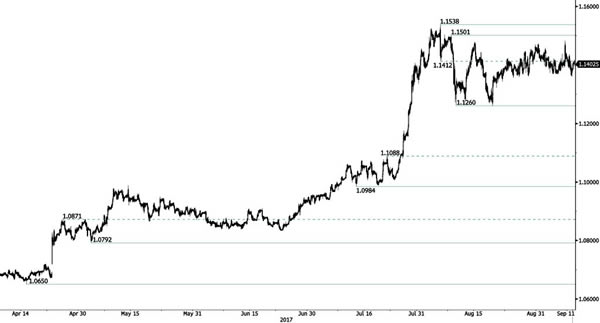
EUR/CHF Further Sideways Consolidation Likely
EUR/CHF has sharply declined near the resistance area between 1.1356 and 1.1472 Further medium-term sideways moves are favoured. Expected to show further sideways moves.
In the longer term, the technical structure has reversed. Strong resistance is given at 1.20 (level before the unpeg). Yet, the ECB's QE programme is likely to cause persistent selling pressures on the euro, which should weigh on EUR/CHF. Supports can be found at 1.0184 (28/01/2015 low) and 1.0082 (27/01/2015 low).
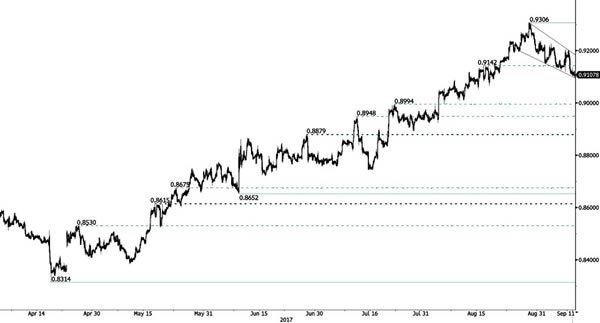
EUR/GBP Riding Lower
EUR/GBP has bounced off support. However, as long as prices remain below the resistance at 0.9176 (declining trendline), the short-term technical structure is biased to the downside. Hourly support is given at 0.9095 (11/09/2017). Resistance lies at 0.9306 (29/07/2017 high).
In the long-term, the pair has largely recovered from recent lows in 2015. The technical structure suggests a growing upside momentum. The pair is trading above from its 200 DMA. Strong resistance can be found at 0.9500 (psychological level).
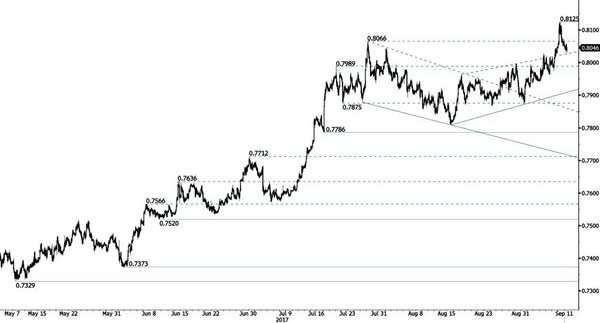
AUD/USD Bearish Consolidation
AUD/USD is now consolidating lower after the pair successfully tested the rising trendline support at 0.7881 and has broken the hourly resistance at 0.8066. Hourly support can be found at 0.8029 (intraday high). Key resistance is given at 0.8164 (14/05/2015 high). Expected to further consolidate.
In the long-term, the trend is largely negative since 2011. Key supports stands at 0.6009 (31/10/2008 low) . A break of the key resistance at 0.8295 (15/01/2015 high) is needed to invalidate our long-term bearish view.
So Far the US Dollar is Handling the Pressure
The US national debt topic is getting "hotter" day after day for a good reason. It's already September, and the US Congress has to consider the increase of the maximum possible amount of the national debt until the end of the month. It will be a difficult task, which may require more time than the politicians really have.
Right after the Labor Day, the US Congress went back to work after legislative recess. Its highest priority is the 2018 budget agreement and acceptance along with the national debt issue. Earlier, Steven Mnuchin, the US Secretary of the Treasury, warned that the national debt "ceiling" should have been considered as early as in spring.
Right now, the US national debt is a bit shy of 20 trillion USD. This number is more than the country's GDP, but it's okay for developed economies. If the debt is serviced in due time, there won't be any problems with it. However, in the USA, there is a legislatively accepted "ceiling" of the national debt. This year, members of the Congress have to revise it until September 29th.
There always is a chance that they won't make it in time. On several occasions in the past, there was a real drama about it and the decision was made just several hours before the "H-hour" while the stock and currency markets were swinging. The major political difference is that the Republicans are always in favor of decreasing the load on budget expenditures while the Democrats are against. Both parties fight for every cent, but eventually come to a consensus.
By the way, the latest news says that the members of the Congress have time: Trump asked the Congress for three more months, so now the deadline is December the 5th.
Discussions about the national debt "ceiling" increase are a very delicate topic for the US Dollar. While they are discussing the topic, the demand for "safe haven" assets may increase and the USD may come under even more pressure than now.
The technical picture of the EUR/USD pair shows a stable uptrend, which indicates that the loser here is the USD. The situation is evolving the favor of the Euro. Still, the situation may change in the short-term if the price doesn't break the high at 1.2070 reached on August 29th. However, if "bulls" succeed, the closest target will be at 1.2250, which is close to the upside border of the ascending channel. But again, if the above-mentioned high provides resistance, it may stop the impulse and start the Flat pattern with the support at the downside border of the current range. After the price finishes this pattern and breaking 1.2070 upwards, the upside target may change to 1.24. Also, one shouldn't ignore another scenario, which implies that the pair may beak the range downwards. In this case, the support level will be at 1.19. If the price breaks this level and fixes below it, investors may close their positions, all or partially. As a result, the instrument may continue falling towards 1.1550.
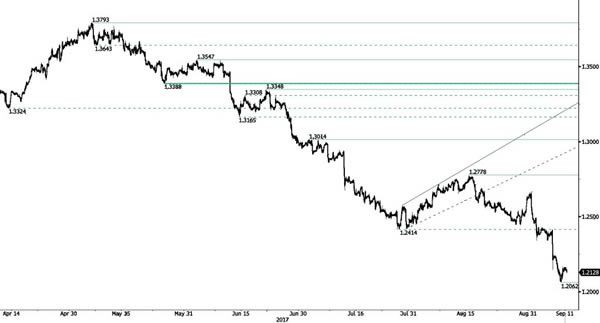
USD/CAD Bearish
USD/CAD is moving lower, confirming an underlying declining trend. Hourly support is located at 1.1945 (29/04/2015 low). Resistance is now given at a distance at 1.2778 (15/08/2017 low). Expected to show continued short-term bearish pressures.
In the longer term, the pair has broken longterm support that can be found at 1.2461 (16/03/2015 low). Strong resistance is given at 1.4690 (22/01/2016 high). The pair is likely to head further lower.
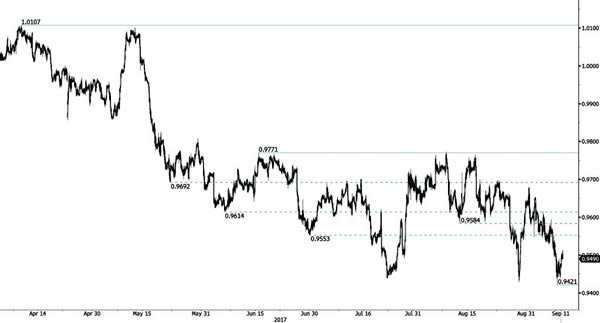
USD/CHF Challenging Support Area Above 0.9400
USD/CHF is trying to bounce. Strong resistance is given at 0.9771 (15/06/2017 high). The pair is likely to head further lower below 0.9421 (03/05/2017). Expected to show renewed bearish pressures.
In the long-term, the pair is still trading in range since 2011 despite some turmoil when the SNB unpegged the CHF. Key support can be found 0.8986 (30/01/2015 low). The technical structure favours nonetheless a long term bullish bias since the unpeg in January 2015.
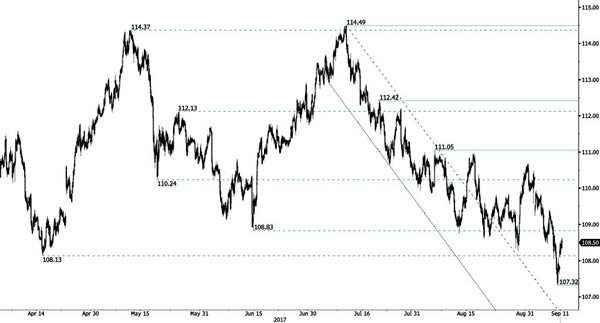
USD/JPY Bullish Consolidation
USD/JPY is consolidating higher but the trend is clearly negative. Strong support is located at 106.95 (08/09/2017 high). Expected to show further downside pressures.
We favor a long-term bearish bias. Support is now given at 99.02 (10/08/2013 low). A gradual rise towards the major resistance at 125.86 (05/06/2015 high) seems unlikely. Expected to decline further support at 93.79 (13/06/2013 low).
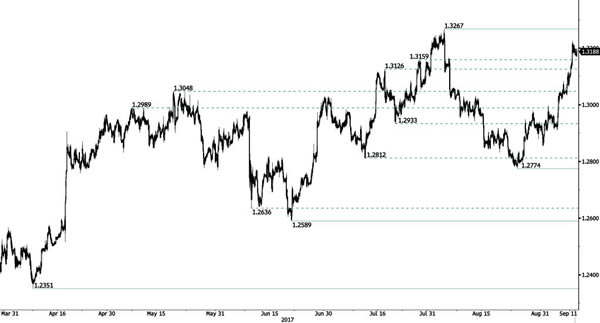
GBP/USD Strong Bullish Trend
GBP/USD has pushed above rising trend-line resistance, confirming an improving short-term technical structure. Strong support is given at 1.3023 (06/09/2017 low). Expected to show continued short-term bullish pressures toward resistance at 1.3267 (03/08/2017 high).
The long-term technical pattern is even more negative since the Brexit vote has paved the way for further decline. Long-term support can be found at 1.1841 (07/10/2017 low). Long-term resistance is given around 1.35 and would indicate a long-term reversal in the negative trend. Yet, it is very unlikely at the moment.