Sample Category Title
Canada: Home Starts Surprise to the Upside in August, as Ontario Homebuilding Rebounds
Canadian housing starts ticked up a hair (+1k) to 223k in August, well above expectations for a pull-back to 216k. This marks the third consecutive month of increases and the second highest level since March's blockbuster quarter-million print.
The single family segment (-2k) pulled back a touch while multifamily (+4k) homebuilding in large CMAs experienced an uptick on the month. Rural homebuilding was largely unchanged (-400) .
Provincially, the gains were all in Ontario (+16k), which had the second best month since January, while Quebec (+500) was largely flat. On the other hand, B.C. (-8k), Prairies (-3k) and Atlantic Canada (-1.5k) saw slower pace of homebuilding. In the Prairies, the losses in Alberta were nearly offset by gains in the other two provinces, while in Atlantic Canada the declines were across the board.
Activity in Toronto, the country's most closely-watched housing market, rose by nearly 10k to 54k - the fastest pace in a year and a half. On the other hand, starts in other major metros were mostly lower, with Vancouver and Montreal both down 7k to 21k and 14k, respectively.
Key Implications
This was a good report that suggests that the Canadian housing market remains quite strong after the wobble it suffered in the second quarter and the uncertainty of regulatory changes in Ontario and rising interest rates. In fact, the August print marks the second best month this year while the six-month moving average is nearing the 220k mark - the fastest pace since late-2012.
Ontario was behind much of the weakness in during Q2 after the provincial Fair Housing Plan, which implemented a broad set of policies designed to remove some froth from the market, injected significant uncertainty, and motivated homebuilders to sit back as the market digested the newly implemented policies. At this point, it would appear as if they're done sitting back, with strong demand owing to a robust economy motivating builders to ramp up production to compensate for the Q2 slowdown, and making Ontario the source of strength in the third quarter
All in all, we expect Canadian housing starts to remain relatively healthy in the coming months, but begin to trend lower as the effects of rising interest rates (another BoC hike likely later this year) and potential new regulation (the new B20 guidelines) gradually take a bite out of demand. Ultimately, starts should hold near the current levels in the next month or two, but trend towards the 200k level into early-2018 and fall below that threshold the year after.
Elliott Wave Analysis: USDCAD and Gold Intra-day View
Good day traders! Let's take a better look at USDCAD and Gold.
USD is looking for some support today, now also moving up against commodity currencies, as metals and oil prices come lower. We are looking at USDCAD which can be moving up now within wave 4 bounce that can face limited upside this week around 1.2238.
USDCAD, 1H
Decline on gold is quite sharp from end of last week; it looks impulsive so we are wondering if deeper correction is in play. Ideally that's wave A as part of a wave 4. If we are on the right track then there is room for a drop down to 1310/1315 this week, but after a short-term rally up in wave B.
GOLD, 1H
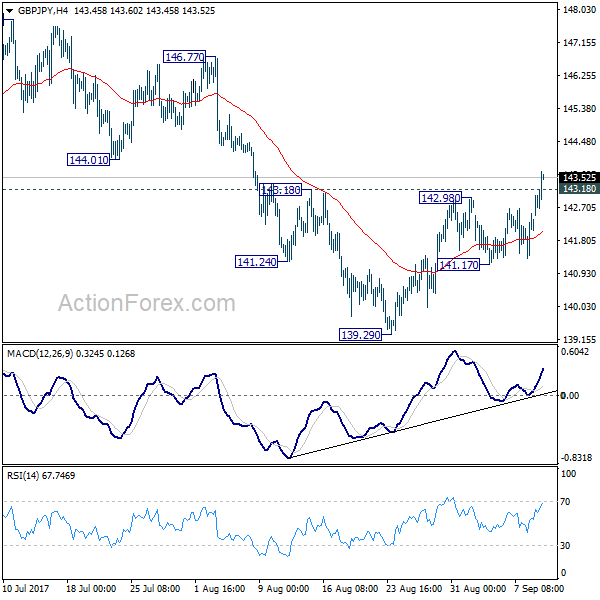
GBP/JPY Mid-Day Outlook
Daily Pivots: (S1) 141.52; (P) 142.03; (R1) 142.73; More
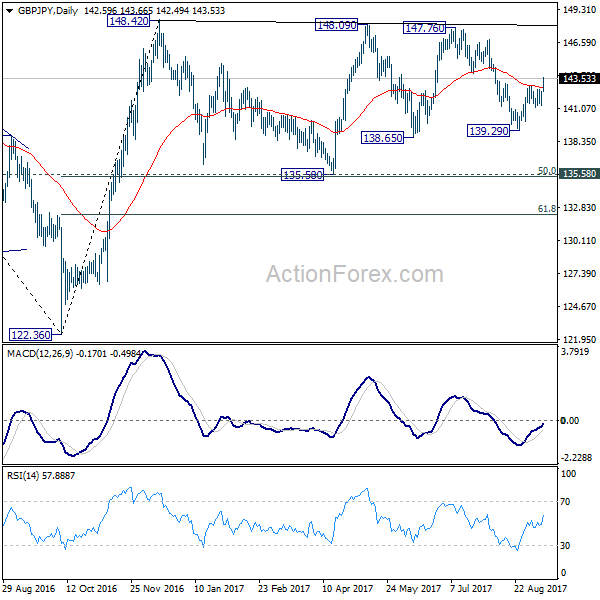
The break of 143.18 resistance in GBP/JPY indicates that fall from 147.76 has completed at 139.29 already, on bullish convergence condition in 4 hour MACD. Intraday bias is now turned back to the upside for 147.76/148.42 resistance zone. Overall, price actions from 148.42 are seen as a sideway consolidation pattern. Break of 141.17 support will turn bias to the downside and bring another fall. But downside should be contained by 135.58 cluster support to bring rebound.
In the bigger picture, the sideway pattern from 148.42 is still unfolding. In case of deeper fall, we'd expect strong support from 135.58 and 50% retracement of 122.36 to 148.42 at 135.39 to contain downside. Medium term rise from 122.36 is expected to resume later. And break of 38.2% retracement of 196.85 to 122.36 at 150.43 will carry long term bullish implications. However, firm break of 135.58/39 will dampen the bullish view and turn focus back to 122.36 low.
Trade Idea: EUR/GBP – Sell at 0.9130
EUR/GBP - 0.9081
Original strategy :
Sell at 0.9200, Target: 0.9060, Stop: 0.9240
Position : -
Target : -
Stop : -
New strategy :
Sell at 0.9130, Target: 0.9000, Stop: 0.9170
Position : -
Target : -
Stop : -
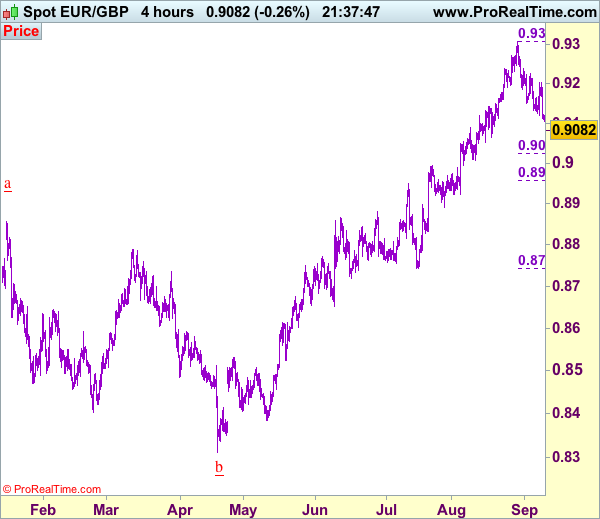
As the single currency has fallen again after brief recovery, adding credence to our view that the fall from 0.9307 is still in progress and mild downside bias remains for this move from temporary top of 0.9307 to bring retracement of recent upmove to 0.9050 (61.8% Fibonacci retracement of 0.8892-0.9307), then towards 0.9025 (50% Fibonacci retracement of 0.8743-0.9307), however, near term oversold condition should prevent sharp fall below support at 0.9008l and price should stay well above 0.8955-60 (61.8% Fibonacci retracement), bring rebound later.
In view of this, we are inclined to sell euro on recovery as 0.9130-35 should limit upside. Above 0.9160-70 would defer and risk rebound to resistance at 0.9203, break there would suggest low is formed instead, bring a stronger rebound to 0.9235-40 but price should falter well below said resistance at 0.9307.
Our preferred count is that, after forming a major top at 0.9805 (wave V), (A)-(B)-(C) correction is unfolding with (A) leg ended at 0.8400 (A: 0.8637, B: 0.9491 and 5-waver C ended at 0.8400. Wave (B) has ended at 0.9413 and impulsive wave (C) has either ended at 0.8067 or may extend one more fall to 0.8000 before prospect of another rally. Current breach of indicated resistance at 0.9043 confirms our view that the (C) leg has ended and bring stronger rebound towards 0.9150/54, then towards 0.9240/50.
Trade Idea: USD/CAD – Sell at 1.2240
USD/CAD - 1.2167
Trend: Down
Original strategy :
Sell at 1.2240, Target: 1.2080, Stop: 1.2300
Position: -
Target: -
Stop: -
New strategy :
Sell at 1.2240, Target: 1.2080, Stop: 1.2300
Position: -
Target: -
Stop:-
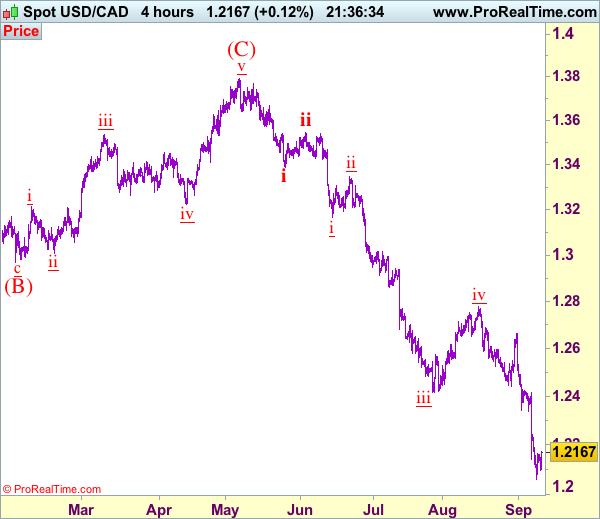
As the greenback has rebounded again after finding support at 1.2097, retaining our view that further consolidation above last week’s low at 1.2061 would take place and another bounce to 1.2200 cannot be ruled out, however, reckon resistance at 1.2245 would limit upside and bring another decline later, below 1.2097 would bring a retest of said support at 1.2061, break there would signal recent decline is still in progress and may extend further weakness towards psychological support at 1.2000 but loss of downward momentum should prevent sharp fall below 1.1950-60, bring rebound later. We are keeping our count that wave v as well as wave (C) ended at 1.3794 and impulsive wave (i ii, i ii) is now unfolding with minor wave iii ended at 1.2414, followed by wave iv correction ended at 1.2778, wave v has reached our indicated downside target at 1.2100 and may extend to 1.2000.
In view o this, would not chase this fall here and would be prudent to sell on recovery as 1.2245 should limit upside. Above 1.2300 would would defer and risk a stronger rebound to 1.2335-40 but only break of resistance at 1.2429 would signal low is formed, bring retracement of recent decline to 1.2490-00.
To recap, wave B from 1.3066 is unfolding as an a-b-c and is sub-divided as a: 1.2192, b: 1.2716 and wave c is a 5-waver with i: 1.1983, ii: 1.2506, extended wave iii with minor iii at 1.0206, wave iv ended at 1.0781 and wave v as well as wave iii has ended at 0.9931, hence the subsequent choppy trading is the wave iv which is unfolding as (a)-(b)-(c) with (a) leg of iv ended at 1.0854, followed by (b) leg at 1.0108 and (c) leg as well as the wave iv ended at 1.0674. The wave v is sub-divided by minor wave (i): 0.9980, (ii): 1.0374, (iii): 0.9446, (iv): 0.9913 and (v) as well as v has possibly ended at 0.9407, therefore, consolidation with upside bias is seen for major correction, indicated target at 1.3700 and 1.4000 had been met and further gain to 1.4700 would be seen later.
EUR/USD Mid-Day Outlook
Daily Pivots: (S1) 1.2001; (P) 1.2046 (R1) 1.2079; More...
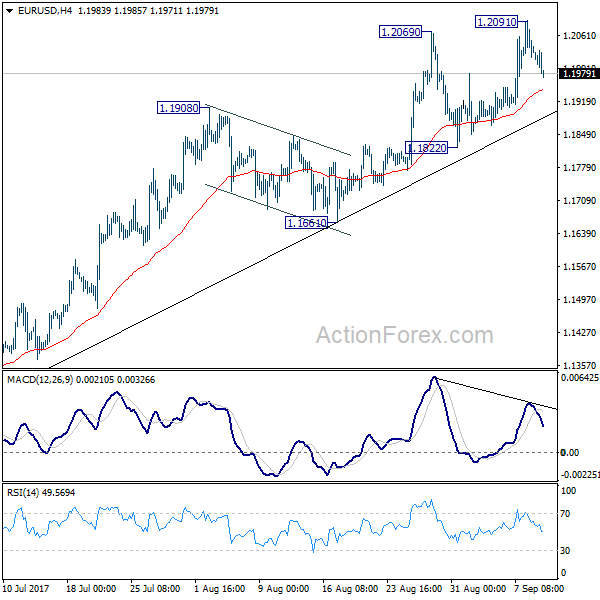
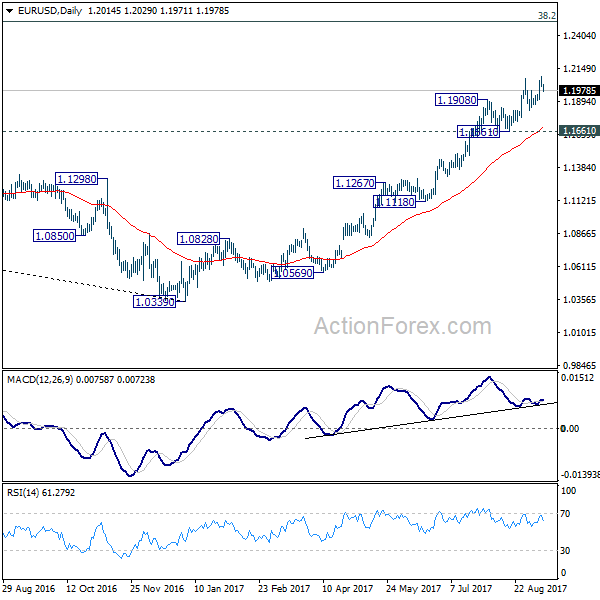
EUR/USD's retreat from 1.2091 temporary top extends lower today. And intraday bias stays neutral for more corrective trading. Overall, outlook remains bullish as long as 1.1822 support holds. Above 1.2091 will extend larger rise fro 1.0339 and target next key fibonacci level at 1.2516. But considering bearish divergence condition in 4 hour MACD, break of 1.1822 will confirm short term topping and bring deeper fall back to 1.1661 support and below.
In the bigger picture, rise from medium term bottom at 1.0339 is still in progress for 38.2% retracement of 1.6039 (2008 high) to 1.0339 (2017 low) at 1.2516. However, it should be noted that there is no confirmation of trend reversal yet. That is, such rebound from 1.0399 could be a correction. And the long term fall fro 1.6039 (2008 high) could resume. Hence, we'd be cautious on strong resistance from 1.2516 to limit upside. But after all, break of 1.1661 is needed to indicate medium term topping. Otherwise, outlook will remain bullish in case of pull back.
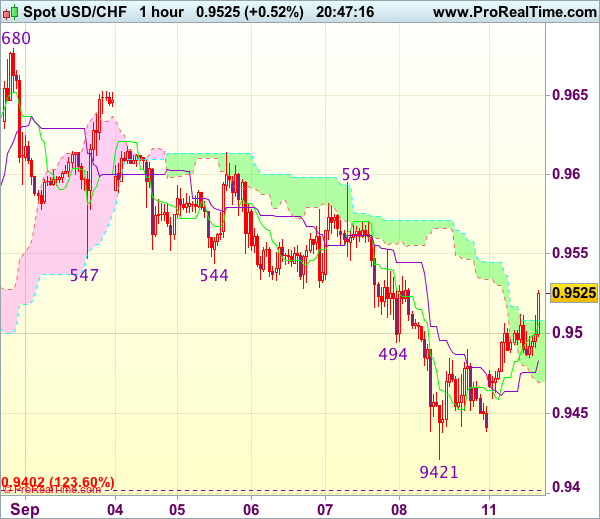
USD/CHF Mid-Day Outlook
Daily Pivots: (S1) 0.9404; (P) 0.9456; (R1) 0.9490; More....
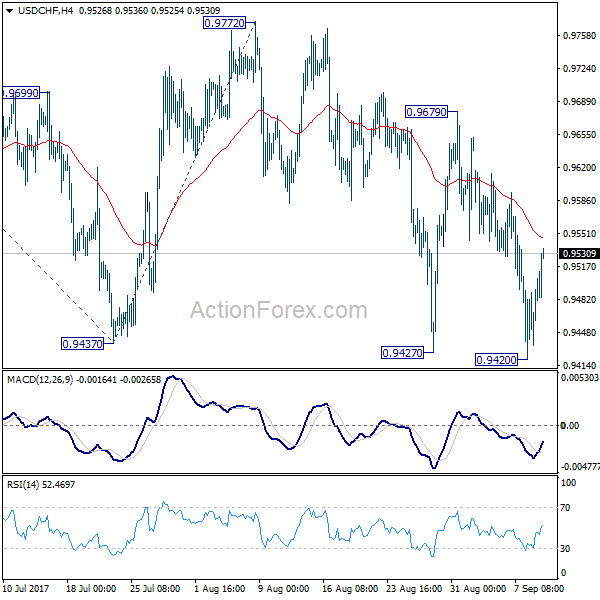
Intraday bias in USD/CHF remains neutral for consolidation above 0.9420 temporary low. But after all, near term outlook remains bearish as long as 0.9679 resistance holds. Deeper fall is still expected. Sustained break of 0.9420 will target 61.8% projection of 1.0099 to 0.9437 from 0.9772 at 0.9363 first. Break will target 100% projection at 0.9110 next.
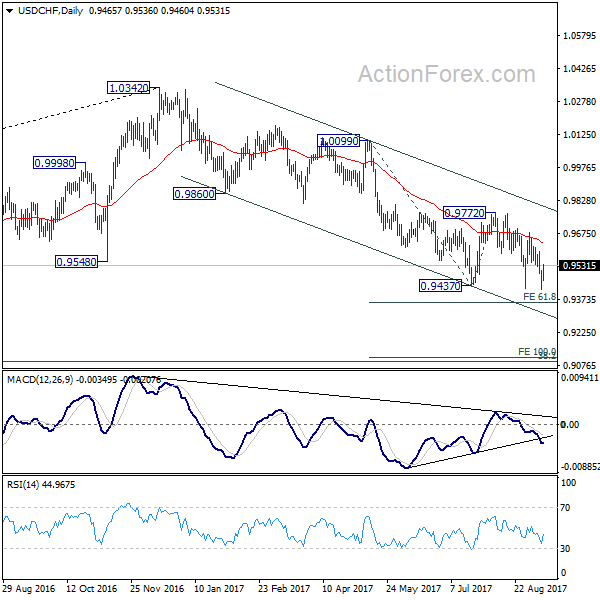
In the bigger picture, current development suggests that 0.9443 key support (2016 low) could be taken out firmly as down trend form 1.0342 extends. There are various interpretation of the price actions. But in any case, medium term outlook will stay bearish as long as 0.9772 resistance holds. Current down trend could extend to 38.2% retracement of 0.7065 (2011 low) to 1.0342 (2016 high) at 0.9090. However, break of 0.9772 will indicate that USD/CHF has successfully defended 0.9443 again and turn outlook bullish for 1.0099 resistance.
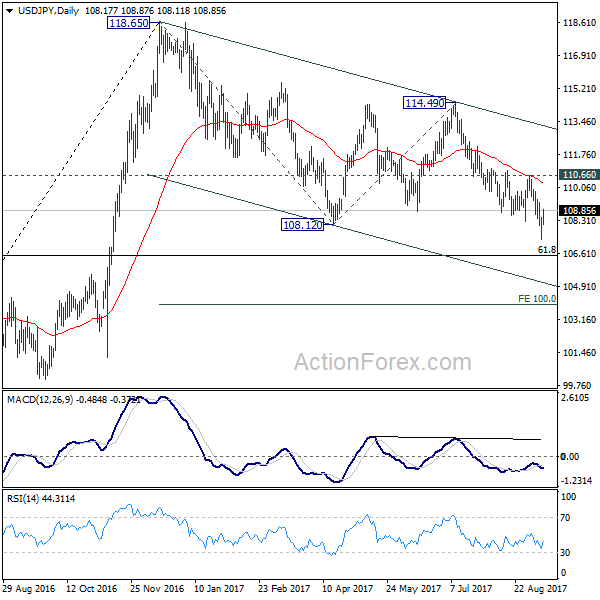
USD/JPY Mid-Day Outlook
Daily Pivots: (S1) 107.27; (P) 107.88; (R1) 108.44; More...
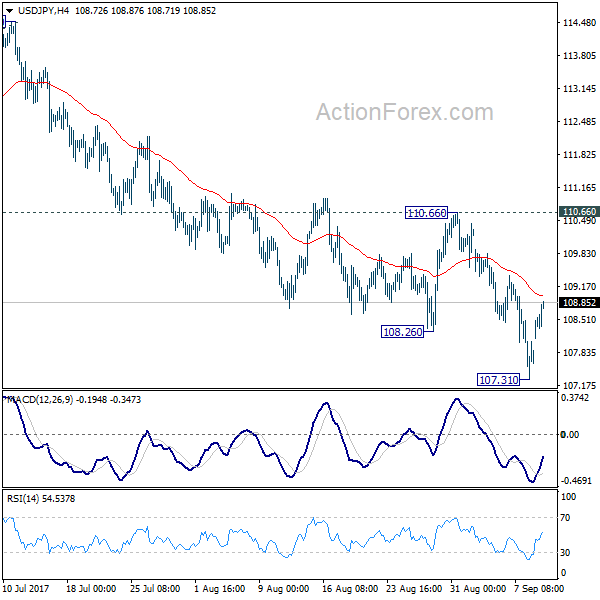
Intraday bias in USD/JPY remains neutral for consolidation above 107.31 temporary low. But overall, outlook will remain bearish as long as 110.66 resistance holds. And, deeper decline is expected. Below 107.31 will extend the whole fall from 118.65 to 61.8% retracement of 98.97 to 118.65 at 106.48 first. We'd look for support from there to bring rebound. But firm break of 106.48 will extend the decline to 100% projection of 118.65 to 108.12 from 114.49 at 103.96 or below.
In the bigger picture, rise from 98.97 (2016 low) is now seen as the second leg of the corrective pattern from 125.85 (2015 high). It's unclear whether this this second leg has completed at 118.65 or not. But medium term outlook will be mildly bearish as long as 114.49 resistance holds. And, there is prospect of breaking 98.97 ahead. Meanwhile, break of 114.49 will bring retest of 125.85 high. But even in that case, we don't expect a break there on first attempt.
Canadian Homebuilding Activity Remained Strong in August
Highlights:
- Housing starts were little changed at 223k annualized units in August. Market expectations were for a slight moderation to 215k from July's 222k pace.
- On a trend basis, starts averaged 220k over the past six months, the strongest pace in nearly five years.
- Single-unit starts edged lower after having picked up strongly earlier this year. Multi-unit starts rose in August and the six-month trend was the strongest on record.
- On a regional basis, a jump in Ontario starts was partly offset by a decline in BC. Year-to-date, starts remain elevated in both provinces. Quebec and the Prairies have also seen an improvement in homebuilding activity this year.
Our Take:
Canada's homebuilding sector continued to defy the trend in resales with housing starts remaining elevated in August. On a trend basis, starts are running at their fastest pace since September 2012 even as changes in housing policy are slowing sales of existing homes. Recent strength in permit issuance argues for that divergence to continue in the near-term. However, as starts do tend to follow resales with a lag, we think some slowing in the former is in order toward the end of the year. The fact that housing starts continue to strongly outpace the estimated underlying rate of household formation also argues for some slowing going forward. But for now, it looks like Q2's decline in residential investment won't be repeated in the current quarter.
Trade Idea Update: USD/CHF – Hold long entered at 0.9450
USD/CHF - 0.9529
Original strategy :
Bought at 0.9450, Target: 0.9550, Stop: 0.9420
Position : - Long at 0.9450
Target : - 0.9550
Stop : - 0.9420
New strategy :
Hold long entered at 0.9450, Target: 0.9550, Stop: 0.9480
Position : - Long at 0.9450
Target : - 0.9550
Stop : - 0.9480
As the greenback found support at 0.9439 and has rebounded, retaining our view that low is possibly formed at 0.9421 on Friday and consolidation with mild upside bias remains for retracement of recent decline, hence gain to 0.9550-55 would be seen, however, break above there is needed to add credence to this view, bring a stronger rebound towards resistance at 0.9595 which is likely to hold from here.
In view of this, we are holding on to our long position entered at 0.9450. Below said support at 0.9421 would risk weakness to 0.9390-00, having said that, further sharp fall below 0.9370-75 should not be repeated and reckon 0.9350 would hold from here, bring rebound later.