Sample Category Title
EUR/GBP Drops Like A Rock
The currency seems too heavy to be stopped on the short term. Is trading in the red and resumes the bearish momentum. EUR/GBP is focusing on correction right now, so the perspective is bearish on the short term. Remains to see how long this retreat will be because is approaching some major downside obstacle.
Price has opened with a gap down in the morning, signaling that the bears are very strong on the short term. Technically, the corrective phase could be only temporary, could drop only to recapture more directional energy before will resume the upside movement.
The Euro drop versus the Cable even if the Italian Industrial Production rose by 0.1% in July, the economic indicator was expected to decrease by 0.5%. The Industrial Production remains in the positive territory for the third consecutive month, but the Euro wasn't inspired.
Price goes down after the false breakout above the upper median line (UML) of the major ascending pitchfork and above the 0.9226 static resistance. Has managed to slip below the 50% Fibonacci line, a valid breakdown will signal a further drop towards the next downside targets.
The near term support will be at the 0.9000 psychological level, could also be attracted by the lower median line (lml) of the minor blue ascending pitchfork. Technically, is somehow expected to be attracted by the confluence area formed at the intersection between the median line (ML) with the third warning line (wl3) of the descending pitchfork and with the lower median line (lml) of the minor ascending pitchfork.
NZD/USD Pressuring Static Resistance
The NZD/USD is pressuring the 38.2% retracement level, a valid breakout will confirm an increase towards the third warning line (WL3) of the descending pitchfork. Price remains under pressure as long as is trading under the WL3, only a breakout above it will signal a further increase towards the next upside targets, from 0.7375, respectively to 0.7484 level.
Trade Idea Update: GBP/USD – Buy at 1.3125
GBP/USD - 1.3196
Original strategy :
Buy at 1.3125, Target: 1.3225, Stop: 1.3090
Position : -
Target : -
Stop : -
New strategy :
Buy at 1.3125, Target: 1.3225, Stop: 1.3090
Position : -
Target : -
Stop : -
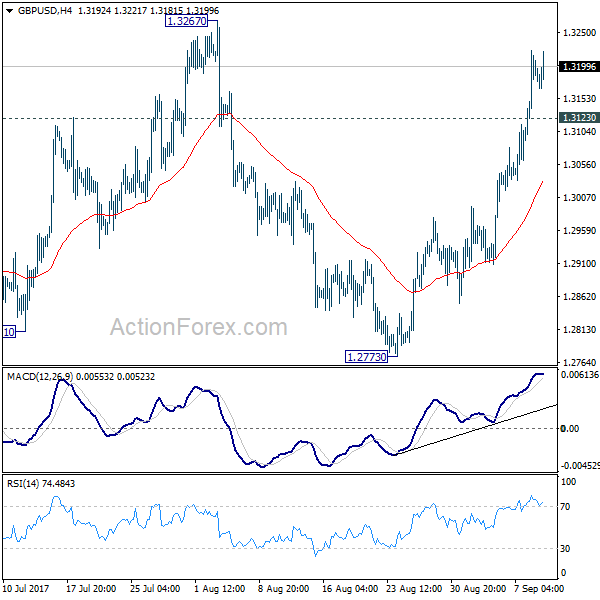
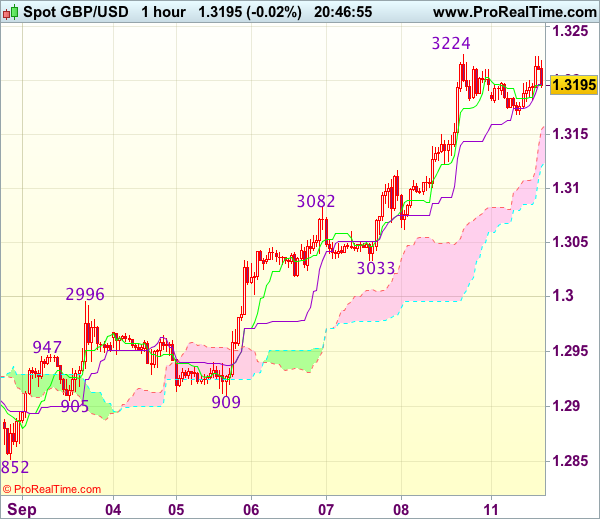
Last week’s rally to 1.3224 adds credence to our bullish view that recent upmove from 1.2774 is still in progress and upside bias remains for further gain to 1.3225-30, then towards 1.3250, however, loss of near term upward momentum should prevent sharp move beyond latter level and price should falter below recent high at 1.3269, bring retreat later.
In view of this, would not chase this rise at current level and would be prudent to buy cable on subsequent pullback as 1.3120-25 should limit downside. Only below 1.3082 (previous resistance turned support) would abort ad suggest top is possibly formed, risk test of 1.3062 but reckon support at 1.3033 would hold.
USD/CHF Throwback
USD/CHF has opened with a gap up and continues to increase on the daily chart. Looks like we had a false breakdown below the 0.9440 static support and under the lower median line (lml) of the minor descending pitchfork. A retest of the lower median line (lml) will confirm a further increase in the upcoming period, the next important upside target will be at the median line (ml) of the minor descending pitchfork.
Trade Idea Update: EUR/USD – Hold long entered at 1.1985
EUR/USD - 1.1984
Original strategy :
Bought at 1.1985, Target: 1.2090, Stop: 1.1950
Position : - Long at 1.1985
Target : - 1.2090
Stop : - 1.1950
New strategy :
Hold long entered at 1.1985, Target: 1.2090, Stop: 1.1950
Position : - Long at 1.1985
Target : - 1.2090
Stop : - 1.1950
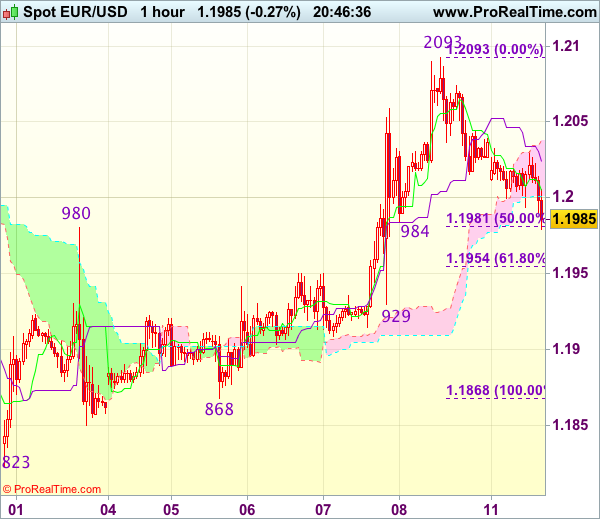
Euro’s retreat after rising to 1.2093 late last week suggests consolidation below this level would be seen and marginal weakness from here cannot be ruled out, however, reckon downside would be limited and bring another rise later, above 1.2030 would suggest an intra-day low is formed, bring test of 1.2070-75, break there would signal the pullback from 1.2093 has ended, then retest of this resistance would follow but break there is needed to extend recent upmove towards 1.2150-55 (61.8% projection of 1.1119-1.1910 measuring from 1.1662).
In view of this, we are holding on to our long position entered at 1.1985. Below 1.1950 (previous resistance turned support) would signal a temporary top is formed instead bring weakness to 1.1925-30 first.
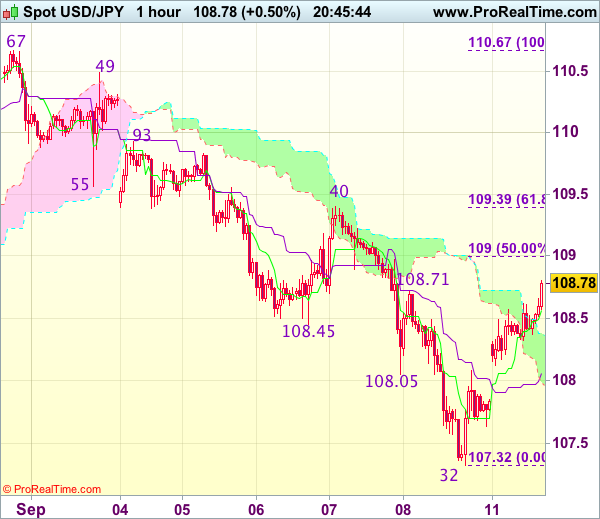
USDJPY: Triggers Corrective Recovery, Eyes 109.00 Zone
USDJPY: The pair saw a saw recovery during early trading today opening the door for correction in the days ahead. On the downside, support comes in at the 108.00 level where a break if seen will aim at the 107.50 level. A cut through here will turn focus to the 107.00 level and possibly lower towards the 106.50 level. On the upside, resistance resides at the 109.00 level. Further out, we envisage a possible move towards the 109.50 level. Further out, resistance resides at the 110.00 level with a turn above here aiming at the 110.50 level. On the whole, USDJPY now faces a recovery higher threats.
Trade Idea Update: USD/JPY – Sell at 109.35
USD/JPY - 108.79
Original strategy :
Sell at 108.90, Target: 107.70, Stop: 109.25
Position : -
Target : -
Stop : -
New strategy :
Sell at 109.35, Target: 108.35, Stop: 109.70
Position : -
Target : -
Stop : -
As the greenback opened higher today and has edged higher, suggesting near term upside risk remains for the rebound from last week’s low of 107.32 to extend gain to 109.00 (50% Fibonacci retracement of 110.67-107.32), however, still reckon upside would be limited to 109.39-40 (61.8% Fibonacci retracement and previous resistance) and bring retreat later, below the Kijun-Sen (now at 108.07) would suggest the rebound from 107.32 has possibly ended but break of 107.60-65 is needed to confirm and bring retest of 107.32.
In view of this, we are still looking to sell dollar on further recovery as 109.35-40 should limit upside, bring retreat later. Above 109.55 would defer and signal low has been formed, bring a stronger rebound towards resistance at 108.93 which is likely to hold from here due to near term overbought condition.
EURUSD Testse Key 1.2030 Level
The EURUSD pair continues to hold above the 1.2000 level, with price-action moving to test the key 1.2030 level, despite a minor relief rally in the U.S dollar index, and a lack of macroeconomic data from Europe and the United States.
The euro is currently confined to a tight trading range between the 1.1980 and 1.2040 region, with a higher time frame close above or below these levels needed to set a stronger intraday directional trend.
This week's EURUSD directional bias is likely to be set by U.S economic data, as we see a number of high impact inflation and consumer spending data points from the United States economy.
Key intraday resistance for the EURUSD pair is located at 1.2048, 1.2069 and 1.2092. Once above the 1.2092 level, traders should look for further bullish advancement towards the 1.2130, 1.2160 and 1.2230 levels.
Intraday corrections lower for the EURUSD pair should find initial support from the September 1st Nonfarm payrolls spike high, at 1.1979.
The euro's 100-hour moving average offer further support, at 1.1968, as does the 200-hour moving average, at 1.1935.
GBPUSD Back Above 1.3200
The GBPUSD pair has moved back above the 1.3200 level, after a minor correction to the 1.3168 support level, during the early European trading session.
Price-action continues to remain extremely bullish, with the pair increasingly likely to target the current monthly and yearly price highs, at 1.3224 and 1.3268
The GBPUSD pair is now starting to test the 1.3220 level, which is a key Fibonacci level, and represents the 50 percent retracement of the Brexit spike high at 1.5017, to the 2016 trading low, located at 1.1434.
Above the 1.3268 level, GBPUSD upside objectives remain 1.3300 and 1.3348.
The 100-week moving average and upside channel top also converge, at 1.3396.
To the downside, GBPUSD support is located at the daily pivot at 1.3180, and the current weekly low, at 1.3168.
Further support is located at the weekly pivot, at 1.3109, and the former monthly pivot, at 1.3080.
GBP/USD Mid-Day Outlook
Daily Pivots: (S1) 1.3113; (P) 1.3168; (R1) 1.3245; More...
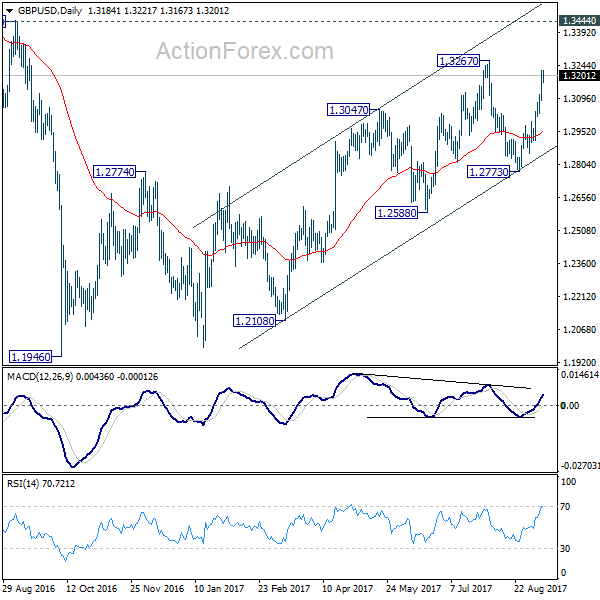
Intraday bias in GBP/USD remains on the upside and rise from 1.2773 should target 1.3267 resistance first. Break there will resume whole rise from 1.1946 and target 1.3444 key resistance next. But again, price actions from 1.1946 are still seen as a corrective pattern. Hence, we'd expect strong resistance from 1.3444 to limit upside to bring larger down trend reversal eventually. On the downside, below 1.3123 minor support will turn intraday bias neutral first.
In the bigger picture, overall, price actions from 1.1946 medium term low are seen as a corrective pattern. While further rise cannot be ruled out, larger outlook remains bearish as long as 1.3444 key resistance holds. Down trend from 1.7190 (2014 high) is expected to resume later after the correction completes. And break of 1.2773 support will be the first sign that such down trend is resuming.