
Sample Category Title
Dollar Staggers Ahead of Inflation Data
USD to face inflation and retail sales
The USD is lower across the board against majors as geopolitical turmoil at home and abroad, natural disasters and an uncertain fate for rate hikes have left the currency adrift. The US Federal Reserve members remain divided on the pace of rate hikes. Inflation has been low in the United States and is putting no pressure on the central bank to keep raising interest rates. The Bureau of Labor Statistics will release the consumer price index (CPI) on Thursday, September 14 at 8:30 am EDT. Consumer prices account for the majority of inflation with the core reading released at the same time removing the more volatile items: food and energy.
Low inflation has been a problem for most major economies, but the Brexit debacle has increased inflationary pressures in the United Kingdom. The Office for National Statistics will release its annual CPI on Tuesday, September 12 at 4:30 am EDT. Later in the week the Bank of England (BoE) will publish its monetary policy summary on Thursday, September 14 at 7:00 am EDT. The British benchmark interest rate is expected to remain unchanged but the minutes and policy member votes will be highlights as the UK economy is losing momentum while Brexit talks are ongoing.
US and UK events will dominate the economic calendar this week with the Swiss National Bank libor rate announcement on Thursday, September 14 at 3:30 am EDT another big highlight. The approach of Hurricane Irma to the United States will also have energy traders on alert as well as Saturday's celebration of North Korea's Foundation Day .
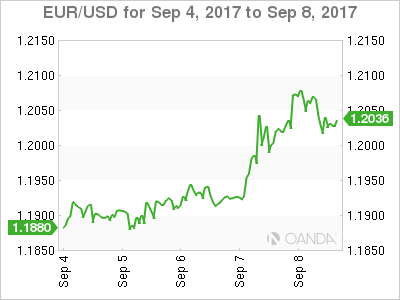
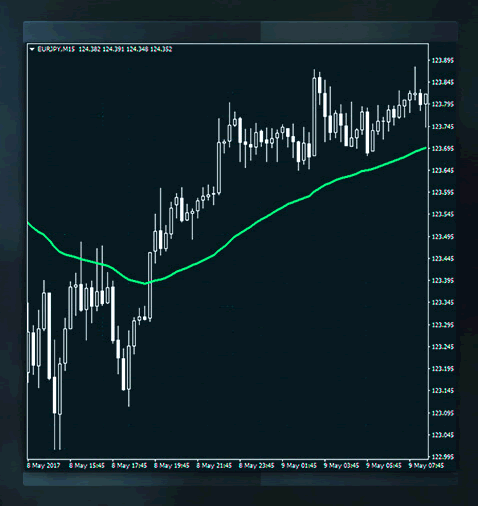
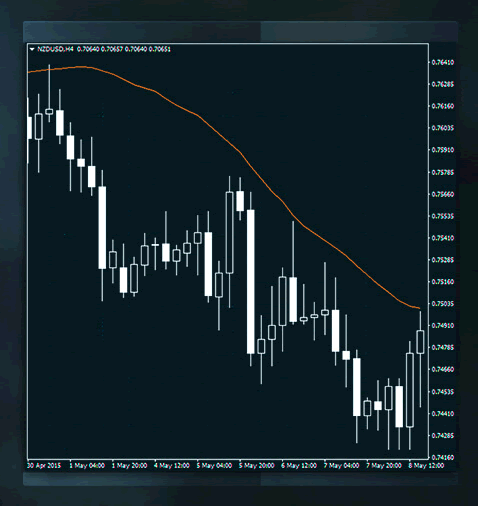
The EUR/USD rose 1.238 percent in the last week. The single currency is trading at 1.2046 after breaking above 1.20 with the release of the European Central Bank (ECB) monetary policy statement and press conference with President Mario Draghi puts a tapering announcement firmly on the October agenda. There were few US economic indicator releases and the geopolitical and natural storms took a toll on the dollar. There was some relief as the second round of NAFTA and the debt ceiling were pushed back for later and the Trump administration is pushing hard for tax reforms. The situation in North Korea will continue to trigger a flight to safety benefiting the EUR.
Dovish Fed members earlier in the week suggested the central bank slow down its rate hiking pace. The U.S. Federal Reserve is expected to announce the timeline for its balance sheet reduction in its September 20 meeting, leaving some room if it wants to hike in December (which could be Fed Chair Janet Yellen's last major decision as her term ends in February). The lack of clear candidate to replace Yellen is another strike on the Trump Administration. Economics adviser Gary Cohn was a strong candidate until falling out with Trump over the official response to Charlottesville.
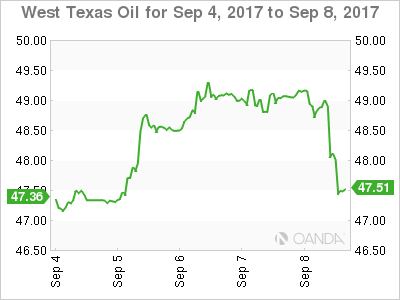
West Texas Intermediate rose 0.607 percent in the last five days. US crude is trading at 47.44 as Texan refineries are coming back online albeit slowly. Hurricane Harvey had a big impact on refineries creating a glut of crude but a shorter supply of gasoline. That situation is getting better, but with Hurricane Irma threatening oil platforms in the Gulf the situation could be reversed going into the weekend.
Despite the recovery of prices during the week oil posted a drop on Friday as the tropical storm is headed towards Florida which could affect demand for energy. Oil rig counts continue to be unaffected and added to the US crude stocks report there is ample supply of crude, also pushing down prices. Rumours out of China for lower demand and new estimates on how fast Texan refineries could be out has also limited the recovery of oil prices.
Gold rose 1.711 in the past five days. The yellow metal is trading at $1346.99, its highest price in twelve months. Geopolitical turmoil in particular regarding the situation with North Korea and the problems within the White House to put together a strong tax reform, debt ceiling and NAFTA renegotiation while at the same time responding to another approaching Hurricane have forced investors to look for safe havens.
The USD is struggling to regain momentum and with the Fed facing concerns about a third rate hike, the precious metal has advanced. The release of US inflation indicators could do more damage to the probabilities of a December rate hike than to the price of gold as an inflation hedge.
Market events to watch this week:
Tuesday, September 12
- 4:30 am GBP CPI y/y
Wednesday, September 13
- 4:30 am GBP Average Earnings Index 3m/y
- 8:30 am USD PPI m/m
- 10:30 am USD Crude Oil Inventories
- 9:30 pm AUD Employment Change
- 10:00 pm CNY Industrial Production y/y
Thursday, September 14
- 3:30 am CHF Libor Rate
- 3:30 am CHF SNB Monetary Policy Assessment
- 4:30 am GBP Retail Sales m/m
- 7:00 am GBP MPC Official Bank Rate Votes
- 7:00 am GBP Monetary Policy Summary
- 8:30 am USD CPI m/m
- 8:30 am USD Core CPI m/m
- 8:30 am USD Unemployment Claims
Friday, September 15
- 8:30 am USD Core Retail Sales m/m
- 8:30 am USD Retail Sales m/m
*All times EDT
The Weekly Bottom Line: More Stormy Weather And Volatile Data On The Horizon
U.S. Highlights
- Investors had lots to digest this week, with the lineup including communication from central banks, natural disasters and growing geopolitical tensions. The dynamics weighed on equities, while sending gold and Treasuries higher. Economic data remained largely positive, but diverging views among Fed officials point to some uncertainty.
- The October departure of Vice Chair Fischer is likely to add to that uncertainty.
- Economic data is likely to sustain some volatility due to the effects of Hurricane Harvey and the impending Hurricane Irma. Today's swift deal in Congress to extend the government's funding and borrowing limit until Dec. 8th, along with a $15.25 bn. relief package, should nonetheless provide some solace for the economy.
Canadian Highlights
- The GDP print was enough to sway the Bank of Canada to hike rates for the second consecutive meeting, with the move sending the loonie 2.4% higher on the week, 5% on the month, and 13.5% from its early-May trough.
- The stronger loonie has hampered exports which declined for the second time in July, with more weakness likely. Alongside the net export drag, residential investment is also likely to remain weak as Ontario markets cool-off.
- While not without blemishes, the employment report was a good one with the economy adding 22k jobs and the jobless rate down 0.1pp to 6.2%. The eroding labour market slack led to a pick-up in wage growth to 1.8% from a year-ago, providing some comfort for the Bank of Canada, with another hike still likely before the year is out.
U.S. - More Stormy Weather And Volatile Data On The Horizon
Despite this being a holiday-shortened week, investors had lots to digest, with the lineup including communication from central banks, natural disasters and growing geopolitical tensions. The latter was the dominating factor at the start of the week, with markets opening on a dour note as investors poured into safe haven assets. The dynamic sent gold and Treasuries higher, while also benefitting crude oil. Conversely, long-term yields and the trade-weighted U.S. dollar sustained their downward trends – the latter falling to early 2015 levels.
Nonetheless, the theme of synchronized economic growth leading to a removal of monetary stimulus was back on display this week. An improved performance of the Eurozone and Canadian economies, which have been growing at rates significantly above potential lately, inspired more hawkish stances among their central banks. In this vein, the BoC hiked its key interest rate for the second time in two months, while the ECB began having 'very preliminary discussions' about how to scale back its €60 bn/month asset purchase program, with the process likely to start next year.
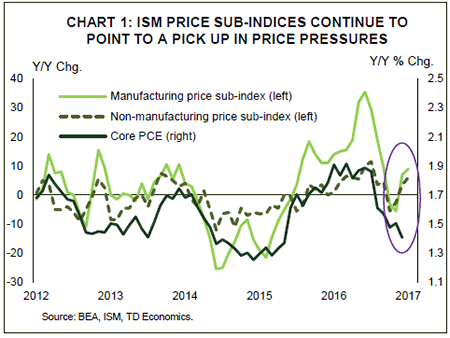
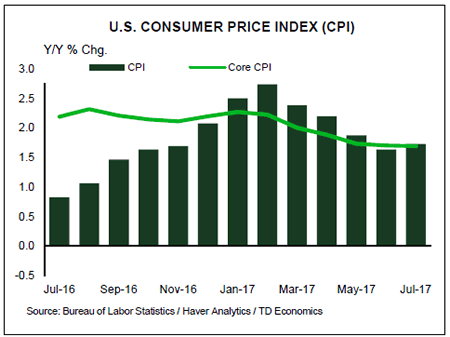
U.S. economic data was similarly positive. The trade deficit remained largely unchanged in July, and net exports are on track to contribute positively to economic activity for the third consecutive quarter. At the same time, the ISM non-manufacturing index followed its manufacturing counterpart and rebounded in August. The renewed vigor in both ISM metrics points to economic growth gaining momentum, with an upbeat tone in the Beige Book echoing a similar narrative. What is more, the prices paid components of both indices continued to point to rising price pressures (Chart 1). While we are yet to see these manifest in inflation metrics, the trend should still provide some comfort to the Fed as it meets to discuss monetary policy in two weeks' time.
Ahead of that meeting, a number of speeches from Fed officials took place throughout the week. The most significant were those of voting members Brainard and Dudley. Brainard's speech, which suggested treading carefully over low inflation, was decisively dovish. Meanwhile, Dudley retained a more hawkish tone, but did acknowledge his 'surprise' to the shortfall in inflation and suggested that 'structural' factors may be at play. The diverging views point to some uncertainty as to the near-term path of interest rates. The October departure of Vice Chair Fischer, at a time when the Fed Board already has three vacancies, is likely to add to that uncertainty.
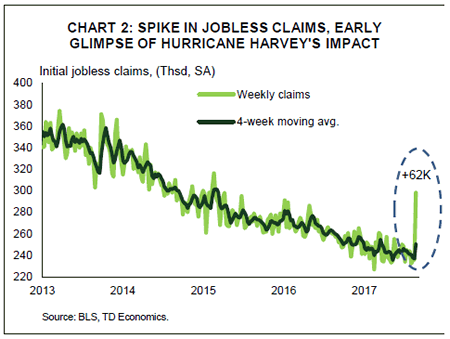
This comes at a time when economic data is bound to go through some volatility due to the effects of Hurricane Harvey and the impending Hurricane Irma. Case in point, the weak August auto sales report has already been followed by a spike in jobless claims this week (Chart 2). The theme also played out in the Beige Book which, despite its upbeat tone, highlighted Harvey-related disruptions ahead. We expect these transitory effects to leave economic growth largely unchanged over the medium-term, but they will likely weigh on near-term economic activity. Today's swift deal in Congress to extend the government's funding and borrowing limit until Dec. 8th, along with a $15.25 bn. relief package, should nonetheless provide some solace.
Canada - BoC Hikes On Strong Data, With More To Come
It was another busy week in Canadian markets. Last week's blowout second quarter GDP number rapidly increased the chances of a near-term rate hike, and the Bank of Canada delivered. Since the chances of a hike were effectively a coin-toss, the rate rise drove bond yields up and lit a fire under the loonie. The Canadian dollar looks to finish the week 2.4% higher, marking a fourth consecutive week of gains vis-à-vis the greenback with the cumulative gain some 5% on the month. The loonie's strength extends further than that, with robust Canadian data, and some broad-based weakness in the greenback, leaving the Canadian dollar a whopping 13.5% higher since its early-May trough.
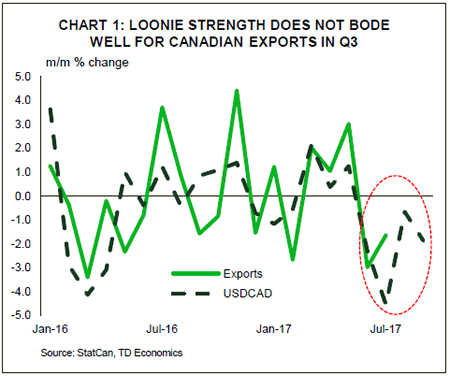
The currency strength has begun to manifest on economic data. It has likely kept inflation down by about 0.2pp in recent months and has made Canadian exports more expensive on world markets. Trade data for July indicated a second consecutive decline with exports 1.6% lower July after a 3.0% decline in June. Moreover, the currency's strength over August and September (so far) indicates that further weakness in exports is likely (see Chart 1), with trade likely to subtract from GDP over the third quarter, and perhaps even into the last quarter of the year. The trade numbers could be further affected by the persistent uncertainty related to the ongoing NAFTA renegotiations.
Another sector that's likely to remain weak in the third quarter is residential investment. Monthly data from regional real estate boards this week indicated that both the Toronto and Vancouver markets saw sales pick-up in August from the previous month, ending four and three months of declines, respectively. However, third quarter sales activity is likely to remain very weak and together with lower prices will weigh on residential investment during the quarter.
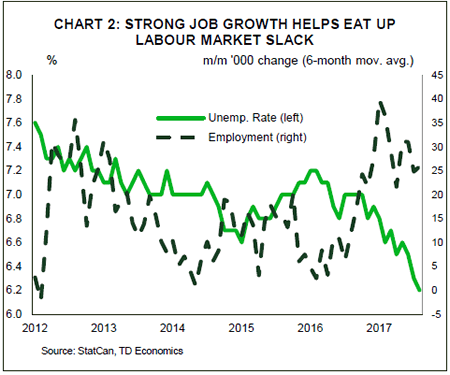
Despite the softening in some sectors, much of the economy remains on a good course. The LFS employment report indicated that the jobless rate fell 0.1 pp to 6.2% – its lowest level since October 2008 – as the Canadian economy added a robust 22,200 jobs in August (Chart 2). It bears noting that this gain was due entirely to increases in part-time work. But, that caveat aside, the strength of job creation is beginning to show up in wage gains. The average hourly wage rose 0.5% on the month, and accelerating to 1.8% relative to a year ago.
The Bank of Canada's most recent policy statement highlighted concerns over the "subdued" wage and price pressures. To that end, the acceleration in the wage growth in the August employment report is likely to provide some comfort with the hopes that wage growth will help lift inflation higher. The BoC will also likely discount any near-term weakness in inflation given the transitory effects of currency appreciation on consumer prices (also likely to be offset by Hurricane Harvey related impacts on gasoline prices). Lastly, the Bank is unlikely to be surprised by a slowdown in economic growth over the second-half of the year, which it fully expects according to the policy statement. As such, we believe another hike is very much possible before the year is out.
U.S.: Upcoming Key Economic Releases
U.S. Consumer Price Index - August
Release Date: September 14, 2017
Previous Result: 0.1% m/m, core 0.1% m/m
TD Forecast: : 0.4% m/m, core 0.2% m/m
Consensus: 0.3% m/m, core 0.2% m/m
We expect headline CPI inflation to pick up to 1.9% y/y in August, with prices up 0.4% m/m. Energy prices will be a significant boost this month following Hurricane Harvey, which shuttered about a quarter of the nation's refinery output. We expect gasoline prices up nearly 6% m/m, with an even stronger increase in September. That would leave headline inflation on track to breach 2% y/y by October. In the core, we look for a return to a 0.2% m/m print (the first in six months) though unfavorable base effects leave the y/y rate lower at 1.6%. August gains should largely be driven by a rebound in hotel prices, which plunged in the prior two months. In addition, some further stabilization in core goods prices, led by apparel and presaged by higher import prices, along with steady strength in OER and rents should drive the pickup and offset a likely persistent drag from past categories of weakness, namely vehicle prices and wireless services. That said, we proceed with caution in the near term and continue to see risks skewed to the downside as the uncertain retail landscape suggests scope for more disappointment ahead. Further downside realized in core prices—in the form of 0.1% m/m prints in core CPI—will likely drive greater caution among Fed policymakers over future rate hikes.
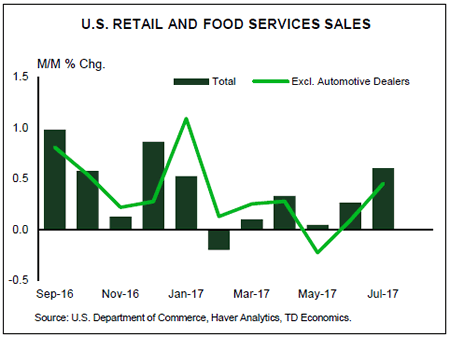
U.S. Retail Sales - August
Release Date: September 15, 2017
Previous Result: 0.6%, ex-auto 0.5%
TD Forecast: -0.1%, ex-auto 0.5%
Consensus: 0.1%, ex-auto 0.5%
We expect retail sales to fall 0.1% in August, led by a drop in motor vehicle sales. Light weight auto and truck sales disappointed at a 16.0m annual rate last month, in part due to the aftermath of Hurricane Harvey that hit Houston—the second largest auto market in the US. The August sales figure came in lower than analyst expectations, pointing to weaker Q3 real PCE closer to a mid to low 2% pace. Offsetting the August drop in auto sales are gasoline station receipts, reflecting a significant jump in gasoline prices. This should leave ex-auto sales up 0.5% and we also see scope for a healthy 0.3% increase in the control group (excluding auto, gasoline station, food services and building material sales). As such, the details will be more upbeat than the headline reading.
Canada: Upcoming Key Economic Releases
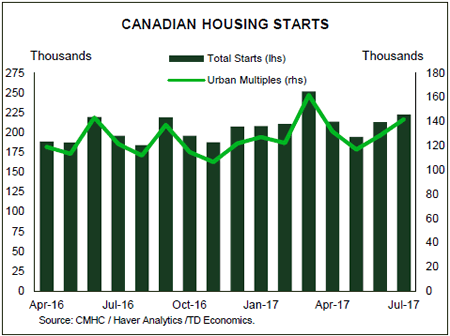
Canadian Housing Starts - August
Release Date: September 11, 2017
Previous Result: 222k
TD Forecast: 195k
Consensus: 215k
Housing starts should slow to an annualized 195k in August from the 222k pace the prior month. Since May, residential construction has bucked the downward trend in the wider housing market due to the strength of multi-unit starts. While much of the slowdown in housing has been contained to the Greater Toronto Area (GTA), we think this uncertainty coupled with the Bank of Canada's decision to begin raising rates will start to weigh on the sentiment of developers. This was partially reflected in July building permits, where the value of permit issuance for multi-unit projects fell by 7.4% due to a sharp pullback in Toronto. As such, we expect most of the slowdown in residential construction to be concentrated in the multi-unit segment while single family construction could see a more modest deceleration towards 60k units.
Catch Key Reversals With The 5-0 Pattern
Catching big reversals is something that many new traders day-dream about but rarely ever succeed in doing. However, the 5-0 pattern offers traders the opportunity to catch these types of market moves by finding a unique entry point.
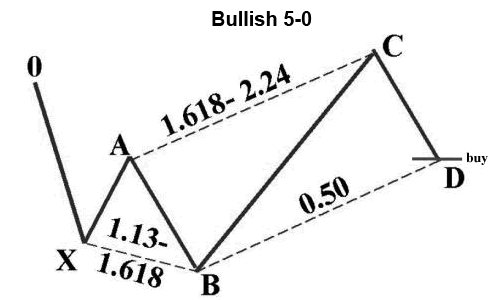
Ok so, looking at the bullish version of the pattern first then. We want to initially identify a bearish drop in price which we call the 0X leg; this is the leg that leads into the setup of the pattern. From here we then need to identify a retracement higher which is the XA leg and the start of the pattern. Price then drops down from here to put in a new low below the X0 low, giving us our AB leg.
For a clean, textbook 5-0 pattern, this low needs to be between the 1.13 - 1.618 extension of the XA leg. This gives us our AB leg. From this low, we then need to see price reverse and trade sharply higher moving back up above the XA leg high to put in a new high between the 1.618 and 2.224 extensions of the AB leg. This gives us our BC leg. From here we then need to see one final retracement lower which completes into the 50% retracement of the BC leg. This gives us our CD leg and should be equal in length to the AB leg. The completion of the CD leg gives us our buying zone.
Let's now take a look at the bearish version of the pattern which follows exactly the same structure and parameters as the bullish version but obviously this time in reverse.
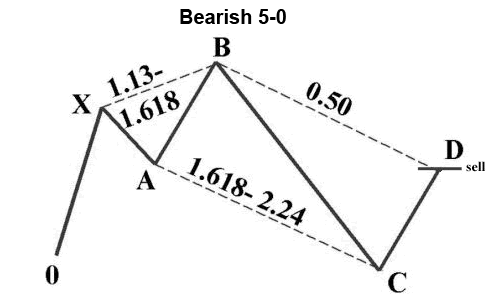
So, first of all, we want to identify a bullish move in price which leads into the setup of the pattern and gives us our 0X leg. From here we then want to see price retrace lower to give us our XA leg. From this point price will then reverse and trade back up to put in a new high above the XA high, which needs to complete between the 1.13 and 1.618 of the XA leg, giving us our AB leg. From this point price then needs to retrace sharply lower to give us our BC leg, which should complete between the 1.618-2.24 extension of the AB leg.
From here the pattern should see one final retracement higher, completing into the 50% retracement of the BC leg. This final CD leg should be equal in length to the AB leg. The completion of the CD leg gives us our selling zone
Trading The Pattern
With that in mind, let's now take a look at how these patterns present themselves on the charts. I've mentioned this before, but one of the key challenges that many traders face with harmonic patterns is getting used to the different ways the patterns can present themselves in practice. Obviously, when we're looking at diagrams, we're looking at nice smooth lines whereas on the charts the patterns can sometimes be a bit harder to spot because of the way that price moves.
So let's look at some examples starting with a bearish 5 - 0.
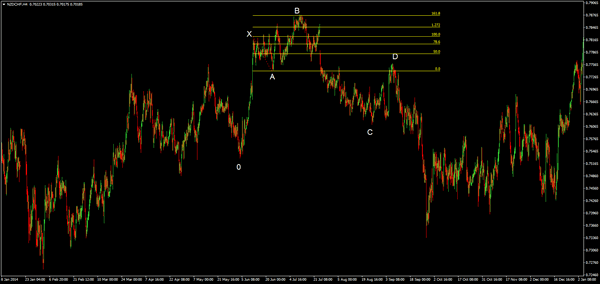
In this example, you can see we have a classic bearish 5-0 pattern, and this example really demonstrates beautifully just how fantastic this pattern is for picking out reversals.
You can see that we have our bullish swing in price initially which gives us our X0 leg before we get small retracement lower to give us our XA leg. From here we then get another push higher where price makes a new high above the initial 0X high. This high completes ahead of the 1.618 extension of the X leg and gives us our AB leg.
From this point, we then get a sharp reversal lower with price breaking down below the XA leg low. This gives us our RB leg. From here you can see that we then get a reversal higher to gives us our CD leg. Importantly, note how this pattern completes into the 50% retracement of the BC leg but is also equal in length to AB leg.
Remember, if you want to check that two price swings are of equal lengths you can simply draw a line in to measure the first one and then clone it and apply it to the second price swing.
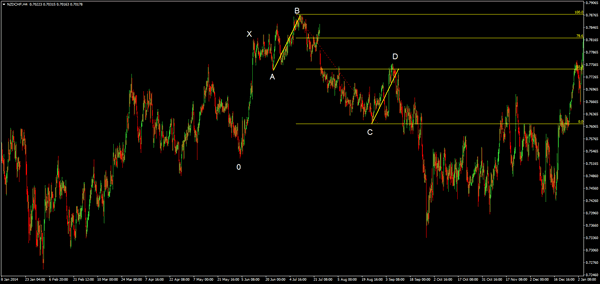
So, the completion of the CD leg into this area gives us our sell zone where we can look to set short orders. In terms of how we trade this pattern, we have two options. We can look to capture a short-term reaction, or alternatively, we can look to enter and hold for a larger move.
In terms of capturing a short-term reaction, we want to enter short at the 50% retracement of the BC leg with a stop above the 61.8% retracement. We then look to target a move back down into the 23.6% retracement. This gives us a roughly 2:1 return. The beauty of trading the pattern in this way is that generally the reaction will happen very quickly and we are able to achieve a positive risk:reward result in a fairly quick manner, and we don't risk running into a reversal when price hits the BC low, which is the key pivot for the pattern when we are holding for a larger move.
While trading the pattern for a larger move, we would again enter at the 50% retracement but this time place our stop above the 78.6% retracement of the BC leg. From here we are then looking to target a move from the CD high that is equal in length to the BC leg. So, to find our target we can simply draw a line in over the BC leg, clone it and apply it from the CD high point.
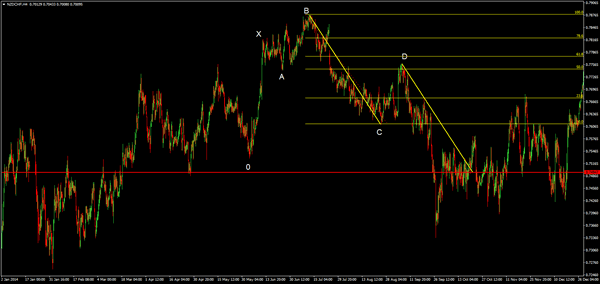
Doing this put our target in down here, just slightly below the 0X low and gives us a roughly 3:1 return to risk. Once price hits this target point, traders can then decide whether to bank their position or hold for a larger trending move. If traders decided to hold for longer, it is prudent to trail their stops lower to make sure they lock in some profits in case price reverses on them.
As you can see, the 5-0 pattern can be an exceptional structure for catching reversals and helps traders enter these moves in a safe and methodical way.
Why Do Support and Resistance Levels Break?
Support and resistance levels or supply and demand levels are the backbones of technical trading. Regardless of the type of technical analysis methods used, be it an indicator based trading system or a price action based trading system, support and resistance levels plays a crucial role.
Although not evident immediately, the moving average crossovers or the overbought and oversold levels on the oscillators are often a product of the support and resistance levels, and in most cases, you can see the signals coinciding with the support and resistance levels.
Common knowledge dictates that traders should buy at support and sell at resistance. However, in some cases, you will find that the support or the resistance level that you were hoping to go long from or short from would be breached. In such cases, if you had a pending order, it would most likely be triggered and in some cases hit your stop loss as well.
This brings us to the question as to why support and resistance levels break and if there is a way to identify stronger levels from the weaker ones.
Why support and resistance levels become weak?
Without going too much into the details, support and resistance levels are areas or price zones where the buying or selling pressure overwhelms the other. Thus, price finds it harder to breach these levels and in most cases results in a reversal in the direction of prices.
But this is not always the case as time evolves, these concentrated areas of buying and selling pressure start to become diluted.
Once the levels are weak enough, the price is able to break out from these levels with relative ease.
There are many different ways price breaches or breaks a support or resistance levels. The most common ways are:
- Price breaks the support/resistance level with a strong bullish or bearish candlestick
- Price hovers around the support/resistance level, makes a fake breakout and then breaks the support/resistance level
The first example below shows two of the instances mentioned.
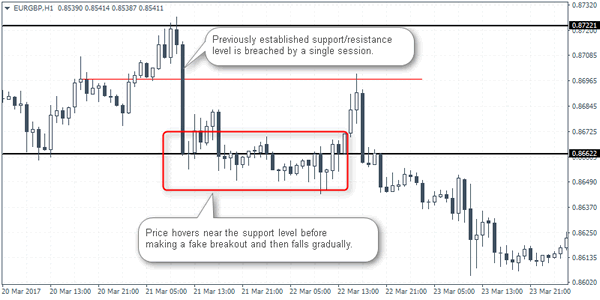
Example 1: Support and resistance levels break
There are a number of reasons why support and resistance level can be breached, but here are the most commonly occurring reasons.
Undiscounted news event
The markets typically tend to discount all the news there is to know. Thus, when some new information is revealed, the markets adjust accordingly. This leads to a strong bullish or bearish candlestick that break the most obvious or the nearest support and resistance levels.
In most of these cases, prices don't make a pullback when a support or a resistance level is breached strongly, and trends are often the strongest here at least for a few more sessions.
Price consolidation
When price consolidates around a support or resistance levels, investors start to accumulate prices. The longer price consolidates near a support or a resistance level, the weaker these levels become. Very often, all it takes is a mere market report or an economic release to break past the supply and demand zones.
Fresh versus stale support and resistance levels
Traders should know that a support level can act as resistance and vice versa when it is breached. Support or resistance level is known to be strongest on the first test, and there are higher chances that these levels will hold.
However, caution should be applied as this is not always the case. The next example shows how a freshly formed support level is eventually breached, despite the level staying relatively fresh (being tested just once as support).
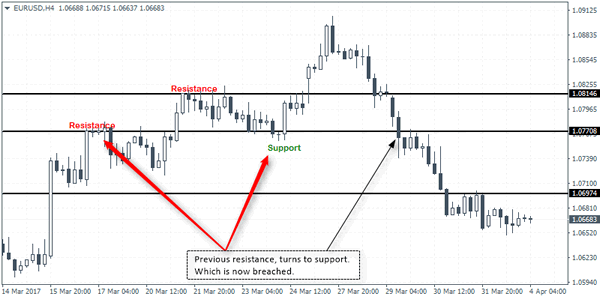
Example 2: Freshly created support level is breached
As the above examples suggest, support and resistance levels continue to change as price continues to unfold and new information is digested by the markets. Once a support or resistance level is identified, it is always best to validate these levels with another indicator or with some fundamental analysis in order to ascertain whether the levels will hold or break.
As always, using a level of invalidation for the analysis as the stop loss level can be a simple yet objective way to not only protect the losses but also as a way to invalidate the analysis.
Scalping: How to Opportunistically Trade the FX Market
Scalping is an area of Forex trading that always appeals to new traders because of the potential to make big profits, quickly. However, with the high level of reward also comes a high level of risk, so it is super important that you take the time to properly understand scalping before applying it to live markets. As ever we are going to take things slow and steady and make sure that we cover everything so that you are really comfortable.
So, first of all then, what is scalping?
Instead of referring to a specific strategy, scalping refers more to a way of approaching the markets where the trader looks to exit trades as quickly as possible with the intention of capturing only very, very small moves in price. So, where a swing trader on the higher time frames will look to take a trade lasting anywhere between a day and several weeks, looking to capture percentage moves in price, a scalper will look to hold a position for anywhere from a few seconds to a few minutes looking to capture anywhere between 2 – 20 pips usually.
Objectives of Scalping
As scalpers are only targeting such small pip gains, they typically trade with a higher position size than a swing trader would, to make the trade more meaningful. This increased position sizing brings the potential for big profits, quickly, unless, traders are careful they can also expose themselves to large risks. This is why it is extremely important for traders to focus on risk management when trading scalping methods. Key among these is always trading with a stop.
As scalpers typically trade with relatively large position sizes, trading without a stop can quickly see losing positions escalate into unnecessarily large losses. However, if traders always apply a uniformed risk profile and make sure to trade with a stop loss, this creates plenty of room for achieving large trading profits without taking unnecessary risks.
Time Requirements For Scalping
Due to the nature of scalping, it is only suitable for those traders who have plenty of free time to focus on the markets as it can be an intense and time-consuming task. Despite the fact that trades are only held for very short durations, scalpers typically spend a great deal of time watching the markets waiting for trades to setup.
Because they are focusing on the lower time frames where the volatility is more pronounced, scalping is a task which requires a high level of focus. However, for traders who have the necessary time and are able to develop the skills and the discipline required, it can be an extremely rewarding way to approach the market.
Opportunistic Trading
The beauty of scalping is that it allows traders to operate opportunistically in the market, placing trades based on only very short term reactions, instead of a broader directional view. Scalpers typically use strategies that are based purely on technicals while longer term traders might combine technical analysis with fundamental inputs to arrive at a bias for a certain currency pair.
Due to the very short term nature of scalping and the fact that traders are only looking to achieve very small pip targets per trade, it is incredibly important for traders to find a good broker to deal with as unnecessarily wide spreads, as well as slippage, can have a damaging impact on a scalper's results over the long term. Fortunately, Orbex offers very tight spreads and traders rarely suffer any slippage, which makes us a perfect Broker for traders looking to operate a scalping approach.
Exponential Moving Average Revealed
A Moving Average is one of the most widely used indicators in the financial markets.
Like most indicators, it is very easy to apply on the price chart - you simply drag it onto the prices. Its interpretation is also fairly straightforward; buy above or sell below the moving average line. It's no wonder that so many technical traders, even fundamentalists, use it for their analysis and trading.
Of course, moving averages come in many 'flavours'. Simple Moving Average, Linear Weighted, Geometric, Exponential, Triangular, Volume Adjusted and Variable, to name a few.
If you are new to moving averages, you may be wondering which method is best.
Simple Moving Average (Arithmetic)
Most traders start experimenting with the Simple Moving Average (Arithmetic) in the early stages of their trading career.
This is calculated by adding the closing price of a number of candlesticks (equal to the time period of the moving average) and then dividing this number by the total number of prices. The result is known as the average. The oldest price is then dropped (i.e. discarded from the calculation) and the same formula is applied to the next prices. Therefore, it becomes the moving average.
For example, the calculation of a 5-period simple moving average begins with the prices from index 7 to 3, then the price of index 7 is dropped and the next average includes prices of index 6 to 2, after which the price of index 6 is discarded and the next calculation uses prices of index 5 to 1:
| Index | Price | Average |
|---|---|---|
| 7 | 1.10110 | |
| 6 | 1.10120 | |
| 5 | 1.10125 | |
| 4 | 1.10140 | |
| 3 | 1.10143 | 1.101276 |
| 2 | 1.10149 | 1.101354 |
| 1 | 1.10156 | 1.101426 |
Here is the formula in the form of a mathematical notation:
Simple Moving Average = [Price(n) + Price(n-1) + Price(n-2) + … + Price(1)] / n
Where n is the period of the moving average.
However, when investors gain more trading experience, they start to understand the disadvantages of the simple moving average. Lagging, for example, takes into account only those prices in the time interval and assigns equal weight to all prices in the period. In an attempt to address these types of issues, technical analysts came up with other calculation methods, such as the Exponential Moving Average (EMA).
EMA
This method addresses the biases inherent in the simple moving average, specifically issues with equal weight, since it only accounts for the prices in the predefined period. As a matter of fact, EMA takes into account all available prices in its calculation and assigns more weight to the most recent prices. Lagging, though, remains a disadvantage.
Here is the EMA formula:
EMA = (Price(i)*P)+(EMA(i-1)*(1-P))
Where P is the period and i is the candlestick index.
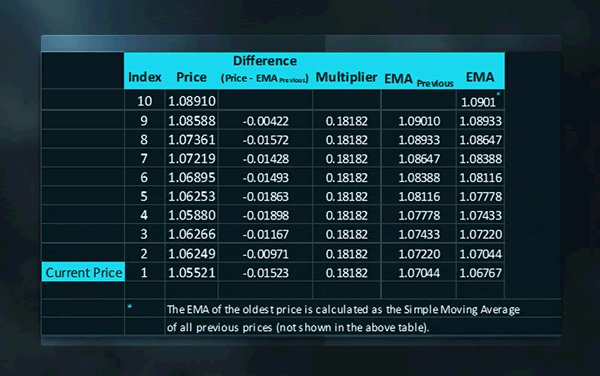
This is a recursive formula that even the most experienced traders would have difficulty understanding. Perhaps, if we write the formula in a different way, it will be easier to understand. For example:
EMA = (Price current - EMA previous) * multiplier + EMA previous
Where multiplier = 2/Periods + 1
Let's take a look at the calculation of a 10-period Exponential Moving Average. Note that the oldest EMA (i.e. for index 10) is calculated as a Simple Moving Average of the previous prices.
Multiplier = 2/(Period+1)
= 2(10+1)
= 2/11
= 0.18182
Number of Periods
One of the biggest dilemmas a trader faces is deciding how many periods to use with the EMA.
There are a few variables to consider when deciding on the periodicity of a moving average, these include:
- Market Convention
- Constant
- Volatility
- Optimisation
- The predominant cycle
In the stock market, we notice that traders usually rely on moving averages that are 200 periods long. In the foreign exchange market, the period is much shorter; at times it's 50, 20 or 10. Another decisive factor may be the volatility in the specific market. Trending markets imply shorter periods, where low volatility suggests longer lengths to avoid whipsaws (false signals). Frequent optimisation is another way of identifying the "best" possible period. On the other hand, some traders use a constant period for all markets and all timeframes. The choice is yours!
Trend Analysis
Trend identification is one of the easiest ways to use a moving average. When prices rise above the line, then an upward movement could be in the making.
On the other hand, when prices fall below the line, then a downward movement could be starting.
Moving averages make extreme identification look very easy. When prices are far above the moving average, this may signal overbought trading. When prices are far below the moving average, it's an indication that oversold levels may have been reached.
Interpretation
Just like the Simple Moving Average, a buy signal is generated when prices move above the moving average. Similarly, a sell signal is generated when prices fall below the moving average. To avoid false signals, price confirmation is needed most of the time. For example, a buy signal would require a close above the moving average line. Similarly, a close below would be needed for a sell signal.
Undoubtedly, whipsaws or false signals remain one of the major disadvantages of moving averages. One way to reduce them, is by waiting for the 'tip' of the moving average line to turn upwards before placing a buy order, or to point downwards when placing a short position. Needless to say, all signals require confirmation by the price itself.
Of course, moving averages may be combined with other indicators and oscillators to provide traders with greater precision.
Conclusion
The Exponential Moving Average is a useful tool that is part of many traders' arsenals. Its simplicity in trend identification, as well as the fact that this method addresses both criticisms of the simple moving average, makes it the method of choice for many traders. Unfortunately, combined with the delay in signals, false signals can cause difficulties when caught in a sideways market.
The Secret Behind Bearish Trend Reversals
Trader's looking to enter the market are often sent off on a journey to discover the 'holy grail' of market entries. They study numerous theories; Japanese candlestick reversals, contrarian theory, oscillator divergence, wave theory, and others. Traders who are just starting out, put their trust in indicators and oscillators and rely on them make the decisions on when to place an order - and the more indicators/oscillators they discover, the more they add into their strategy.
The most neglected indicator/oscillator is price. That's right, price! Price is superior to any indicator and all others come second. It's the only indicator that encompasses everything - economic factors, political and geographical. Novice traders often do not understand the importance of price and most of the time, they don't give it the attention it deserves.
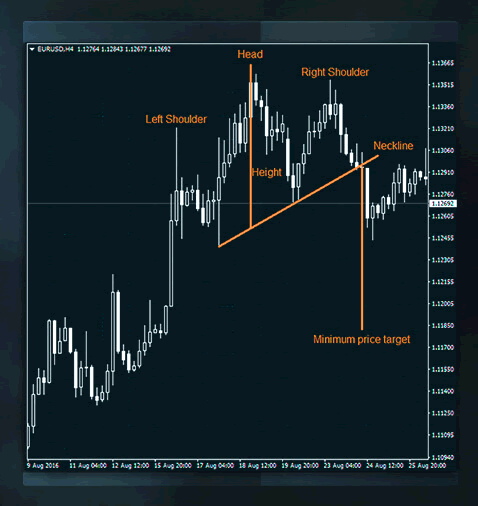
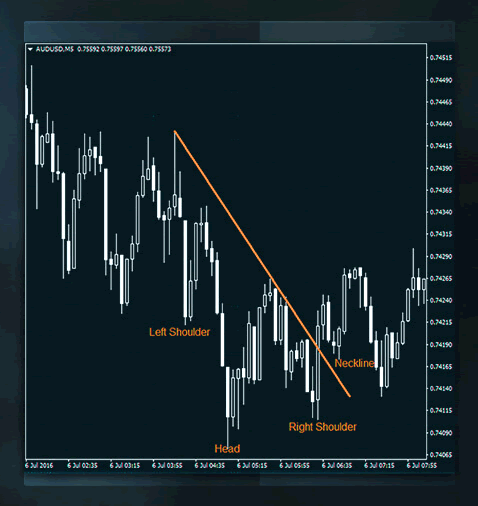
The most effective market entry is trend reversal. After an ongoing trend towards one direction, the market eventually signals the end of that trend and begins a new one towards the opposite direction. In this article, we'll be focussing on a few of the most popular reversal patterns: head & shoulders, double top and triple top.
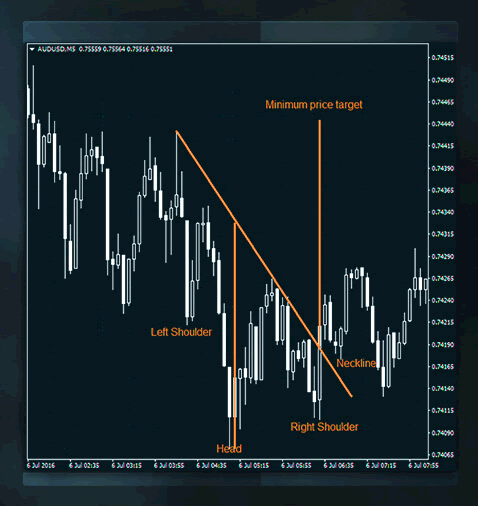
Head & Shoulders
Head & Shoulders have a reputation for being one of the most dependable reversal patterns. It's a pattern based on price movement and indicates the start of a new trend in one direction, after an ongoing trend in the other direction ends.
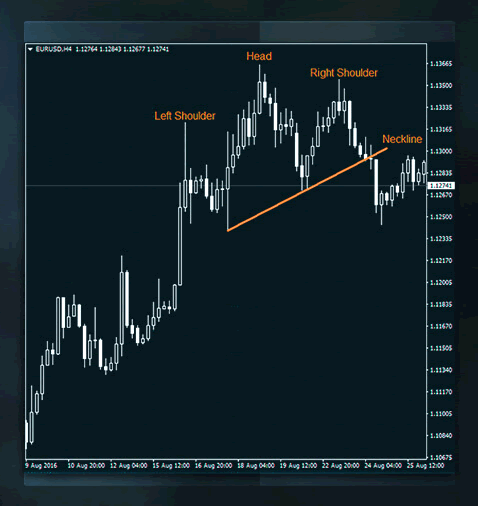
How to spot Head & Shoulders:
- To have a reversal, an existing trend needs to exist, and head & shoulders is no different.
- A prevailing uptrend (in this case) is made up of consequent higher tops and bottoms.
- If volume is available, it signals alerts.
- An upwards move to the Head often illustrates decreased volume (if available) and signals a warning.
- The right Shoulder is lower than the Head and indicates a potential reversal.
- A significant close below the neckline (with increased volume, if available) indicates the end of the uptrend and the start of a downtrend.
- To calculate the minimum price target, project the height of the pattern to the neckline's breakout point.
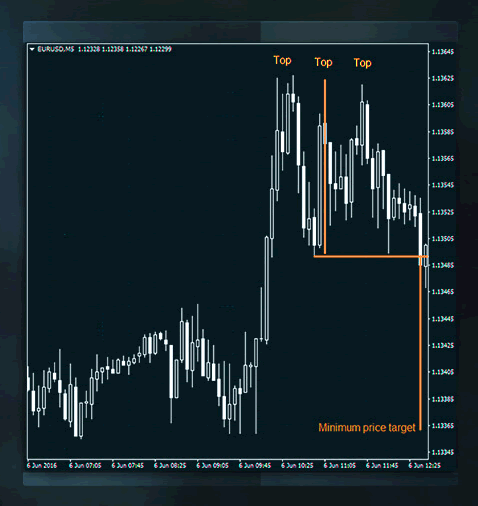
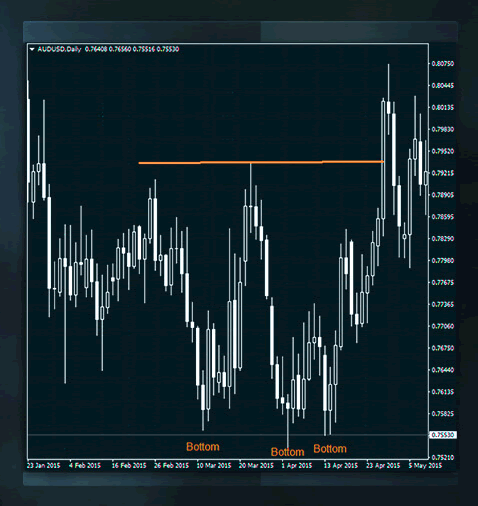
Triple Tops
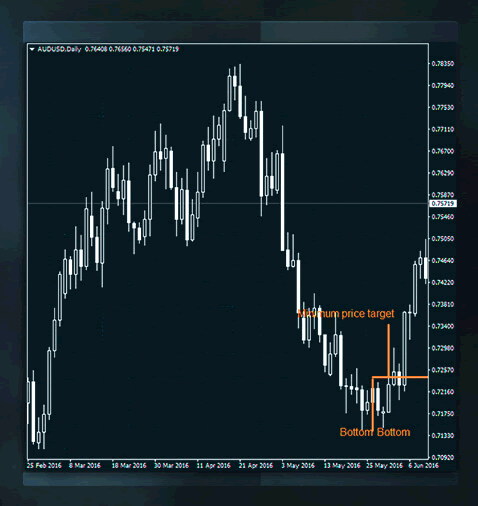
Similar to the Head & Shoulders, the Triple Top is made up of three (almost) equal tops and a significant close below the support (bottom) of the formation. It's important to have a break below the bottom in order to have a valid Triple Tops. The three tops on their own are not enough!
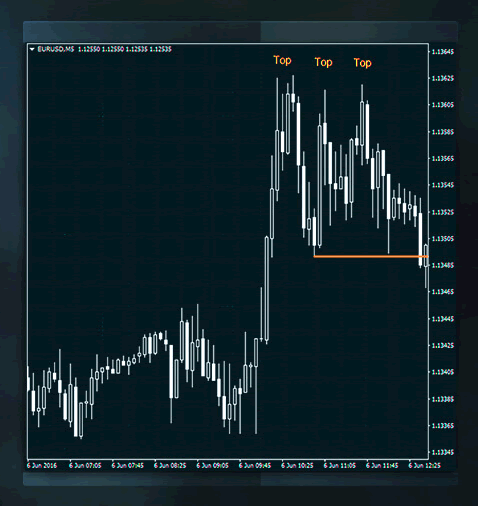
How to spot Triple Tops:
- An existing trend (in this case an uptrend) is vital before you go looking for a reversal.
- As with Head & Shoulders, the existing trend is marked by its consecutive higher tops and bottoms.
- If volume is available, it signals alerts.
- The upwards move to the resistance area indicates decreased volume (if available) and signals weakness to move higher.
- Equal (or almost equal) tops make up the resistance area.
- A significant close below the bottom (with increased volume, if available) indicates the end of the uptrend and the start of a downtrend.
- To calculate the minimum price target, project the height of the pattern to the breakout point.
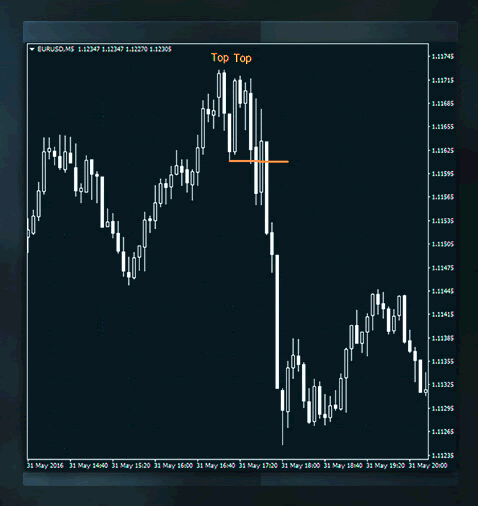
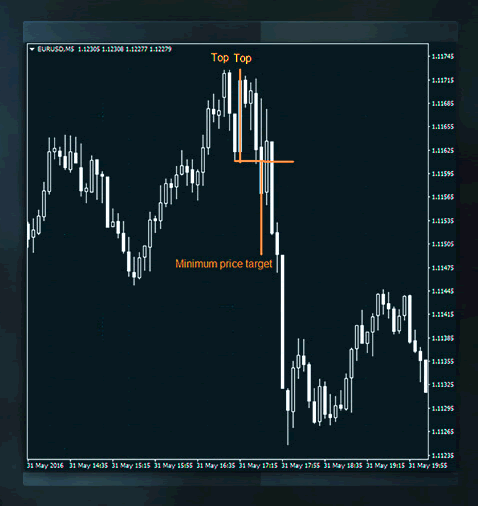
Double Tops
During an uptrend, a top might surpass a previous top if the demand exceeds the supply. When that trend runs out of gas, it will start showing signs (signals) of weakness. If volume is available, then a decrease in it will be the first signal as it moves upwards. Another signal is if the last top fails to go higher than the previous one. A reversal is confirmed if prices break below the bottom/support area.
How to spot Double Tops:
- An existing trend (in this case uptrend) is necessary.
- The existing uptrend is defined by consecutive higher tops and bottoms.
- If volume is available, it signals alerts.
- The upwards move to the resistance area indicates decreased volume (if available) and signals weakness to move higher.
- The tops are equal (or almost).
- A significant close below the bottom (with increased volume, if available) indicates the end of the uptrend and the start of a downtrend.
- To calculate the minimum price target, project the height of the pattern to the breakout point.
Price rules supreme over oscillators and indicators. Price discounts for everything that affects the markets and reveals the crowd's (traders) psychology. There are many bearish or bullish trend reversal patterns, and traders should pay more attention to them rather than experimenting solely with candlestick reversals and oscillator signals. Available volume in combination with oscillator analysis, can confirm reversal patterns with higher potential accuracy.
Explaining Bullish Trend Reversals
Traders can spend countless hours and days looking for ways to enter the financial market. On their journey to discover the 'Holy Grail' of market entry, they explore Japanese candlestick patterns, contrarian concepts, the large variety of oscillators, the Elliot Wave theory, and a lot of other technical approaches. Beginners usually learn from oscillators and indicators how to identify entries into the market; the more indicators and oscillators get studied, the more they're used in trading.
However, a lot of novice traders neglect one of the most important indicators and oscillators out there - price! The price gives you the full picture of the market, factoring in economic, political and geographic variables. A lot of traders who are just starting out find it hard to use the price as an indicator because they don't have the experience, so they usually cast it aside and put less weight on it. The truth is, price is the greatest indicator - everything else comes second.
As far as the best market entry point goes, most experienced traders already know that it's the trend reversal. This is the point at which a dominating trend reverses course, signalling a shift in the opposite direction. While forex trading is filled with reversal patterns, for the purposes of this article, I will be discussing three types.
Reversal Pattern #1: Inverse Head & Shoulders
After a succession of lower tops and lower bottoms, there comes a moment when a bottom fails to go lower than the preceding one. This is the critical point when demand overpowers supply, and the market becomes crowded with buyers looking to enter aggressively and push the price higher.
Inverse Head & Shoulders: Seven Things You Need To Know.
- A recognised downtrend needs to exist.
- A downtrend means a succession of lower tops and lower bottoms.
- Where available, volume indicates alerts.
- Where available, decreased volume - associated with a downward move to the head - indicates a warning.
- An imminent reversal is signalled when the right shoulder is greater than the previous bottom (or the head).
- Where available, increased volume - associated with a decisive close above the neckline - indicates the end of a downtrend and the start of an uptrend.
- By projecting the elevation of the inverse head and shoulders pattern to the breakout on the neckline, the minimum price target can be calculated.
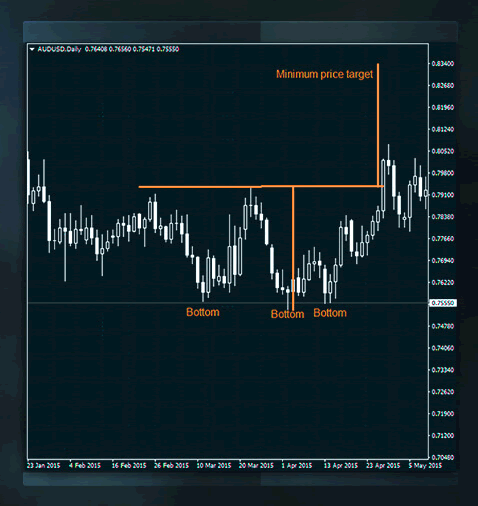
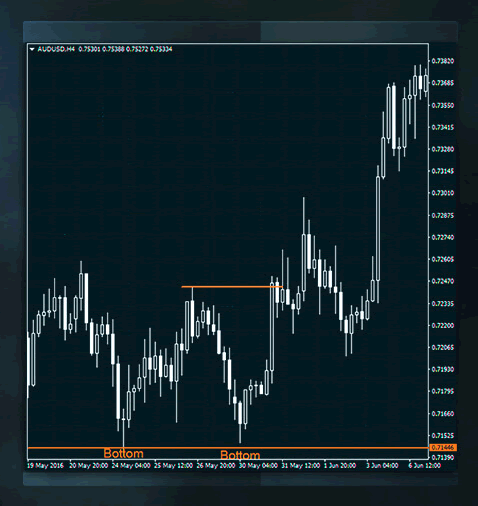
Reversal Pattern #2: Triple Bottoms
Similar to the previous reversal pattern, triple bottoms indicate that a downtrend is ending and an uptrend is beginning. Three equal, or nearly equal, bottoms make up this price pattern - together with a definitive close above the resistance (the top) of the formation. It is imperative that prices break over the top of this pattern; otherwise it's not a triple bottom reversal.
Triple Bottoms: Seven Things You Need to Know
- A recognised downtrend needs to exist.
- A downtrend occurs with a succession of lower tops and lower bottoms.
- Where available, volume indicates alerts.
- Where available, decreased volume - associated with a downward move to the support - indicates a warning.
- The pattern's support area is formed when the bottoms are equal or nearly equal.
- Where available, increased volume - associated with a decisive close above the resistance - indicates the end of a downtrend and the start of an uptrend.
- By projecting the elevation of the triple bottom pattern to the breakout point, the minimum price target can be calculated.
Reversal Pattern #3: Double Bottom
A downtrend will be in full force, as long as there is a succession of lower tops and lower bottoms reflected in the price action. In this scenario, supply overcomes demand and negative sentiment pushes the prices down to lower levels. Where available, volume would indicate the first sign of weakness if it decreases on its way down. A second warning is signalled when the last bottom fails to move lower than the preceding one. Once the price breaks over the resistance level with increased volume (where available), the double bottom reversal pattern is complete.
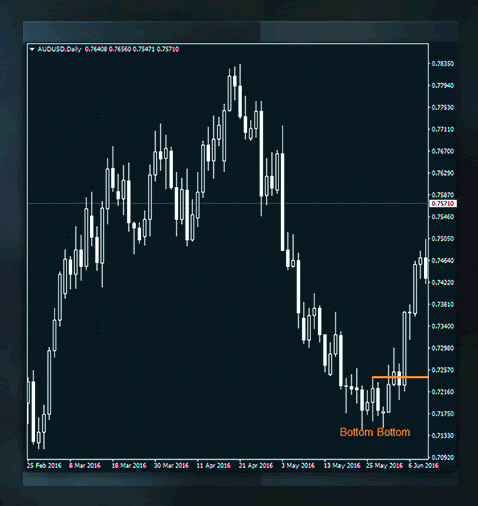
Double Bottom: Seven Things You Need to Know
- A previously recognised downtrend needs to exist.
- A downtrend occurs with a succession of lower tops and lower bottoms.
- Where available, volume indicates alerts.
- Where available, decreased volume - associated with a downward move to the bottom - foreshadows an imminent reversal.
- The pattern's support area is formed when the bottoms are equal or nearly equal.
- Where available, increased volume - associated with a decisive close above the resistance - indicates the end of a downtrend and the start of an uptrend.
- By projecting the elevation of the double bottom pattern to the breakout point, the minimum price target can be calculated.
In Conclusion
There are multiple varieties of bullish trend reversals. Many traders, especially novices, tend to experiment with candlestick reversal patterns and oscillator signals, but they seldom explore reversal patterns that are dictated by price. In reality, price is boss and second to none. Price charts incorporate all external factors, including political, economic and environmental data.
Through price, one understands the psychology of the market and its participants. Thus, reversals with a high probability, are directly based on price patterns that are quickly spotted on the chart. For even better accuracy (and where available), volume - together with oscillator analysis - may be used as further confirmation of reversal patterns.
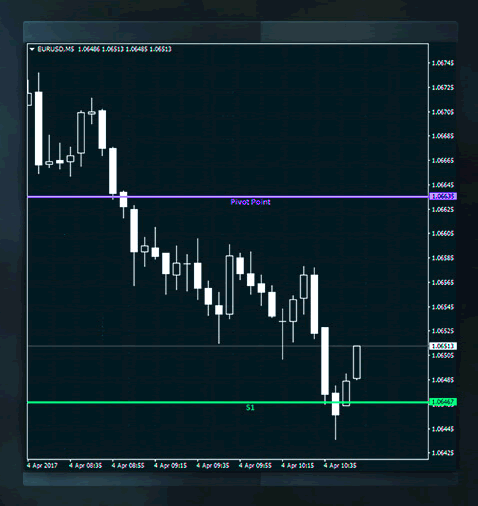
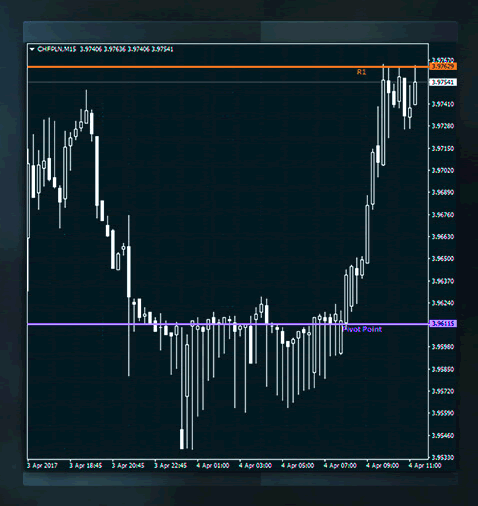
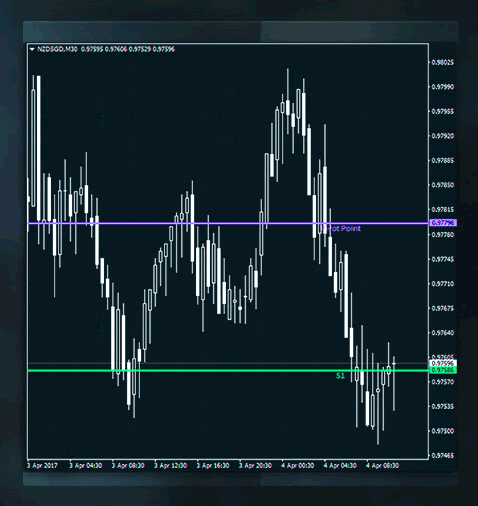
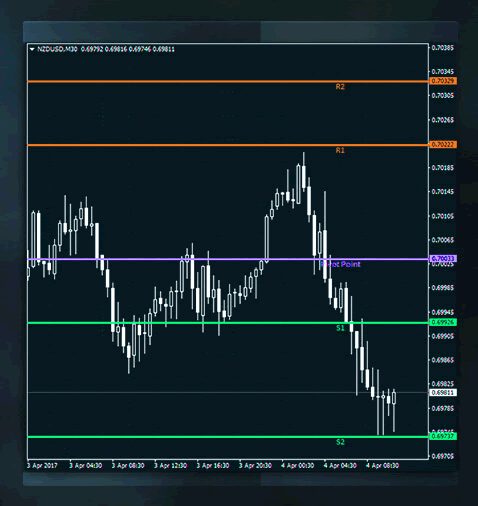
Understanding Pivot Points
Pivot points are extremely popular with traders, they are used to spot direction, probable reversal points and potential support and resistance levels. It's a well-known tool that is of particular interest to novice traders, due to the simplicity of the mathematical formulas it incorporates.
In the past, pivot point calculations were used on daily, weekly and monthly timeframes. These days, new technology means we can calculate pivot points on smaller timeframes too.
Pivot points use the previous period's open, close, high and low prices to calculate the current period's direction and future support and resistance levels.
Formula
To identify possible turning points on current candlesticks, a pivot point calculation uses the formula below:
Resistance 3 = High + 2*(PP - Low)
Resistance 2 = PP + High - Low
Resistance 1 = 2*PP - Low
Pivot Point(PP) = (High + Low + Close) / 3
Support 1 = 2*PP - High
Support 2 = PP - (High - Low)
Support 3 = Low - 2*(High-PP)
After the main pivot point is calculated; using the most recent candlestick's typical price ((High + Low + Close) / 3), you can proceed with calculating possible support and resistance levels.
The pivot point, in combination with the support and resistance levels, is an intraday trader's 'guide' to the financial markets.
The concept states that, when prices float above the defined pivot point, the market is moving in a bullish direction and is likely to continue moving in an upwards direction, and vice versa. When the prices go below the pivot point, then the market is bearish and prices will probably move towards a downward direction.
Trading Pivot Points
Long positions opened above the pivot point can potentially meet resistance (R1-resistance level 1), which opens an opportunity for day-traders to lock in potential profits. A strong upwards surge above R1, could potentially open the path to more profit opportunities at higher resistance levels (R2 and R3). A protective stop-loss below the pivot point is recommended to avoid losses in case of unexpected volatility.
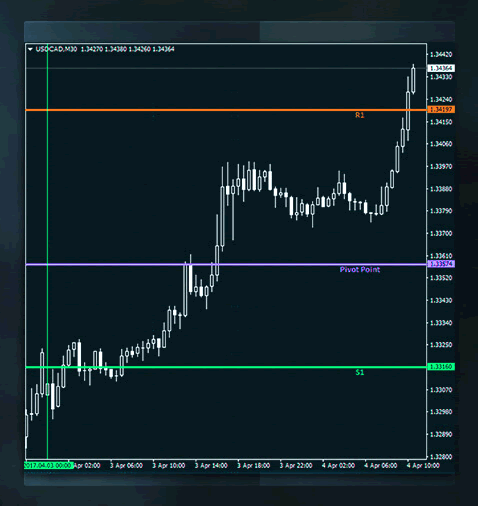
In the same way, short positions opened below the pivot point can potentially meet support (S1 - support level 1), opening the path for day traders to lock in potential profits. A strong downwards surge below S1 could can potentially lead to additional profit opportunities at lower support levels (S2 and S3). A protective stop-loss above the pivot point is recommended to avoid additional loses, in case of unexpected volatility.
Sideways movements are confined between the pivot point and R1, which are potential buying and selling opportunities for range traders, when prices bounce off the pivot point and rebound back from R1.
In case of a breakout above R1, prices could potentially be driven towards R2, and the pivot point will serve as support and vice versa. If a breakout below the pivot point occurs, then prises can potentially drop further towards S1 and the pivot point will act as resistance.
Additionally, if prices are under the pivot point they may meet support at S1 and bounce back up towards the pivot point.
When prices are confined between the pivot point and S1, also known as a range, potential trading opportunities can occur for buyers when prices bounce off S1 and for sellers when prices bounce back from the pivot point.
Techniques
In total, there are five pivot point techniques used for calculation - including the Standard technique which is the most popular.
1. Standard.
2. Fibonacci.
3. DeMark's.
4. Woodie's.
5. Camarilla.
All techniques, apart from the DeMark formula, use the previous period's high, low and close prices to calculate the pivot point. The DeMark formula uses the relationship between the open and close price, to define one of the three formulas that will be used to calculate X in the appropriate pivot point calculation. In addition, Camarilla uses the current period's open price in the pivot point calculation.
Pivot point calculation techniques vary in terms of the weight assigned to each pivot point level, these are - pivot point, support and resistance, and the distance between each pivot point.
Conclusion
The reason pivot points are still some of the most valuable tools in forex trading, is because they provide a simple way of understanding which direction the market is heading in.
Markets are bullish when prices are above the pivot point and bearish when prices are below.
This tool allows the trader to easily calculate potential support and resistance levels, where prices may halt before continuing to trade sideways, or break above or below a range depending on the supply or demand.
However, just like with any technical analysis tool, in order to give your trading strategy the best potential, pivot points should be combined with other indicators/oscillators and candlestick reversal patterns for extra confirmation.
Support and Resistance Revealed
Most traders, including novices, know that prices that reach the support line, bounce up and prices that reach the resistance line retract. This applies to price activity within a range. In fact, it taps into the very definition of range - price action within a bounded area on the chart. Due to this, range trading is very popular - so much so, that many systems have been designed around trading support and resistance and extracting the most out of the predetermined path of the price.
The problem is that it's difficult to know when the price will ultimately break free from the sideways movement of the range, particularly when volume isn't readily available.
What is Support?
The point when demand overcomes supply, right below the price in question, is known as the support. To put it another way, at this level prices are pushed higher because there's more pressure to buy than to sell.
Once prices reach this level, the dominant movement (downward) stops and the direction changes upward. Support is sometimes referred to as a bottom, or trough.
What is Resistance?
The point where supply overcomes demand, right above the price in question, is known as the resistance. To put it in another way, at this level, prices are pushed lower because there's more pressure to sell than to buy.
Due to this, once prices reach this level, the dominant movement (upward) stops and the direction changes downward. Resistance is sometimes referred to as top, or peak.
What is Uptrend?
A succession of higher tops (or peaks) and higher bottoms (or troughs) form a pattern known as the uptrend. During this type of trend, the levels of resistance are unable to withstand buying pressure as demand dominates supply. As a consequence, prices go through resistance levels and register higher highs on the chart.
What is a Downtrend?
A succession of lower tops and lower bottoms form a pattern known as the downtrend. During this type of trend, the levels of support are unable to withstand selling pressure, as supply dominates demand. As a consequence, prices break through support levels and register lower lows on the chart.
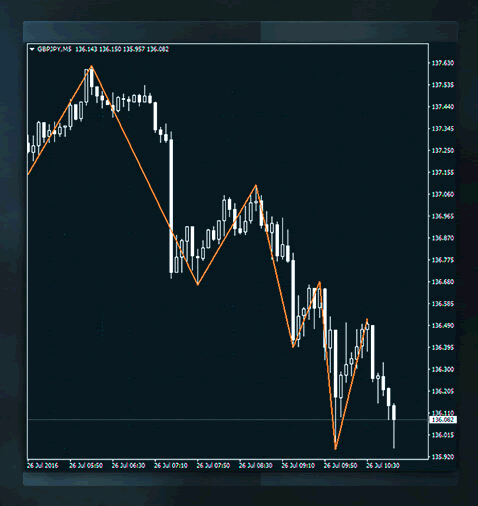
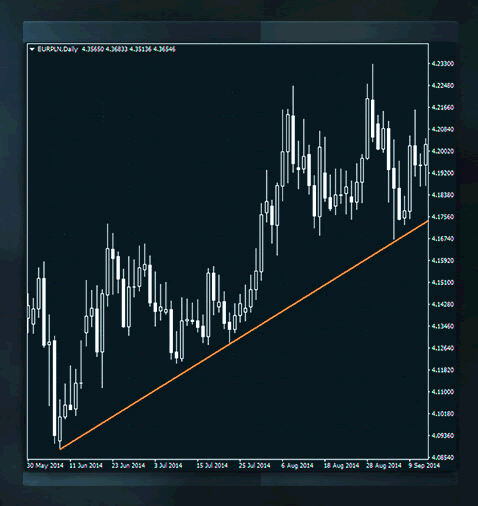
What are Uptrend Lines?
The uptrend line stands in for support during an upward price movement; i.e. it is the line at which prices usually bounce up. As with support, prices are forced higher because there's more pressure to buy than to sell.
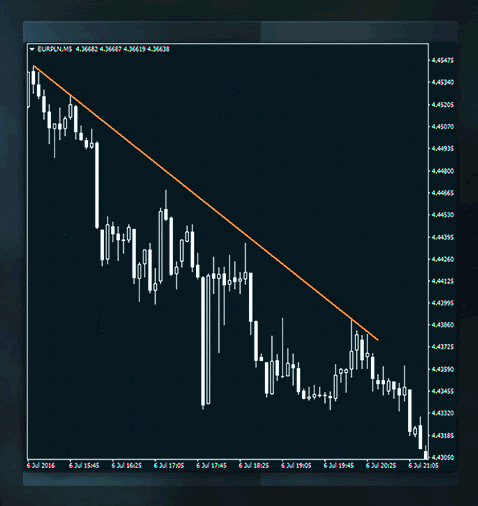
What are Downtrend Lines?
The downtrend line stands in for resistance during a downward price movement; i.e. it is the line at which prices usually get pushed back down. As with resistance, prices are forced lower because there's more pressure to sell than to buy.
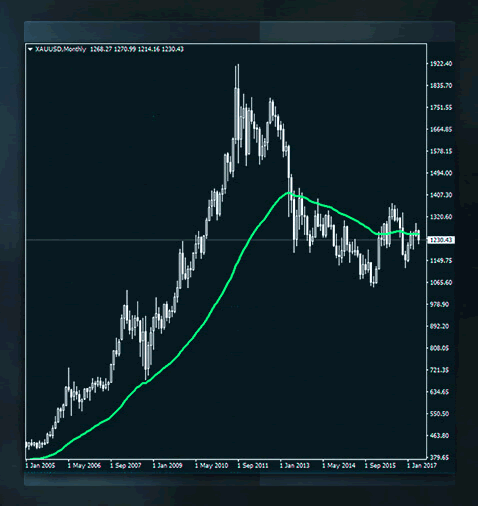
The Role of the Moving Average
If you want proof that support and resistance levels are not only marked by straight lines, you just need to look at moving averages. These curved trend lines also act as support and resistance.
During an upswing, the price moves away from the moving average and registers higher highs - indicating that demand is overcoming supply. Once the price retreats, it finds support by the moving average, as the pressure to buy becomes stronger than the pressure to sell.
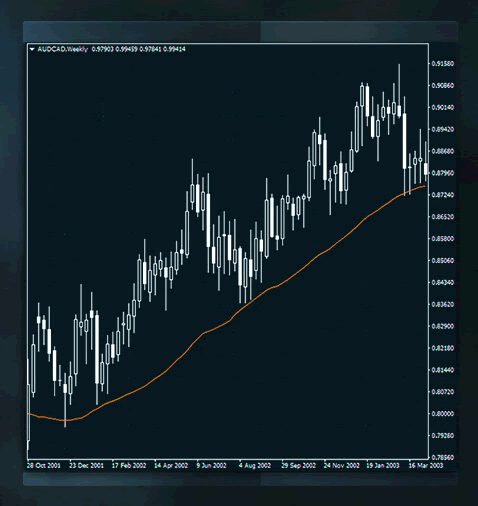
The opposite is true during a downswing. Price moves away from the moving average and registers lower lows - indicating that supply is overcoming demand. Once the price bounces back up, it finds resistance by the moving average as the pressure to sell becomes stronger than the pressure to buy.
How to Trade Support
Most traders keep a very close eye on support and resistance levels during their trading. The logic is quite simple; since prices tend to bounce upward from the support line, the natural reaction is to find a reason to buy.
These reasons usually come in the form of a bullish pattern, such as a double bottom, inverse head and shoulders, or a triple bottom, to name a few examples.
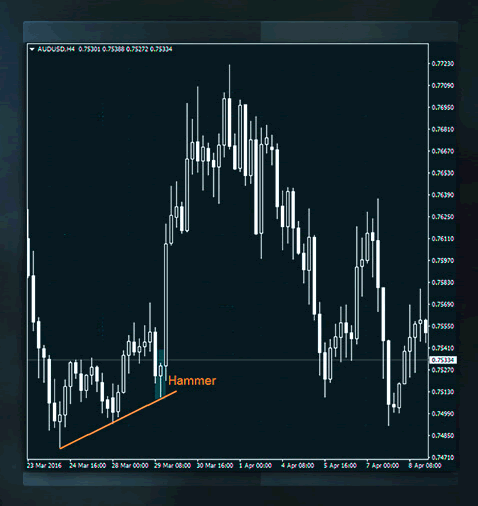
Another reason to buy would be if a bullish candlestick formation like a hammer, is spotted for example.
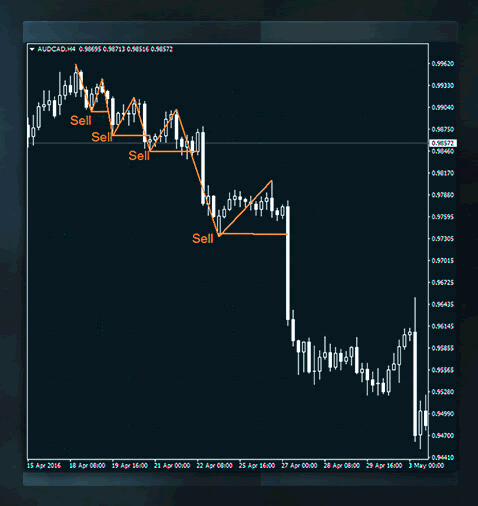
How to Trade Resistance
Since prices tend to pull downward from the resistance line, the natural reaction is to find a reason to sell.
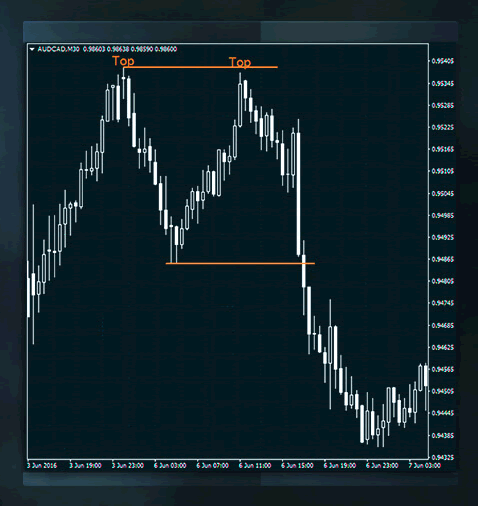
These reasons come in many shapes and sizes, including the presence of a double top, head and shoulders, or triple top formation.
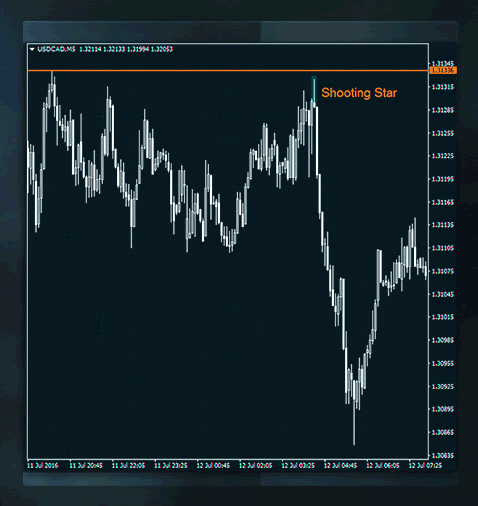
Another reason to sell would be if a bearish candlestick formation, like a shooting star, is spotted for example..
What is Swing Trading?
Price action is often known to crack the support line and break through the resistance - going against the usual tendency of getting stopped by either level. This price movement can occur during either an uptrend or a downtrend.
In the case of an upward trend, traders tend to buy when the price action punctures through the resistance level. The same is true during a trend reversal; i.e. when a downtrend ends its trajectory and an uptrend starts to form.

In the case of a downward trend, traders usually sell when the price action goes beyond the support level. The same is true during a trend reversal; i.e. when an uptrend ends its trajectory and a downtrend starts to form.
In Conclusion
Many traders will look to support and resistance levels whenever they want to get the most out of a predefined pattern of behaviour, within a limited area on the chart, like a range.
Common practice sees buying at the point when the price bounces from support, and selling when it pulls back from resistance. Traders are warned to be cautious and not get too comfortable when trading support and resistance, but generally speaking, if this kind of behaviour becomes apparent, it's usually a sign of good trading opportunities.
When trading support, look for a solid technical reason to buy - don't just rely on the fact that the price reached the line. The same goes for selling at the resistance level.
In the event that resistance doesn't hold up during an upward movement, and prices burst through one resistance level after another, this becomes a trend-following opportunity to buy.
In the event that it doesn't hold up during a downward movement, and prices breach one support level after another, this becomes a trend-following opportunity to sell.
Ultimately, regardless of what some say, following support and resistance levels can be valuable for a trader, but they should not be relied on completely. Sometimes they hold and sometimes they don't! So trade wisely.