Sample Category Title
NZD/USD Candlesticks and Ichimoku Analysis
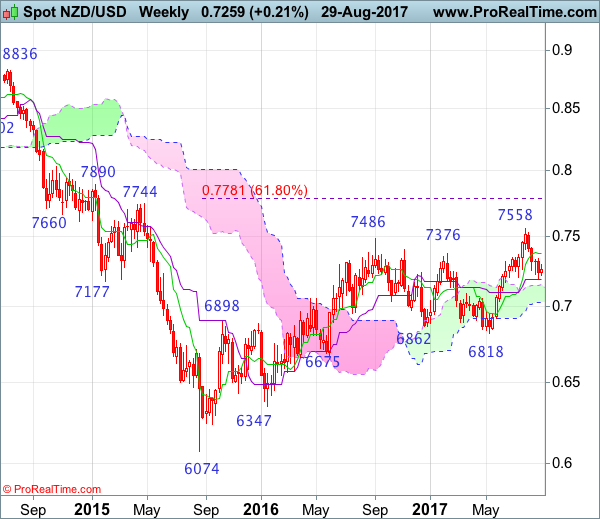
Weekly
• Last Candlesticks pattern: N/A
• Time of formation: N/A
• Trend bias: Up
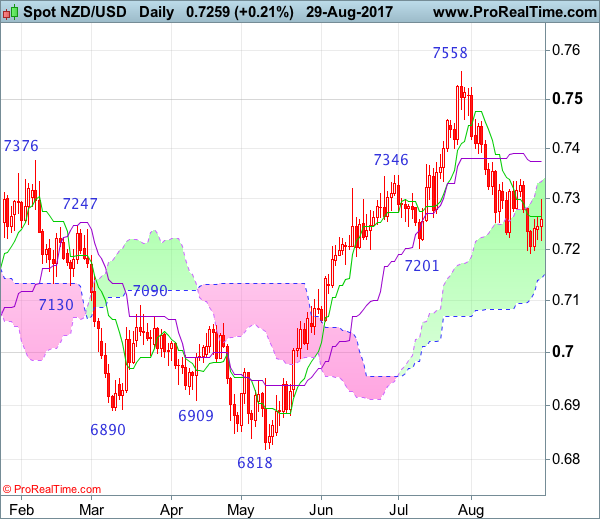
Daily
• Last Candlesticks pattern: Long black candlestick
• Time of formation: 1 Aug 2017
• Trend bias: Up
NZD/USD – 0.7237
As kiwi found good support at 0.7192 last week and has recovered since, suggesting consolidation above this level would be seen and recovery to 0.7299, then 0.7335-40 cannot be ruled out, however, reckon the Kijun-Sen (now at 0.7375) should limit upside and bring another decline later. Below 0.7215-20 would bring retest of said support at 0.7192 but break there is needed to confirm the fall from 0.7558 top has resumed and extend weakness to 0.7145-50, then towards 0.7095-00 which is likely to hold from here due to near term oversold condition and bring rebound later.
On the upside, whilst initial recovery to 0.7300 cannot be ruled out, reckon upside would be limited to the Kijun-Sen (now at 0.7375) and bring another decline later. Above 0.7390-00 would suggest first leg of decline form 0.7558 has ended instead, risk a stronger rebound to 0.7440-50 but upside would still be limited and price should falter well below said resistance at 0.7558, bring another retreat later.
Recommendation: Sell at 0.7370 for 0.7170 with stop below 0.7470.
On the weekly chart, although kiwi has recovered after finding support at 0.7192, as the sharp retreat from 0.7558 suggests top has possibly been formed there, reckon upside would be limited to the Tenkan-Sen (now at 0.7375) and bring another decline, below said support at 0.7192 would extend the retreat from 0.7558 for retracement of recent rise to the upper Kumo (now at 0.7147) and then 0.7090-00 but reckon downside would be limited to the lower Kumo (now at 0.7026) and psychological support at 0.7000 would hold from here.
On the upside, expect recovery to be limited to 0.7300-10 and the Tenkan-Sen (now at 0.7375) should hold, bring another decline later. Above 0.7417 resistance would risk a stronger rebound to 0.7490-00 but still reckon said resistance at 0.7558 would limit upside and bring another retreat later. Only a break of 0.7559 would extend medium term erratic upmove from 0.6074 (2015 low) has resumed and may extend gain to 0.7690-00 (61.8% projection of 0.6074-0.7485 measuring from 0.6818) and later towards 0.7780-85 (61.8% Fibonacci retracement of 0.8836-0.6074), however, reckon upside would be limited to 0.7890 and price should falter well below resistance at 0.8035.
Investors In Wait-And-See Mode Ahead Of Next Week’s ECB Meeting
Trump has killed the US dollar bulls, earliest respite on 7 September
After tumbling against most majors yesterday amid heightening tensions between North Korea and roughly the rest of the world, the US dollar pared losses on Tuesday as the overall risk sentiment improves. The dollar index printed a multi-year low yesterday as it fell 0.70% to 91.64, the lowest level since January 2015. On Wednesday, the index bounced back 0.25% to 92.45 amid a sell-off in the Japanese yen and the single currency, down 0.35% and 0.18% respectively.
Over the last couple of weeks, the FX market was mostly driven by the twists and turns faced by Donald Trump, as well as speeches from central bankers. This week, the market's attention will shift towards US economic data. Indeed Fed members are expected to remain quiet over this week - only Powell will speaks at a conference this afternoon.
Today traders will be watching ADP employment changes (185k expected, 178k prior) and second quarter GDP (second estimate) which is expected to print at 2.7%q/q (annualized). On Thursday, the show will continue with the release of personal income and spending, which are both expected to have improved in July, expanding 0.3%m/m and 0.4%m/m respectively. Then the Fed's favourite measure of inflation, core personal consumption expenditures, should have eased further in July as economists expect a reading of 1.4%y/y. Finally, July's NFPs (180k exp and 205k prior), together with the complete jobs report, will be published on Friday.
GBP Recovery Unsustainable
GBP recovered slightly, however the correction is more likely short term then a structural shift. GBPUSD is consolidating around the 1.30 handle while EURGBP in a bull channel has no real resistance till 0.9415. The Bank of England remains dovish which corresponding to market pricing. Expectations of Interest rate hikes remain low with hikes only hitting the markets in late 2019. Despite improving inflation outlook, we don't anticipate the BoE will shifted into full tightening mode until there is clear political direction around Brexit. A majority of GBP TWI is comprised of EUR, therefore the large overshot in EURGBP will worry BoE policymakers and decelerate improving inflation outlook.
Brexit talks and splashy headlines will dominate the GBP directions yet division over unity feels in control, as the details of Brexit bill have been slow coming. October UK party conference will help provide clarity on the depth of political discourse. Investors will be watching German elections and UK October conference cautiously signals by key politicians (note, tough talk on Brexit generally scores easy political points). We see UK domestic economics to take a backseat to politics, which will weigh on GBP. In regards to Europe, pro-EU, deeper financial integration comments from Germany's Merkel and France's Macron suggest that a decisive Merkel victory is likely to lead to stronger Euro. EURUSD above the 1.20 and our favorable outlook for European economic and political conditions indicate further upside for the pair.
EURJPY Turns Bullish After Reaching Fresh 2017 High
EURJPY has now reached its highest since February 2016 after hitting as high as 131.70 so far today. The pair has shifted to a more bullish outlook after reversing the decline from 131.17 (early August high) and made a strong recovery from 127.55 (August 18 low). The short-term technicals on the 4-hour chart are bullish.
The Tenkan-sen and Kijun-sen lines are positively aligned and rising, indicating the risk is to the upside in the near-term. The market is above the Ichimoku cloud which is also a bullish setup. Meanwhile, momentum indicators are in their respective bullish territory. It must be noted that the RSI has reached overbought levels at 70 which suggests that a consolidation or a pullback in EURJPY is likely.
Immediate support is expected at 130.98. A break below this would shift the focus to the key psychological level at 130.00. A deeper decline would bring 129.00 into sight which would give scope for further weakness towards the August 18 low at 127.55.
Alternatively, a short-term consolidation phase and a strong rebound from current levels would see a re-test of the 131.70 high. A sustained move higher would indicate the continuation of the short-term uptrend that started at 127.55, as well as the longer-term uptrend from 114.84 (April low).
In the bigger picture (daily chart) the overall trend is neutral to bullish while in the short-term, sustained trading above 131.00 should keep the bullish view in play.
Technical Outlook: USDJPY – Long-Tailed Candle On Tuesday Underpins Recovery Above 110.00, Daily Cloud Twist Attracts
The pair extends recovery on Wednesday and probes above 110.00 barrier, below which last week's action was capped.
Tuesday's action was shaped in bullish daily candle with long tail (following strong downside rejection) which underpins for further advance.
Probe above 110.00 barrier was so far capped by falling 30SMA (110.16) but scope exists for further recovery as daily cloud twists next week and may attract for extended upside.
Close above former congestion tops at 109.83 is needed to signal further gains and expose next key barriers at 111.00 zone (04/16 Aug tops).
Corrective dips should hold above 10SMA (109.40) to keep fresh bulls in play.
Res: 110.16, 110.31, 110.94, 111.65
Sup: 109.53, 109.40, 108.85, 108.26
AUD/USD Candlesticks and Ichimoku Analysis
Weekly
• Last Candlesticks pattern: Long white candlestick
• Time of formation: 10 Jul 2017
• Trend bias: Up
Daily
• Last Candlesticks pattern: Long white candlestick
• Time of formation: 18 Jul 2017
• Trend bias: Up
As aussie has risen again after finding renewed buying interest at 0.7867 and previous resistance at 0.7963 was penetrated, suggesting early fall from 0.8066 top has possibly ended at 0.7808 and upside bias is seen for gain to 0.8000, however, break of said resistance at 0.8066 is needed to confirm recent upmove has resumed and extend the medium term erratic rise from 0.6827 to 0.8163 resistance, then 0.8200 but loss of near term upward momentum should limit upside and reckon another previous resistance at 0.8295 would hold.
On the downside, whilst pullback to the Kijun-Sen (now at 0.7937) cannot be ruled out, reckon 0.7905 support would limit downside and bring another rise later. Below support at 0.7867 would defer and prolong consolidation, risk weakness to 0.7830 but said support at 0.7808 should hold from here. Only below said support at 0.7808 would signal the corrective fall from 0.8066 temporary top is still in progress for retracement of recent upmove to 0.7760 (61.8% Fibonacci retracement of 0.7571-0.8066) but reckon downside would be limited to previous resistance at 0.7712 and 0.7670-75 would hold from here, bring another rebound later.
Recommendation: Buy at 0.7920 for 0.8120 with stop below 0.7820.
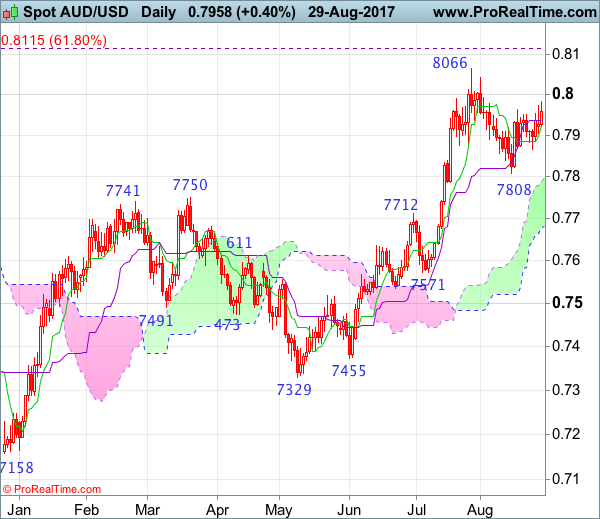
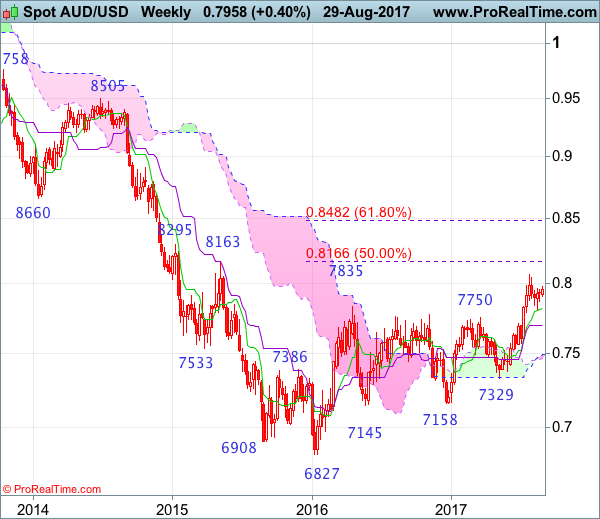
On the weekly chart, as aussie found renewed buying interest just above the Tenkan-Sen and rebounded from 0.7808, suggesting the pullback from 0.8066 has possibly ended there and consolidation with upside bias is seen for gain to 0.8000, then retest of said resistance at 0.8066, however, break there is needed to confirm recent erratic rise from 0.6827 low has resumed and extend gain to previous resistance at 0.8163, then 0.8250 but near term overbought condition should limit upside to another previous resistance at 0.8295 and price should falter below 0.8390-00, bring retreat later.
On the downside, expect pullback to be limited to 0.7905 and bring another rise later. Only below support at 0.7867 would defer and risk another test of said support at 0.7808, a daily close below there would revive near term bearishness for retracement of recent rise to 0.7750, however, a sustained breach below previous resistance at 0.7712 is needed to signal a temporary top has been formed at 0.8066, bring test of the Kijun-Sen (now at 0.7698), then towards 0.7600-10 but support at 0.7571 should contain weakness.
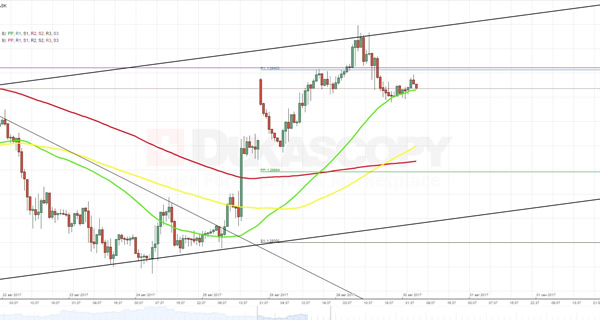
EURUSD Analysis: Slips To 55-Hour SMA At 1.1975
In line with expectations, the currency exchange rate has successfully crossed a combination of the weekly and monthly R1 near 1.2010 and then made a rebound. The only nuance was that a rebound happened a little bit higher, from the weekly R2 at 1.2976 and continued until the 55-hour SMA. Today, two scenarios are likely to happen. In first, the currency pair might try to repeat previous day's advance. In second, it will manage slip to the bottom and gradually continue the fall until the 100-hour SMA. It is quite possible that bears will play in favour of the buck in anticipation of release of data on the US Non-Farm Employment Change and Preliminary GDP later this day, which both are expected to show positive changes in the US economy.
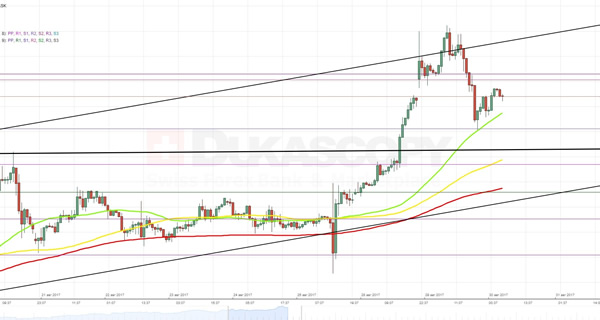
GBPUSD Analysis: Returns To 1.2926
Yesterday the given pair moved quite similarly to the Euro and gold. The first half of the day it spent in a surge but, after reaching certain point, changed a direction and started to decline until the 55-hour SMA. Today, the Pound faces the same dilemma as the bullion. On the one hand, it might try once again to break through a combination of the weekly R1 and the monthly S1. However, an easier path would be to continue the downfall towards the 100-hour SMA. It seems that yesterday the pair made a rebound from an upper trend-line of a new medium-term ascending channel. If this is true, then the further plunge seems even rational. But there is also a need to take into account an effect from another release of the US data today.
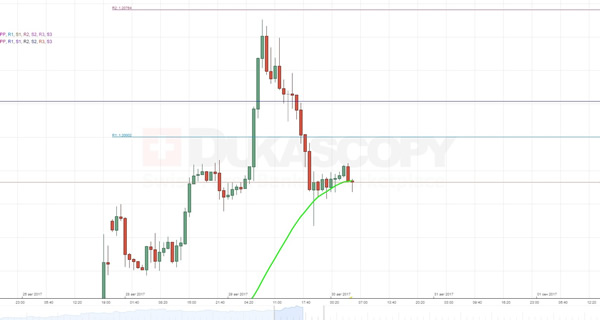
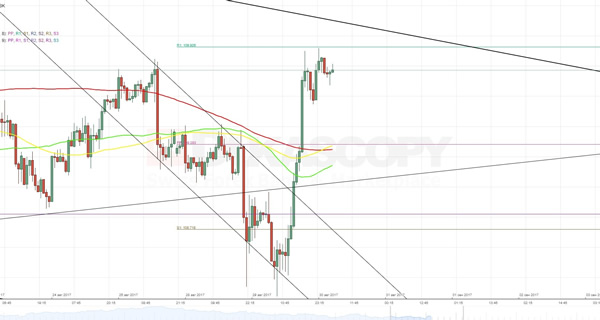
USDJPY Analysis: Jumps To 109.92
Among all major currency pairs, the greatest impact from a release of information on the US CB Consumer Confidence suffered the Yen, which lost 1.13% in value in seven hours. Today the buck is expected to continue the soar at least until it will encounter a combined resistance level set up by the weekly R1 at 109.92 and the senior channel's upper boundary. Given that from the southern side all technical barriers are located below the 109.28 level, a rebound is likely to happen. However, there is also a need to take into account a reaction of traders on release of the two key US macroeconomic data sets today, which are likely to stimulate appreciation of the buck even more. To put differently, if the released data justifies experts expectations, the pair will break out of the channel in the northern direction.
XAUUSD Analysis: Falls On US Fundamentals
Yesterday the buck quite expectedly appreciated against the gold. However, this movement was rather based on reaction from release of data on the US CB Consumer Confidence than some technical factors. Similarly to the Euro, the fall continued until the pair encountered a support set up by the 55-hour SMA and the weekly R2 at 1,305.61. In order to continue the surge, the yellow metal now has to cross a combined resistance level formed by the weekly R3 and the monthly R2. Most probably, this attempt will fail and the pair will end the day in the decline. The main reason behind such assumption is a double release of the US macroeconomic data, among which one of them is Preliminary GDP. Moreover, both data sets are expected to show some positive developments.
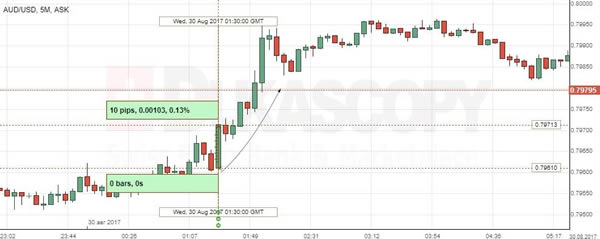
AUD/USD: Building Approvals
Recent reports on Australian building approvals and completed construction projects caused a 10-base point gain in AUD/USD. The Aussie strengthened against its American counterpart by 0.13% to continue growth above the 0.7961 mark.
The Australian Bureau of Statistics revealed that the number of building approvals in the country dropped a seasonally adjusted 1.7% over the course of July, beating expectations for a 5.4% decline in the reported period. Meanwhile, the value of construction projects completed rose 9.3% in the same period. However, the report marked the renewed weakness fuelled by tight lending conditions and the Reserve Bank of Australia's notices about the rising housing debt.