Sample Category Title
US Data And Powell Comments Eyed
- Safe haven unwinding seen as traders eye data releases;
- Would dovish Powell signal an end to rate hikes this year?
- Oil slips ahead of inventory data.
With geopolitical risk once again appearing to subside, attention will turn back to the fundamentals on Wednesday as we enter the business end of the week with regards to economic releases.
The start of the week was shaping up to be much quieter with the bulk of the data coming between Wednesday and Friday but a missile launch by North Korea and the devastating impact of Hurricane Harvey ensured that was not the case. Risk aversion at the start of the week is not starting to be unwound, with Gold have come off its highs, the yen paring gains and equity indices and US futures in the green.
I think we're still some way from investors feeling comfortable with the situation but this is certainly a case of no news being good news. As long as we see no further escalation from either North Korea or the US, focus will likely shift to the economic data, with US GDP, ADP non-farm employment and crude inventories all being released. Growth for the second quarter is expected to be revised a little higher to 2.7% from 2.6% on an annualised basis, while ADP is expected to report 185,000 jobs were created in August.
The ADP is seen as an early estimate of Friday's NFP number but it hasn't historically been very accurate. It has however been useful in highlighting when expectations are perhaps far too high or too low. Should we see a big beat or a big miss, we may see people adjusting their expectations ahead of Friday's jobs report.
We'll also hear from Jerome Powell – a permanent voter on the FOMC – who we haven't heard from recently. Powell is typically lies between the doves and the hawks on the committee and was previously in favour of continuing gradual rate hikes this year and anticipated three in total. Any suggestion that he has since become less in favour of another increase may indicate that the tide has turned towards the doves within the committee, lessening the chances of another hike this year.
Oil is trading slightly lower again as we await the inventory numbers from EIA. The impact of Hurricane Harvey could lead to a near-term rise in crude inventories, which is weighing on WTI crude in particular. We're still expecting a drop this week, with API reporting a drawdown of 5.78 million barrels but it will be interesting to see what happens in the coming weeks. The widening gap between WTI and Brent will also be interesting to watch in the weeks ahead.
AUD/USD Elliott Wave Analysis
AUD/USD – 0.7955
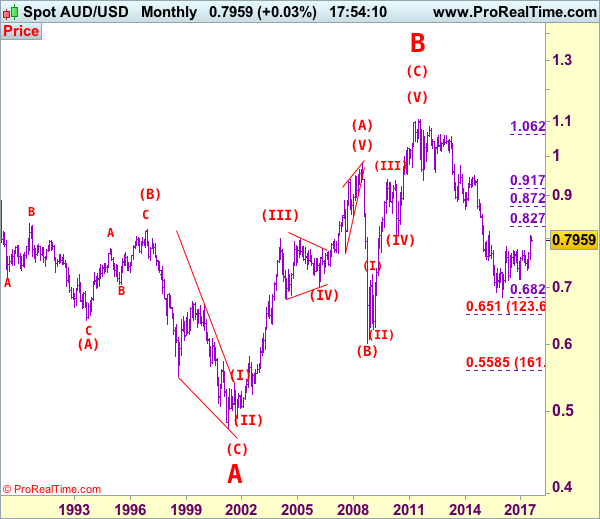
Aussie’s breach of indicated resistance at 0.7963 signals low has been formed at 0.7808 earlier and consolidation with upside bias remains for further gain to 0.8000, however, break there is needed to signal the pullback from 0.8066 has indeed ended, bring retest of this level first. Looking ahead, a break above this level is needed to confirm medium term erratic rise from 0.6827 (2016 low) has resumed and extend gain to 0.8100, then towards previous resistance at 0.8163.
We are keeping our count that top has been formed at 1.1081 (wave 5 of V) and major correction (A-B-C-X-A-B-C) has commenced, indicated downside targets at 0.7945 (61.8% Fibonacci retracement of entire rise from 0.6007-1.1081) and 0.7750 had been met and downside bias is seen for further weakness to 0.6800, then 0.6700 but reckon 0.6500 would hold from here.
Our preferred count is that the rally from 0.6007 to 0.7270 (7 Jan 2009) is marked as wave A, the retreat to 0.6248 (2 Feb 2009) is wave B and the subsequent upmove is labeled as wave C with wave (iii) and wave (iv) ended at 0.8265 and 0.7700 respectively and wave (v) as well as 3 ended at 0.9407, then wave 4 ended at 0.8066 (instead of 0.8578). The wave 5 has met our indicated projection target of 1.1060 and could ended at 1.1081, this level is now treated as the peak of wave (C) as well as larger degree wave B, hence major fall in wave C has commenced, our initial downside target at psychological support at 0.7000 has just been met and further weakness to 0.6500 would be seen later.
On the downside, whilst pullback to 0.7920 cannot be ruled out, reckon 0.7905 would limit downside and bring another rebound later. Only a break below support at 0.7867 (last week’s low) would suggest the rebound from 0.7808 has ended, bring weakness towards this level. A break below there would shift risk back to downside for the corrective decline from 0.8066 top to bring retracement of early upmove to 0.7760 (61.8% Fibonacci retracement of 0.7571-0.8066) and then test of previous resistance at 0.7712 but reckon downside would be limited to 0.7640-50.
Recommendation: Buy at 0.7920 for 0.8120 with stop below 0.7820.

Our alternate count on the daily chart treated the top formed in 2008 at 0.9851 could be a larger degree wave I and was followed by a deep and sharp correction in wave II to 0.6007 and wave III is unfolding from there.
The long-term uptrend started from 0.4775 (2 Apr 2001) with an impulsive structure. Wave I is labeled as 0.4775 to 0.9851 (15 Jul 2008), wave II has ended at 0.6007 (Oct 2008) and wave III is still in progress which may extend further gain to 1.1265.
Euro Edges Lower Ahead Of German Preliminary CPI
EUR/USD has posted slight losses in the Wednesday session. Currently the pair is trading at 1.1945, down 0.22% on the day. On the release front, German Preliminary CPI will be published later in the day, with the indicator expected to weaken and post a small gain of 0.1%. In the US, there are two key events – ADP Nonfarm Payrolls is expected to rise to 185 thousand, and Preliminary GDP is expected to gain 2.7%. On Thursday, Germany releases Retail Sales and the euro zone releases CPI Flash Estimate. In the US, there are a host of key events, led by unemployment claims.
It's up, up and away for the streaking euro, which as soared 12.0% since April 1. On Tuesday, the currency pushed above the 1.20 level for the first time since January 2017. The euro has benefited from stronger growth in the eurozone in 2017, led by robust growth in Germany. As well, investors are anticipating that the ECB will provide some guidance on plans regarding its asset purchase program (QE), which is scheduled to terminate in December. The ECB is widely expected to taper its QE program early next year, but so far has been mum about its plans. Analysts expect the ECB to address its stimulus package at the next policy meeting on September 7.
Anyone hoping for some fireworks at last week's meeting of central bankers in Jackson Hole came away disappointed. On Friday, ECB President Mario Draghi took a page out of Janet Yellen's page book, opting to steer away from any discussion about ECB monetary policy. Instead, Draghi spoke about the importance of free trade and financial reforms. Draghi seems to have learned a lesson from a meeting of central bankers in Portugal in June, when the markets seized on his comments that the euro zone was undergoing a broad recovery, and the euro soared. However, Draghi won't receive another free pass next month, when the ECB holds its next policy meeting, and is expected to address its ultra-accommodative monetary policy.
The US economy continues to perform well, and the economy receives a report card on Thursday, with the release of Preliminary GDP for the second quarter. US growth in Q1 was weak, with Final GDP coming in at 1.4%. However, Q2 is looking much better, with Preliminary GDP expected to gain 2.7%. The US consumer remains very optimistic about the economy, buoyed by a red-hot labor market. In August, CB Consumer Confidence accelerated to 122.9 in August, above the estimate of 120.9 points. Still, the optimism has not translated into strong consumer spending, and the lack of spending has contributed to weak inflation levels.
Technical Outlook: WTI OIL – Bears Pressure Daily Cloud Base, EIA Crude Stocks Report In Focus Today
WTI oil price remains under strong pressure on Wednesday and attacks $46.04, base of narrowing daily cloud which contained Tuesday's dip at $45.75.
The oil price fell sharply in past two days, showing no impact from hurricane Harvey which caused shutdowns of refineries and disruptions in supply, as strong concerns on global oversupply continue to weigh heavily on oil prices.
Tuesday's close below $46.44 (former low of 17 Aug) was bearish signal, with price looking for close below daily cloud to confirm and trigger bearish extension towards next targets at $45.39/24 (24 July trough / Fibo 61.8% of $42.04/$50.41 rally).
EIA weekly crude inventories report will be released today with forecast for draw of 1.9 million barrels in the week ending August 25, compared to draw of 3.3 million barrels last week.
Release of API Crude stocks report on Tuesday showed draw of 5.7 million barrels, well above forecasted 1.5 million barrels draw which indicates that US oil market is starting to tighten.
Stronger than expected draw in oil inventories today may reduce the pace of recent bearish acceleration and generate initial recovery signal.
Narrowing daily cloud which is twisting early next week may attract for fresh recovery and support scenario. However, firm break above cloud is required neutralize bearish threats and shift near-term focus higher.
Res: 46.38, 46.70, 47.01, 47.38
Sup: 46.44, 45.80, 45.39, 45.24
CRUDE OIL Testing Support At 45.40
Crude oil is trading lower. Hourly support is given at 45.40 (17/08/2017 high). Strong resistance can be found at 50.41 (31/07/2017). Expected to show continued short-term bearish move.
In the long-term, crude oil has recovered after its sharp decline last year. However, we consider that further weakness are very likely. Strong support lies at 35.24 (05/04/2016) while resistance can now be found at 55.24 (03/01/2017 high).
SILVER Ready To Monitor Resistance At 17.75
Silver's bullish pressures are strong. Hourly resistance is given at 17.32 (18/08/2017 high) while support can be found at 16.58 (15/08/2017 high). The commodity lies in a short-term uptrend channel. Expected to show another leg higher.
In the long-term, the death cross indicates that further downsides are very likely. Resistance is located at 25.11 (28/08/2013 high). Strong support can be found at 11.75 (20/04/2009).
GOLD Short-Term Bearish Consolidation
Gold is surging. Hourly support is given at a distance 1251 (08/08/2017 low). Stronger support lies at 1204 (10/07/2017 high). Expected to show continued increase.
In the long-term, the technical structure suggests that there is a growing upside momentum. A break of 1392 (17/03/2014) is necessary ton confirm it, A major support can be found at 1045 (05/02/2010 low)
BITCOIN Where Will It Stop?
Bitcoin has set a new all-time high. Hourly support lies very far at 3599 (22/08/2017 low). The road is wide open for another bullish move.
In the long-term, the digital currency has had an exponential growth. There are decent likelihood that the asset will consolidate above $1500. Long-term support is given at $1464 (04/05/2017 low)
Trade Idea: GBP/USD – Stand aside
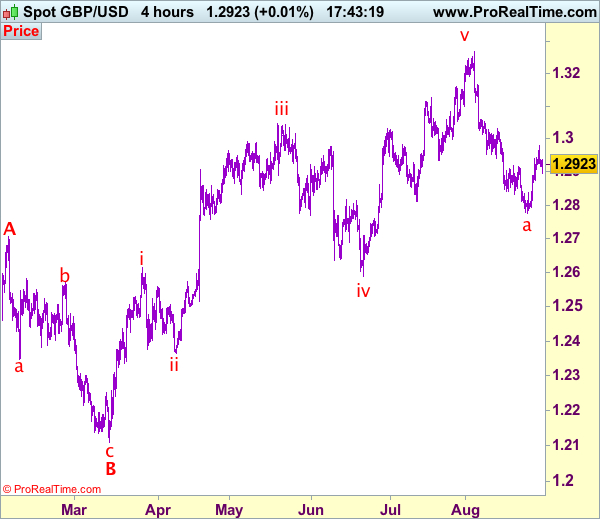
GBP/USD – 1.2927
New strategy :
Stand aside
Position: -
Target: -
Stop:-
As cable has retreated after surging to 1.2979 yesterday, suggesting consolidation below this level would be seen and pullback to 1.2895-00, then towards support at 1.2873 cannot be ruled out, however, if our view that low has been formed at 1.2774 is correct, downside should be limited to 1.2835-40 and bring another rebound later. Above said resistance at 1.2979 would revive bullishness and extend the corrective rise from 1.2774 low for retracement of recent decline from 1.3269 to 1.3000 and possibly towards resistance at 1.3032.
In view of this, would be prudent to stand aside for mow. Below 1.2835-40 suggest the rebound from 1.2774 has ended instead, risk weakness to 1.2800, then retest of said support at 1.2774 which is likely to hold on first testing.
Our preferred count on the daily chart is that cable's rebound from 1.3500 (wave (A) trough) is unfolding as a wave (B) with A ended at 1.7043, followed by triangle wave B and wave C as well as wave (B) has ended at 1.7192, the subsequent selloff is the larger degree wave (C) which is still unfolding with minor wave (III) of larger degree wave 3 ended at 1.1986, hence wave (IV) correction is in progress which could either be a triangle wave (IV) of a complex formation but upside should be limited to 1.3500 and price should falter well below 1.4000, bring another decline in wave (V) of 3 for weakness to 1.1500, then 1.1200.
EUR/CHF Consolidation Around 1.14
EUR/CHF recovery bounce has stalled below downtrend resistance located at 1.1407. Hourly support is located at 1.1260 (04/08/2017 low). Expected to show further consolidation.
In the longer term, the technical structure has reversed. Strong resistance at 1.1200 (04/02/2015 high) has been broken. Yet,the ECB's QE programme is likely to cause persistent selling pressures on the euro, which should weigh on EUR/CHF. Supports can be found at 1.0184 (28/01/2015 low) and 1.0082 (27/01/2015 low).