Sample Category Title
Trade Idea Wrap-up: GBP/USD – Buy at 1.2850
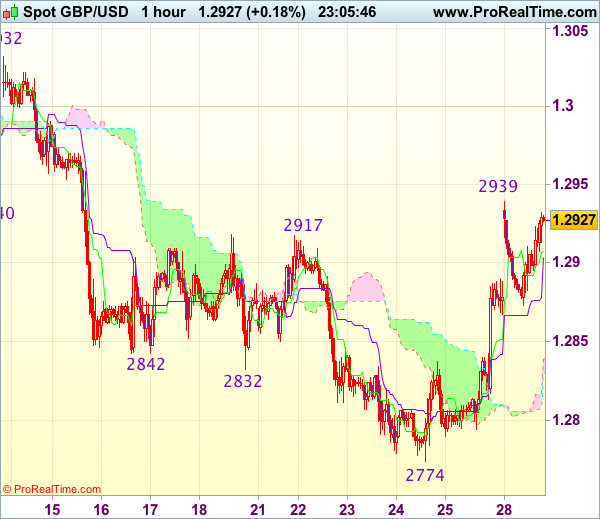
GBP/USD - 1.2920
Most recent candlesticks pattern : N/A
Trend : Near term down
Tenkan-Sen level : 1.2907
Kijun-Sen level : 1.2903
Ichimoku cloud top : 1.2839
Ichimoku cloud bottom : 1.2830
Original strategy :
Buy at 1.2850, Target: 1.2950, Stop: 1.2815
Position : -
Target : -
Stop : -
New strategy :
Buy at 1.2850, Target: 1.2950, Stop: 1.2815
Position : -
Target : -
Stop : -
As cable has maintained a firm undertone after intra-day initial brief rise to 1.2939, adding credence to our view that a temporary low has possibly been formed at 1.2774 last week and bullishness remains for the rise from there to bring retracement of recent decline, above said resistance at 1.2939 would extend gain to 1.2970-80, then towards 1.3000 but price should falter below previous resistance at 1.3032.
In view of this, we are looking to buy sterling on pullback as 1.2850 should limit downside. Below previous resistance at 1.2837 would defer and risk test of 1.2810-15 but only break there would abort and signal the rebound from 1.2774 (last week’s low) has ended instead, risk weakness to 1.2775-80 first.
Trade Idea Wrap-up: EUR/USD – Buy at 1.0870
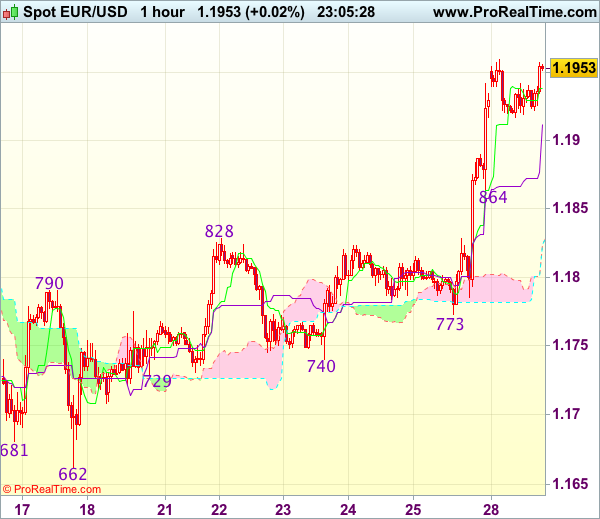
EUR/USD - 1.1963
Most recent candlesticks pattern : N/A
Trend : Up
Tenkan-Sen level : 1.1943
Kijun-Sen level : 1.1915
Ichimoku cloud top : 1.1824
Ichimoku cloud bottom : 1.1824
Original strategy :
Buy at 1.1870, Target: 1.1970, Stop: 1.1835
Position : -
Target : -
Stop : -
New strategy :
Buy at 1.1870, Target: 1.1970, Stop: 1.1835
Position : -
Target : -
Stop : -
The single currency finally rallied on Friday and upmove gathered momentum after breaking indicated resistance at 1.1828 (now support) and euro eventually surged above recent high at 1.1910, adding credence to our bullish view for a resumption of recent upmove, hence upside bias remains for further gain to 1.1980, however, near term overbought condition should limit upside to 1.1200-10 and reckon 1.1250-60 would hold from here.
In view of this, would not chase this rise here and would be prudent to reinstate long on pullback as support at 1.0864 should limit downside and bring another upmove. Only below previous resistance at 1.1828 (now support) would abort and suggest a temporary top is possibly formed, risk test of 1.1800 but break of support at 1.1773 (Friday’s low) is needed to confirm.
Trade Idea Wrap-up: USD/JPY – Hold long entered at 109.25
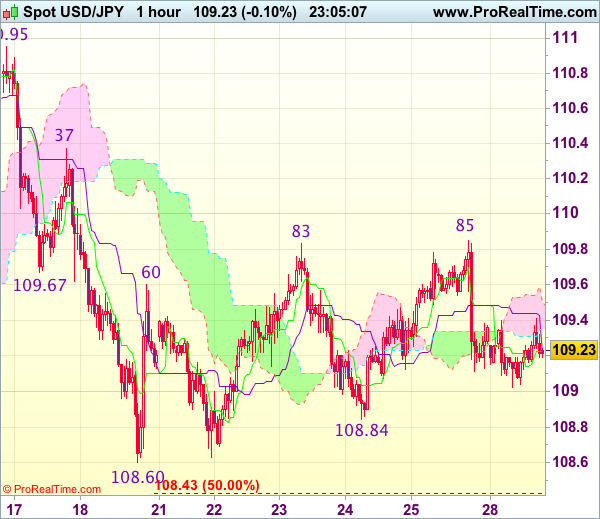
USD/JPY - 109.20
Most recent candlesticks pattern : N/A
Trend : Near term down
Tenkan-Sen level : 109.23
Kijun-Sen level : 109.22
Ichimoku cloud top : 109.50
Ichimoku cloud bottom : 109.35
Original strategy :
Bought at 109.25, Target: 110.25, Stop: 109.00
Position : - Long at 109.25
Target : - 110.25
Stop : - 109.00
New strategy :
Hold long entered at 109.25, Target: 110.25, Stop: 109.00
Position : - Long at 109.25
Target : - 110.25
Stop : - 109.00
Although the greenback retreated quite sharply after Friday’s marginal rise to 109.85, outlook remains consolidative, reckon downside would be limited to 109.00 and bring rebound later, above 109.50-55 would bring test of said resistance at 109.85, break there would extend the erratic rise from 108.60 low to 110.00, then towards resistance at 110.37 which is likely to hold from here.
In view of this, we are holding on to our long position entered at 109.25. Only below said support at 108.84 would abort and bring retest of said support at 108.60, break there would revive bearishness and confirm recent decline has resumed for further weakness to 108.30 (1.618 times projection of 110.95-109.67 measuring from 110.37), then towards 108.00.
Trade Idea: EUR/GBP – Buy at 0.9155
EUR/GBP - 0.9245
Original strategy :
Buy at 0.9115, Target: 0.9215, Stop: 0.9075
Position : -
Target : -
Stop : -
New strategy :
Buy at 0.9155, Target: 0.9295, Stop: 0.9115
Position : -
Target : -
Stop : -
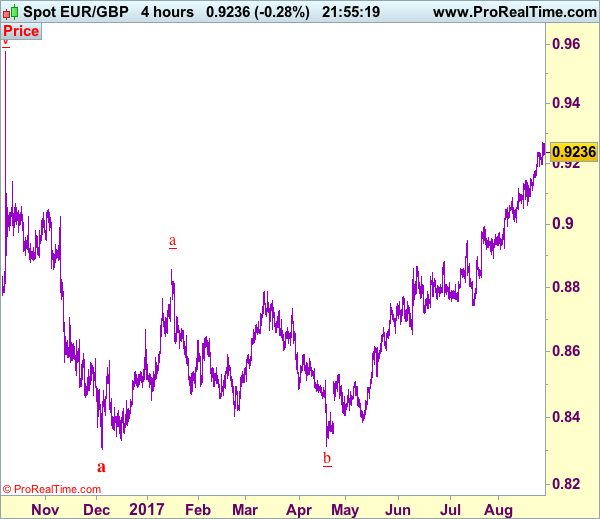
As the single currency has maintained a firm undertone after recent rally, adding credence to our bullish view that the major rise from 0.8304 is still in progress and may extend further gain to 0.9275-80, then 0.9300-10 but weakening of near term upward momentum should prevent sharp move beyond 0.9330-35 and price should falter below 0.9350-55, risk from there has increased for a retreat to take place later.
In view of this, would not chase this rise here and would be prudent to buy euro on subsequent pullback as 0.9150-55 would limit downside. Below 0.9110-15 would defer and suggest a temporary top is possibly formed, risk test of support at 0.9063, however, break there is needed to add credence to this view, bring retracement of recent upmove towards 0.9005-10.
Our preferred count is that, after forming a major top at 0.9805 (wave V), (A)-(B)-(C) correction is unfolding with (A) leg ended at 0.8400 (A: 0.8637, B: 0.9491 and 5-waver C ended at 0.8400. Wave (B) has ended at 0.9413 and impulsive wave (C) has either ended at 0.8067 or may extend one more fall to 0.8000 before prospect of another rally. Current breach of indicated resistance at 0.9043 confirms our view that the (C) leg has ended and bring stronger rebound towards 0.9150/54, then towards 0.9240/50.
Dollar Stabilizes after Jackson Hole Sell-off
- European equities tread water in a low-volume trading session with UK markets closed for Summer Banking Holiday. US stocks markets opened marginally higher, awaiting key eco data later this week.
- Growth in EMU M3 money supply, an indicator which often predicts future economic activity, slowed sharply in July from 5% Y/Y to 4.5% Y/Y (vs 4.9% Y/Y expected), even as bank lending increased. Growth in corporate lending jumped to 2.4% Y/Y from 2.0% Y/Y, reversing most of its slowdown in June, when one-off factors dragged down growth. Lending growth to households held steady at 2.6% Y/Y for the third straight month, matching its best rate since March 2009.
- Economic confidence in Italy is at its highest level in almost 10 years, as recovery in the eurozone drives renewed optimism. The sub-index for manufacturing has been particularly strong in recent months as companies benefit from rising demand across the continent. Consumer sentiment, in contrast, had fallen back over the last year.
- The US merchandise trade deficit widened a bit in July (from -$64B to -$65.1B), while inventories at wholesalers increased (+0.4% M/M), according to preliminary figures from the Commerce Department in Washington.
- US gasoline futures jumped to two-year highs as Tropical Storm Harvey pummelled the heart of the US energy sector. The impact on oil prices is negligible so far.
- Confidence in Qatar's creditworthiness took another hit, as Fitch downgraded the country's debt rating from AA to AA-, citing concerns that the economic blockade imposed by Arab neighbours was unlikely to be lifted soon.
Rates
Slow start of the trading week
Bond trading was extremely thin and largely range-bound given today's UK banking holiday and uneventful eco calendar. Draghj's comments at the Jackson Hole symposium on Friday eve (after closure) (substantial accommodation is still needed and core inflation/wages show no signs of an uptrend yet) may help explain the modest curve steepening. The heavy rain fall, epic flooding and closure of some main ports in the Houston area had no immediate effect on the crude oil price (contrary to the gasoline price) and thus also not on bonds. Early losses of European equities and the subsequent recovery didn't cause the "usual" inverse movement with bonds. Italian manufacturing and consumer confidence printed stronger than expected, while the US trade deficit was a bit bigger than forecast, but the deviation was too small to trigger a meaningful reaction. All in all, an uneventful session. Later today, the US Treasury will sell 2- and 5-yr T-notes.
At the time of writing, the German yield curve steepens with yields slightly lower at the short end of the curve (<1 bp) and up 0.4 to 1.4 bps in the 10- to-30-yr sector. The US yield curve shows a similar pattern with yields marginally lower till the 5-yr tenor and up 0.7 bps and 1.5 bps in the 10-to-30-year sector. Intra-EMU yield spreads are virtually unchanged.
Currencies
Dollar stabilizes after Jackson Hole sell-off
EUR/USD and USD/JPY held extremely tight ranges after Friday's 'Jackson Hole rally of the euro/decline of the dollar'. Investors wait for additional input from EMU and US data later this week to assess whether those Jackson Hole moves were justified. EUR/USD trades in the 1.1930 area. USD/JPY hovers near 109.30/35.
Overnight, Asian equities traded mixed to slightly higher. Japanese indices were little changed as USD/JPY returned to the low 109 area. The PBOC set the fixing of USD/CNY at the strongest level for the yuan since August last year. The dollar remained in the defensive across the board. The trade-weighted dollar dropped to the 92.50 area. EUR/USD remained well bid and traded in the 1.1920 area.
There were only second tier eco data in Europe. The EMU money supply and lending data (July) were on the soft side. As usual, the report was largely ignored. European equities opened with losses of 0.50%. The post-Jackson hole rise of the euro was part of the explanation. US equity futures also traded with a slightly negative bias. EUR/USD held a tight sideways range in the 1.1925/45 area. Changes in US/EMU interest rates/differentials were limited. At least for now, the rise of the euro doesn't cause an outright outperformance of German bunds over US Treasuries. USD/JPY quite easily stayed north of USD/JPY 109 even as equities traded with a negative bias.
Sentiment on risk improved as US dealers joined the fray, even as there is uncertainty on the impact of the hurricane Harvey. For now, the market impact remains limited. WTI maintains a tight range in the $ 47 area. The dollar stabilizes after the post-Jackson hole setback. The US July trade deficit was slightly wider than wider an expected. However, there was hardly any market impact. Investors are looking forward to series of key eco data later this week to decide whether the Jackson Hole decline of the dollar is justified or not.
EUR/GBP: holiday-thinned trading
Today, sterling trading volumes were low as UK markets were closed for the Summer Bank holiday. Cable and EUR/GBP basically maintained the moves after the Jackson hole speeches of Yellen and Draghi on Friday. EUR/GBP held in the mid-0.92 area. Financial news wires elaborated extensive on the start of the 3th round of Brexit negotiations. However, until now, there was hardly any 'new news' on the issue. The EMU still wants significant progress on the terms of the separation. The UK wants to take a start with the negotiations on the future EU-UK relationship. EUR/GBP trades currently around 0.9245. Cable holds just north of 1.29.
Trade Idea: USD/CAD – Hold short entered at 1.2690
USD/CAD - 1.2467
Original strategy :
Sold at 1.2690, met target at 1.2490
Position: - Short at 1.2690
Target: - 1.2490
Stop: -
New strategy :
Sell at 1.2550, Target: 1.2350, Stop: 1.2610
Position: -
Target: -
Stop:-
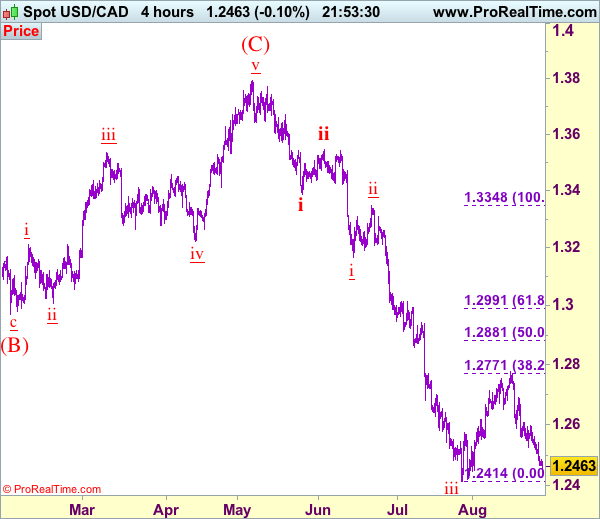
The greenback extended the selloff from 1.2778 in line with our bearish expectation, our short position entered at 1.2690 finally reached our downside target at 1.2490 (with 200 points profit), this anticipated selloff adds credence to our view that the wave iv correction from 1.2414 (wave iii trough) has ended at 1.2778, hence wave v is underway for retest of 1.2414 but break there is needed to provide confirmation and extend weakness to 1.2350, then towards 1.2300. We are keeping our count that wave v as well as wave (C) ended at 1.3794 and impulsive wave (i ii, i ii) is now unfolding with minor wave iii ended at 1.2414, followed by wave iv correction possibly ended at 1.2778, wave v should extend towards 1.2300.
In view of this, we are looking to sell again on recovery as 1.2550-60 should limit upside. Only above indicated resistance at 1.2607 would defer and prolong consolidation, risk rebound to 1.2660 but resistance at 1.2691 should hold from here, bring further consolidation. Above 1.2691 resistance would risk a stronger rebound to 1.2740-50, however, said resistance at 1.2778 should hold. In the event the pair breaks said resistance at 1.2778, this would abort and signal the rebound from 1.2414 is still in progress for retracement of recent decline to 1.2825-30 but still reckon upside would be limited to 1.2880-85 (50% Fibonacci retracement of wave iii) and price should falter well below 1.2990-95 (61.8% Fibonacci retracement), bring retreat later.
To recap, wave B from 1.3066 is unfolding as an a-b-c and is sub-divided as a: 1.2192, b: 1.2716 and wave c is a 5-waver with i: 1.1983, ii: 1.2506, extended wave iii with minor iii at 1.0206, wave iv ended at 1.0781 and wave v as well as wave iii has ended at 0.9931, hence the subsequent choppy trading is the wave iv which is unfolding as (a)-(b)-(c) with (a) leg of iv ended at 1.0854, followed by (b) leg at 1.0108 and (c) leg as well as the wave iv ended at 1.0674. The wave v is sub-divided by minor wave (i): 0.9980, (ii): 1.0374, (iii): 0.9446, (iv): 0.9913 and (v) as well as v has possibly ended at 0.9407, therefore, consolidation with upside bias is seen for major correction, indicated target at 1.3700 and 1.4000 had been met and further gain to 1.4700 would be seen later.
Harvey to Cloud Outlook
Hurricane Harvey went from a tropical storm to what will likely be one of the most damaging storms in history. The rains are expected to last through Wednesday and the scenes in Texas already point to a massive calamity that will cloud forecasts for many quarters. The euro was the top performer last week while the New Zealand dollar lagged. CFTC positioning showed specs making bigger bets on the euro against the pound.
Harvey was a Category 2 storm when markets closed Friday but grew to a rare Category 4 storm when it first made landfall a few hours later. After pounding southwest Texas the system then went back out to sea and is now working its way up the coast to Houston where scenes of incredible flooding are already underway.
It's far too premature to assess the scope of the damage but much of the oil refining in the area is offline and may stay that way all week. The result will be a squeeze on gasoline prices. Oil is a more-tricky trade because imports are cut off. The kneejerk reaction when markets open may be to bid up prices.
Economically we suspect the storm will surpass the damage from Sandy and may even rival Katrina. Those storms skewed growth lower immediately but led to stronger GDP during the rebuilding. The impossible task is knowing just how much is related to the storm and how much was unrelated. That uncertainty will be another reason for the Fed to hold off hiking in December and maybe beyond.
Other weekend news included some tidbits from Jackson Hole. Kuroda warned GDP won't continue at 4%, which isn't a surprise to anyone.
CFTC Commitments of Traders
Speculative net futures trader positions as of the close on Tuesday. Net short denoted by - long by +.
- EUR +88K vs +79K prior
- GBP -46K vs -32K prior
- JPY -74K vs -77K prior
- CHF -2K vs -1K prior
- CAD +51K vs +51K prior
- AUD +60K vs +60K prior
- NZD +22K vs +25K prior
The euro longs remain near the most extreme levels since 2011 while specs are increasingly convinced that Brexit is going to hit harder than thought a few months ago.
Second Round of NAFTA Renegotiation to Begin…
US President Donald Trump's renewed threat to withdraw from the North America Free Trade Agreement (NAFTA) reminds us that renegotiation of this 23-year-old deal has begun. While the US has accused Canada of both lumber and dairy trades, its focus is more on Mexico with Trump keeping demanding its third trading partner to pay the bill for construction of the wall along the border. In our opinion, the core of NAFTA renegotiation is to narrow US' trade deficit. With US' trade deficit with Canada on the fall, it would put harder pressure on Mexico in the negotiations. The market reaction towards NAFTA renegotiation has been muted, overshadowed by other events including North Korean peninsula tensions, US debt ceiling, and central banks' monetary policy outlook. Indeed, we do not expect to see material developments for the rest of the year. However, the parties, especially the US and Mexico, would be eager to complete a deal by mid-2018, ahead of and Mexican election in July and US mid-term election in November.
What is NAFTA?
NAFTA is a trade agreement between Canada, Mexico and the US that became effective in 1994 under President Bill Clinton. Like other FTAs, NAFTA eliminated almost all tariffs among the three states. Barriers on the cross-border flow of services are removed. However, it upholds the protection of intellectual property rights and allows each country to apply its own environmental standards. NAFTA is currently the world's largest free trade agreement with the three states contributing over US$20 trillion in terms of GDP.
Aim of Renegotiation
During his election campaign, Donald Trump had repeatedly criticizing NAFTA, claiming that it is a "disastrous trade deal" and the cause of the US job loss. Since he has been in office as the US President, Trump has sometimes threatened to terminate the deal although and sometimes indicated the willingness to renegotiate a new agreement. Despite his inconsistence, USTR on May 18 gave formal notice to the Congress that the President intended to commence negotiations with Canada and Mexico with respect to the agreement. After the 90-day consultation period, the first round of talks eventually took place in the US and concluded in August 20, failing to narrow down the divergence amongst the three countries, though. The second round of NAFTA talks would be held form September 1-5 in Mexico, followed by another round scheduled later in September in Canada, before returning to the US.
Reduction on US Trade Deficit
At the "Summary of Objectives for the NAFTA Renegotiation" released in July, the Office of the United States Trade Representative (USTR) lain down the rationale for the renegotiation of this 23-year-old free trade relations among the US, Canada and Mexico. The essence of this 17-page summary is to "improve the US trade balance and reduce the trade deficit with the NAFTA countries". Other critical issues, including the rules of origin, elimination of the Chapter 19 dispute settlement mechanism and the increase in duty-free threshold (DMT) on e-commerce, are aimed at achieving a better trade position for the US
US-Canada
Together with China, Canada and Mexico are the top three trading partners with the US. The US has incurred most deficit with China but this would be dealt separately. In 2016, the US incurred a trade deficit of US$11B in goods with Canada but at the same time enjoyed a trade surplus in services of US$ 24.6B. Therefore, the focus of the US is in goods, not services. Indeed, the US goods deficit with Canada mainly lies on oil and gas trade. In a report released in March, the EIA indicated that energy accounted for about 5% of the value of all US exports to Canada and more than 19% of the value of all US imports from Canada in 2016. The value of US energy imports from Canada was US$ 53B, while the value of US energy exports to Canada was US$14B, last year. As a result, the US incurred a deficit of US$39B in energy trade alone with Canada last year. We expect the "problem" would ease in coming years as the US has become more and more self-reliant on oil production. Meanwhile, we notice that US' deficit with Canada has decreased for a second consecutive year, falling to the current level from US$ 36.5B in 2014
US-Mexico
Assuming US' self-reliance on oil production would lead to the decline in demand for Canadian oil, US' goods trade deficit with Canada would continue to narrow in the future. It is therefore prudent to believe that the US to put more pressure on Mexico in the NAFTA negotiation. Widening for three years in a row, US' trade deficit with Mexico increased +4.3% to US$ 63B in 2016, with vehicles, machinery, agricultural products the major imports to the US.
Lack of progress has been made in the first round of talks. Trump even renewed threat to leave NAFTA over the weekend, days before the beginning of the second round. Trump twitted that Canada and Mexico were "very difficult" over the renegotiation. He repeated that it was the "worst trade deal ever made", adding "may have to terminate?". Mexico responded by indicating it would not negotiate the trade deal via social media! The third largest trading partner of the US has recently trying to strengthen the relations with China, as it looks for an alternative in trade.
We do not expect any breakthrough in the second round of talks that begins on September 1. All parties would unlikely compromise in early stages of the negotiation. Our base case is that a deal would be reached eventually as we believe the US withdrawal from NAFTA is a "lose-lose" scenario that no party wants. While there might lack progress for the rest of the year, the parties would hope to reach a deal in the first half of 2018, before the Mexican election in July and the US mid-term election in November. The case would be complicated if a deal cannot be completed before the Mexican election. Opinion polls show that the leftist Morena party still gets the most support. Its leader, the populist Andrés Manuel López Obrador (a.k.a. AMLO), is opposing more aspects of the NAFTA and is against Trump. Although market reaction to recent rounds of negotiations would remain rather muted, we believe financial market volatility would increase as we approach July 2018.
GBP/USD In The Buyers Territory
The currency pair has opened with a gap up in the early morning and reached fresh new highs. Has decreased a little, but only to close the gap. It maintains a bullish perspective on the short term because has managed to stay in the green zone. Should increase further as the USDX is expected to drop further if will stabilize under the 92.49 static support.
USDX is now pressuring the 92.49 static support, has dropped as much as 92.33 level, but has squeezed a little in the last few hours.
GBP/USD jumped higher in the morning and touched new highs, technically is expected to climb much higher in the upcoming period after the false breakdown below the upper median line (UML). The next upside target will be at the 1.3046 static resistance.
Should be attracted by the first warning line (wl1) of the ascending pitchfork after the false breakdown below the 250% Fibonacci line (ascending dotted line). Is trading within an ascending channel, so the perspective remains bullish, despite the minor retreat.Only a valid breakdown below the 1.2798 static support will confirm a further drop.
Gold Strongly Bullish
Gold edged higher after the USDX's sell-off and looks determined to make a valid breakout above the 23.6% retracement level and to stabilize outside the extended sideways movement. The next major upside target will be at the warning line (WL1) of the major descending pitchfork, could find temporary resistance at this level as well.
I've said in the previous reports that should climb much higher if the 38.2% retracement level will hold, has consolidated above this static support and has recaptured more directional energy, which will help it to hit new highs.