Sample Category Title
Daily Technical Outlook And Review: EUR/USD, GBP/USD, AUD/USD, USD/JPY, USD/CAD, USD/CHF, DOW 30, GOLD
A note on lower timeframe confirming price action...
Waiting for lower timeframe confirmation is our main tool to confirm strength within higher timeframe zones, and has really been the key to our trading success. It takes a little time to understand the subtle nuances, however, as each trade is never the same, but once you master the rhythm so to speak, you will be saved from countless unnecessary losing trades. The following is a list of what we look for:
- A break/retest of supply or demand dependent on which way you're trading.
- A trendline break/retest.
- Buying/selling tails ... essentially we look for a cluster of very obvious spikes off of lower timeframe support and resistance levels within the higher timeframe zone.
- Candlestick patterns. We tend to only stick with pin bars and engulfing bars as these have proven to be the most effective.
We typically search for lower-timeframe confirmation between the M15 and H1 timeframes, since most of our higher-timeframe areas begin with the H4. Stops are usually placed 1-3 pips beyond confirming structures.
EUR/USD
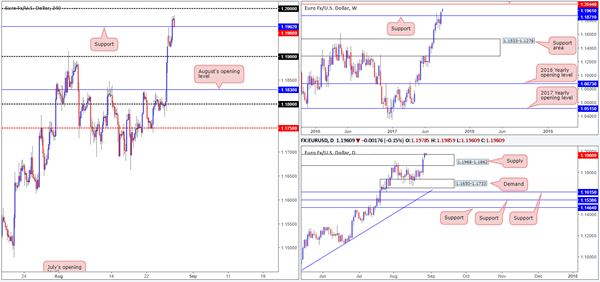
During the course of yesterday’s sessions the single currency closed beyond the H4 resistance level at 1.1962. With price now seen only inches from retesting this barrier as support, traders’ crosshairs are likely fixed on the large psychological number seen overhead at 1.20.
Over on the bigger picture, Monday’s advance lifted daily action above the supply zone coming in at 1.1968-1.1862. Given the (current) underlying trend in this market, this break would be viewed by most as a continuation move north. However, before we all buy this breakout, it might be worth noting that there is a weekly resistance line pegged just above it at 1.2044.
Suggestions: Look for shorting opportunities between 1.2044/1.20. Granted, this would entail trading countertrend, but seeing as we have a large round number and a weekly resistance in hand (see above), this will likely be sufficient enough to bounce prices lower.
To be on the safe side though, waiting for a H4 bearish candle to form within the area (preferably a full, or near-full-bodied candle) is advised. This will not guarantee a winning trade, but what it will do is show seller intent within a high-probability sell zone.
Data points to consider: US Consumer confidence at 3pm GMT+1.
Levels to watch/live orders:
- Buys: Flat (stop loss: N/A).
- Sells: 1.2044/1.20 ([waiting for a reasonably sized H4 bearish candle to form – preferably a full, or near-full-bodied candle – is advised] stop loss: ideally beyond the candle’s wick).
GBP/USD
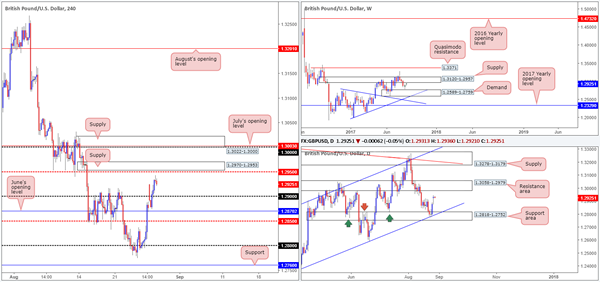
From the daily timeframe, we can see that the British pound recently extended Friday’s recovery from the support zone at 1.2818-1.2752 and channel support line etched from the low 1.2365. The next upside target on this scale can be seen at 1.3058-1.2979 (a resistance area). Along similar lines, weekly flow is seen trading just ahead of a supply zone drawn from 1.3120-1.2957. Moving across to the H4 candles, near-term resistance stands at 1.2950.
With the above in mind, we have absolutely no interest in buying this market right now. However, we do have two areas on the sell-side that you may find interesting:
H4 supply positioned directly above 1.2950 at 1.2970-1.2953. This area encapsulates the lower edge of the weekly supply mentioned above at 1.2957.
A H4 supply located at 1.3022-1.3000. Not only does this area boast the large 1.30 handle and July’s opening level at 1.3003, it’s also sited within both of the above noted higher-timeframe resistances.
Suggestions: Should H4 price chalk up a bearish candle (preferably a full, or near-full-bodied candle) at either of the aforesaid H4 supply zones, a sell trade could be an option today.
Data points to consider: US Consumer confidence at 3pm GMT+1.
Levels to watch/live orders:
- Buys: Flat (stop loss: N/A).
- Sells: 1.3022-1.3000 ([waiting for a reasonably sized H4 bearish candle to form – preferably a full, or near-full-bodied candle – is advised] stop loss: ideally beyond the candle’s wick). 1.2970-1.2953 ([waiting for a reasonably sized H4 bearish candle to form – preferably a full, or near-full-bodied candle – is advised] stop loss: ideally beyond the candle’s wick).
AUD/USD
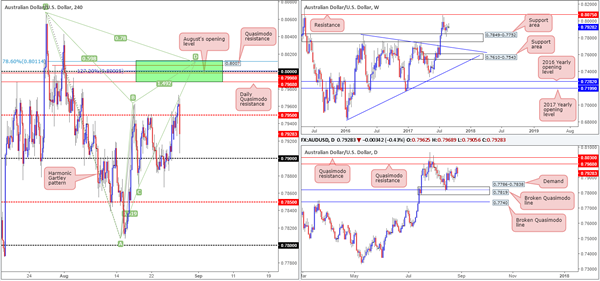
In recent hours, we’ve seen the commodity currency aggressively trade back below the H4 mid-level support at 0.7950. As far as we can see, this move was triggered by the latest North Korean and Japanese news. Tensions between the two countries have increased due to North Korea’s missile launch that fell into waters off Japan’s Hokkaido.
For those who read Monday’s report you will likely recall that our desk were eyeing the 0.80 boundary for shorting opportunities. Disappointingly, this recent turn of events has unfortunately thrown a spanner in the works!
Our reasoning behind liking 0.80 so much, apart from 0.80 being a watched round number, are the several nearby structures:
The daily Quasimodo resistance level at 0.7988.
A H4 Quasimodo resistance level at 0.8007.
A H4 127.2% Fib ext. point at 0.80 taken from the low 0.7807.
August’s opening level at 0.7998.
A H4 Harmonic Gartley reversal point at the 78.6% Fib resistance line drawn from 0.8011.
Suggestions: While the above structures (H4 green sell zone) boast attractive confluence, one must take into account the possibility that a fakeout may be seen up to the daily Quasimodo resistance level at 0.8030 sited just above the green zone. Traditionally, when trading the Gartley Harmonic pattern the stop-loss order should go beyond the X point (0.8065). If you were to follow this, a fakeout up to the daily Quasimodo resistance is not a concern. It is more for the aggressive traders who will likely look to position stops just beyond the green zone. Should you be one of those traders, you may want to consider waiting for the H4 candles to prove seller intent from the sell zone (in the form of either a full, or near-full-bodied bearish candle), before pulling the trigger. This will help avoid a fakeout should it occur.
Should Aussie bulls find their feet today and push back above the 0.7950 area, we will once again be watching 0.80 for selling opportunities. Until then, however, we have absolutely no interest in trading this market.
Data points to consider: US Consumer confidence at 3pm GMT+1.
Levels to watch/live orders:
- Buys: Flat (stop loss: N/A).
- Sells: 0.8011/0.7988 (stop loss: either wait for a H4 bearish candle to form in the shape of a full, or near-full-bodied candle, and place stops above the candle’s wick. Another option is to simply enter at 0.80 and place stops above the H4 Harmonic X point at 0.8067).
USD/JPY
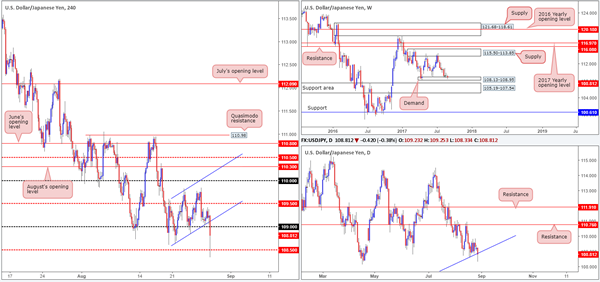
The USD/JPY sported a rather lackluster session on Monday, bolstered by a H4 channel support line etched from the low 108.63. In recent hours, however, the pair plunged lower as investors seek the safe-haven yen following North Korea/Japanese news. North Korea launched a missile that passed over Japan’s airspace in the early hours of Tuesday, before landing in the Pacific. This has, as you’d expect, caused tension between the two countries and that is being reflected on the charts!
From a technical perspective, the pair remains trading around the weekly demand at 108.13-108.95. However, the recent down move has placed daily price beneath the trendline support extended from the low 100.08. In addition to this, the H4 candles ran through bids at 109 and challenged the 108.50 line as support, which, for now, is holding ground.
Suggestions: Personally speaking, until the North Korea/Japanese news cools down, we will not be initiating any trades on this pair.
Data points to consider: US Consumer confidence at 3pm GMT+1.
Levels to watch/live orders:
- Buys: Flat (stop loss: N/A).
- Sells: Flat (stop loss: N/A).
USD/CAD
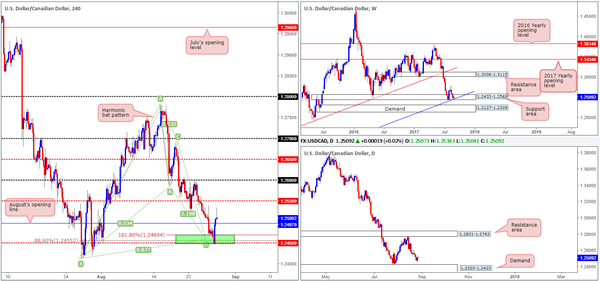
For those who read Monday’s report you may recall our team stating that should the H4 Harmonic bat pattern complete at 1.2455, we will be interested buyers here. As you can see, price tested the 1.2450 region beautifully and rallied higher. Well done to any of our readers who jumped on board alongside us here.
We executed a trade at 1.2455 and initially had our stop at 1.2411. Once price struck August’s opening level at 1.2497 (one times the risk), we moved the stop to breakeven. Ultimately, we’re looking for 1.2497 to hold as support and eventually push up to the 1.2550 neighborhood to take partial profits.
Suggestions: For those who missed the initial buy at 1.2455, you may, seeing that weekly price is bouncing from a support area coming in at 1.2433-1.2569 (unites with a trendline support etched from the low 0.9633), want to consider buying from 1.2497.
Data points to consider: US Consumer confidence at 3pm GMT+1.
Levels to watch/live orders:
- Buys: 1.2455 9 ([live] stop loss: breakeven).
- Sells: Flat (stop loss: N/A).
USD/CHF
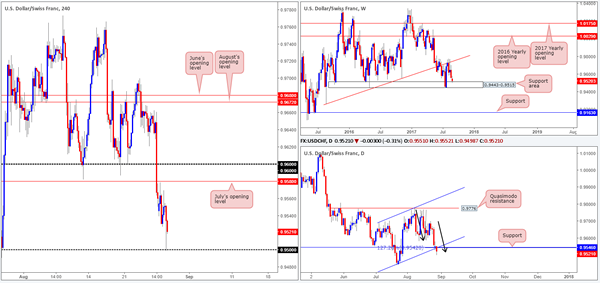
USD/CHF prices fell in recent trade after North Korea fired a ballistic missile over Japan. This forced the pair to touch gloves with the 0.95 handle, which has so far remained intact. On a more bearish note, however, daily price recently crossed below support at 0.9546, which happens to unite with a channel support etched from the low 0.9438 and an AB=CD (black arrows) 127.2% ext. point at 0.9542. Despite this though, the technical picture up on the weekly timeframe shows price shaking hands with a support area coming in at 0.9443-0.9515.
With the above notes taken onboard, neither a long nor short seems attractive at this time. A buy in this market places you against potential daily sellers and a sell would unfortunately position one against possible weekly buyers!
Suggestions: Personally, we feel the best path to take here is to remain on the sidelines and reassess structure going into tomorrow’s open.
Data points to consider: US Consumer confidence at 3pm GMT+1.
Levels to watch/live orders:
- Buys: Flat (stop loss: N/A).
- Sells: Flat (stop loss: N/A).
DOW 30
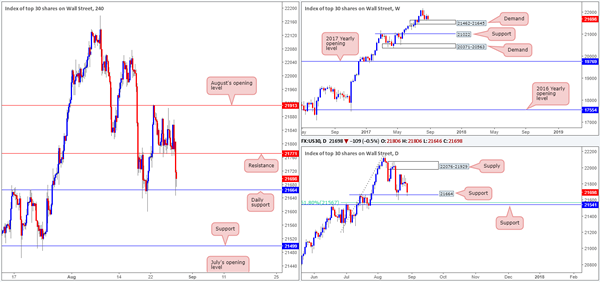
In recent hours US equities slipped below support at 21771, allowing the unit to tag bids at the daily support level carved form 21664.We believe this move was triggered by recent tensions between North Korea and Japan, as North Korea launched a missile that passed over Japan’s airspace in the early hours of Tuesday, before landing in the Pacific.
Looking at this market form a technical perspective, weekly buyers still remain afloat above demand at 21462-21645. And, as already mentioned, daily price is seen interacting with a support level pegged at 21664. Apart from a move being seen down to the daily support at 21541 (converging with a 61.8% Fib support at 21567), we feel this market will eventually head north.
Our suggestions: With additional confirmation in the form of a H4 bullish candle (preferably a full, or near-full-bodied candle), we feel a buy from 21664 may be viable, targeting 21771 as an initial take-profit zone.
Data points to consider: US Consumer confidence at 3pm GMT+1.
Levels to watch/live orders:
- Buys: 21664 region ([waiting for a reasonably sized H4 bullish candle to form – preferably a full, or near-full-bodied candle – is advised] stop loss: ideally beyond the candle’s tail).
- Sells: Flat (stop loss: N/A).
GOLD
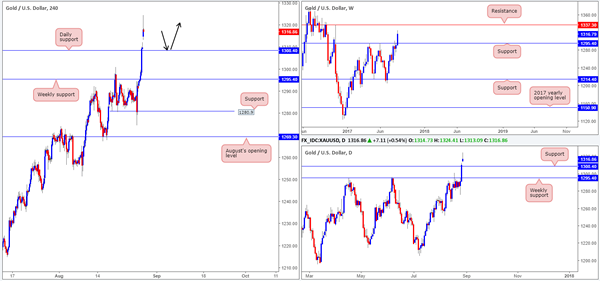
Gold snapped higher this morning after North Korea launched a ballistic missile over Japan in the early hours of Tuesday, boosting demand for the safe-haven metal. According to the weekly timeframe, this has placed price within striking distance of a resistance level drawn from 1337.3. Before reaching this level though, it’s possible we may see price retest the daily support level at 1308.4, as per the black arrows.
For those interested in buying from here, we would strongly recommend waiting for additional confirmation to help avoid a possible fakeout. A reasonably sized H4 bullish candle, preferably a full, or near-full-bodied candle, would be ideal here. This would, in our view, show that we have interested buyers at this level.
Our suggestions: Watch for buying opportunities on any retest seen at 1308.4 today.
Levels to watch/live orders:
- Buys: 1308.4 region ([waiting for a reasonably sized H4 bullish candle to form – preferably a full, or near-full-bodied candle – is advised] stop loss: ideally beyond the candle’s tail).
- Sells: Flat (stop loss: N/A).
European Open Briefing: Asian Stock Markets Were Jolted After North Korea Fired A Ballistic Missile Test Over Japan
Global Markets:
- Asian stock markets: Nikkei fell 0.49 %, Shanghai Composite down 0.07 %, Hang Seng dropped 0.40 %, ASX 200 down 0.86 %
- Commodities: Gold at $1321.94 (+0.50 %), Silver at $17.44 (+0.04 %), WTI Oil at $46.80 (+0.49 %), Brent Oil at $51.60 (+0.35 %)
- Rates: US 10-year yield at 2.12, UK 10-year yield at 1.05, German 10-year yield at 0.37
News & Data:
- AUD HIA New Home Sales m/m -3.7 % vs -6.9 % previous
- JPY BOJ Core CPI y/y 0.4 % vs 0.2 % expected
- CHF Employment Level (Q2) 4.910 M vs 4.884 M previous
- EUR M3 Money Supply y/y 4.5 % vs 4.9 % expected
- EUR Private Loans y/y 2.6 % vs 2-.7 % expected
- USD Goods Trade Balance (Jul) -65.1 B vs -64.5 B expected
- Dollar falls to four-month low vs. yen after North Korea fires missile- RTRS
- Flooding knocks out U.S. refineries, crude hit by supply disruptions- RTRS
Markets Update:
Asian stock markets were jolted after North Korea fired a ballistic missile test over Japan, fuelling worries of fresh tension between Washington and Pyongyang. The launch represented an “unprecedented, grave and serious threat” to Japan, said chief government spokesman Yoshihide Suga. Amidst the rising tension, Global Investors sought out havens, boosting assets such as the Japanese yen and Gold.
USDJPY is currently seen trading at 108.81 with a net loss of 0.4 percentage. Earlier in the day the Yen had risen 0.8 percent to 108.33 against the dollar, its highest since April, despite Japan’s proximity to North Korea. The reasoning behind this is that Japan is the world’s biggest creditor nation and there is an assumption that Japanese investors will repatriate funds should a crisis materialize; therefore, the Yen tends to benefit during times of geopolitical or financial stress.
EURUSD hit a 2 and a half year high of $1.1986 yesterday after European Central Bank chief Mario Draghi did not express concern about the currency’s recent rise in his speech at Jackson Hole. However, the EURO has not been as active earlier in Tuesday’s session falling a mere 0.1 percent against the USD with a small fall to under 1.1960 at one stage
AUDUSD is currently seen trading at 0.7930, earlier in the session 'Risk off' in the global markets was seen impacting AUD especially as it traded down from above 0.7960 to under 0.7910 before retracing to the current price. Similar to the Aussie, the NZD also traded down to lows around 0.7220 against the USD then back above 0.7250 and is currently back down near its session lows
Upcoming Events:
- 06:00 GMT – (EUR) GfK German Consumer Climate
- 06:00 GMT – (GBP) Nationwide HPI
- 06:45 GMT – (EUR) French GDP (QoQ)
- 12:30 GMT – (CAD) RMPI m/m
- 14:00 GMT – (USD) CB Consumer Confidence
- 22:40 GMT – (NZD) Building Consents (MoM)
Aussie Dollar Trading On A Stronger Footing This Morning
For the 24 hours to 23:00 GMT, the AUD declined 0.3% against the USD and closed at 0.7918.
LME Copper prices rose 2.1% or $137.0/MT to $6714.0/MT. Aluminium prices declined 0.4% or $8.5/MT to $2096.5/MT.
In the Asian session, at GMT0300, the pair is trading at 0.7929, with the AUD trading 0.14% higher against the USD from yesterday’s close.
The pair is expected to find support at 0.7899, and a fall through could take it to the next support level of 0.7869. The pair is expected to find its first resistance at 0.7966, and a rise through could take it to the next resistance level of 0.8003.
Going forward, Australia’s building approvals data for July, due to release in the early hours of tomorrow, will attract significant of amount of market attention.
The currency pair is trading below its 20 Hr moving average and showing convergence with its 50 Hr moving average.

Euro Trading Marginally Higher, Ahead Of Germany’s GfK Consumer Confidence Data
For the 24 hours to 23:00 GMT, the EUR rose 0.35% against the USD and closed at 1.1967.
On the economic front, Italy's consumer confidence index unexpectedly rose to a level of 110.8 in August, surging to an eight-month high level, while market participants had anticipated it to remain steady at a revised level of 106.9 registered in the prior month.
The greenback lost ground against most of its major peers, as investors remained disappointed after comments from the US Federal Reserve (Fed) Chairwoman, Janet Yellen, in Jackson Hole, provided little indications on the central bank's monetary policy outlook. Additionally, concerns about how tropical storm, Harvey, might impact the country's economic growth weighed on investor sentiment.
On the data front, advance goods trade deficit in the US widened more-than-expected to a level of $65.1 billion in July, amid a sharp drop in exports. In the previous month, the nation posted a revised advance goods trade deficit of $64.0 billion, while markets had expected it to widen to a level of $64.5 billion.
On the other hand, the nation's seasonally adjusted preliminary wholesale inventories registered a rise of 0.4% MoM in July, higher than market consensus for a gain of 0.3% and following an advance of 0.7% in the previous month. Moreover, the nation's Dallas Fed manufacturing business index climbed to a level of 17.0 in August, meeting market expectations and compared to a reading of 16.8 in the previous month.
In the Asian session, at GMT0300, the pair is trading at 1.1970, with the EUR trading a tad higher against the USD from yesterday's close.
The pair is expected to find support at 1.1929, and a fall through could take it to the next support level of 1.1889. The pair is expected to find its first resistance at 1.1998, and a rise through could take it to the next resistance level of 1.2027.
Moving ahead, investors will direct their attention to Germany's GfK consumer confidence for September, slated to release in a while. Further, the US consumer confidence index for August, due to release later in the day, will be on investors' radar.
The currency pair is trading above its 20 Hr and 50 Hr moving averages.

Third Round Of Brexit Talks Underway In Brussels
For the 24 hours to 23:00 GMT, the GBP rose 0.31% against the USD and closed at 1.2929.
Meanwhile, another round of Brexit negotiations kicked off yesterday, with UK’s Labour party favouring for a softer departure from the European Union that would allow the nation to retain access to the single market.
In the Asian session, at GMT0300, the pair is trading at 1.2939, with the GBP trading 0.08% higher against the USD from yesterday’s close.
The pair is expected to find support at 1.2894, and a fall through could take it to the next support level of 1.285. The pair is expected to find its first resistance at 1.2963, and a rise through could take it to the next resistance level of 1.2988.
Going ahead, market participants will focus on UK’s nationwide house prices for August, slated to release in a while.
The currency pair is trading above its 20 Hr and 50 Hr moving averages.

Japanese Yen Reverses Its Gains In The Asian Session
For the 24 hours to 23:00 GMT, the USD declined 0.43% against the JPY and closed at 108.66.
In the Asian session, at GMT0300, the pair is trading at 108.81, with the USD trading 0.14% higher against the JPY from yesterday’s close.
Overnight data indicated that Japan’s unemployment rate remained steady at 2.8% in July, in line with market expectations.
The pair is expected to find support at 108.30, and a fall through could take it to the next support level of 107.78. The pair is expected to find its first resistance at 109.37, and a rise through could take it to the next resistance level of 109.92.
The currency pair is trading below its 20 Hr and 50 Hr moving averages.

Swiss Franc Trading A Tad Lower This Morning
For the 24 hours to 23:00 GMT, the USD declined 0.4% against the CHF and closed at 0.9518.
On the macro front, Switzerland’s total sight deposits rose to a level of CHF579.8 billion in the week ended 25 August, compared to a level of CHF579.5 billion reported in the previous week.
In the Asian session, at GMT0300, the pair is trading at 0.9521, with the USD trading marginally higher against the CHF from yesterday’s close.
The pair is expected to find support at 0.9488, and a fall through could take it to the next support level of 0.9455. The pair is expected to find its first resistance at 0.9566, and a rise through could take it to the next resistance level of 0.9611.
With no economic releases in Switzerland today, investors will look forward to global macroeconomic news for further direction.
The currency pair is trading below its 20 Hr and 50 Hr moving averages.

Loonie Trading Higher In The Morning Session
For the 24 hours to 23:00 GMT, the USD rose 0.34% against the CAD and closed at 1.2515.
In the Asian session, at GMT0300, the pair is trading at 1.2504, with the USD trading 0.09% lower against the CAD from yesterday’s close.
The pair is expected to find support at 1.2454, and a fall through could take it to the next support level of 1.2404. The pair is expected to find its first resistance at 1.2544, and a rise through could take it to the next resistance level of 1.2584.
The currency pair is trading above its 20 Hr and 50 Hr moving averages.

AUD/USD Daily Outlook
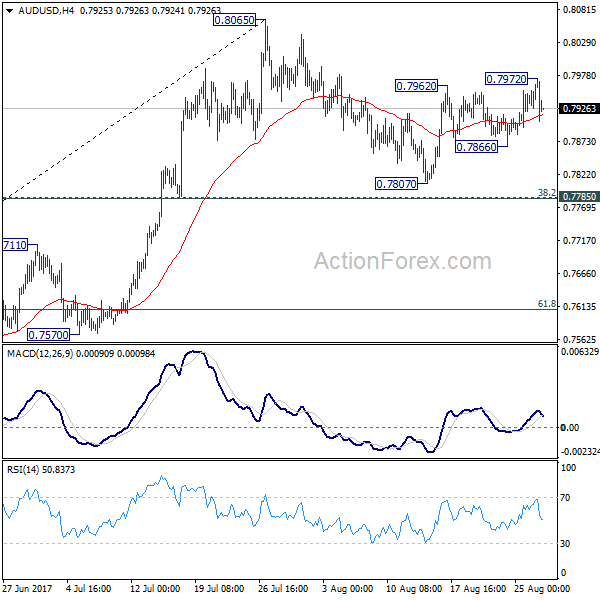
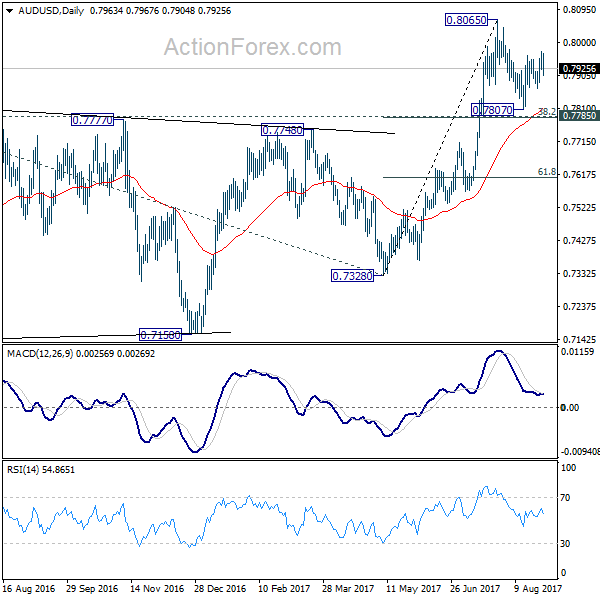
Daily Pivots: (S1) 0.7930; (P) 0.7952; (R1) 0.7983; More...
Despite edging higher to 0.7972, AUD/USD quickly retreated back to familiar range. Intraday bias stays neutral first. Correction from 0.8065 might extend and another fall cannot be ruled out. But downside should be contained by 0.7785 cluster support (38.2% retracement of 0.7328 to 0.8065 at 0.7783) to bring rebound. Above 0.7972 will target a test on 0.8065 resistance first. Firm break of 0.8065 will resume the medium term rise and target 100% projection of 0.6826 to 0.7833 from 0.7328 at 0.8335.
In the bigger picture, rise from 0.6826 medium term bottom is still in progress. At this point, there is no confirmation of trend reversal yet and we'll continue to treat such rebound as a corrective pattern. But in any case, break of 55 month EMA (now at 0.8097) will target 38.2% retracement of 1.1079 to 0.6826 at 0.8451. Break of 0.7328 support is needed to confirm completion of the rebound. Otherwise, further rise is now in favor.
USD/CAD Daily Outlook
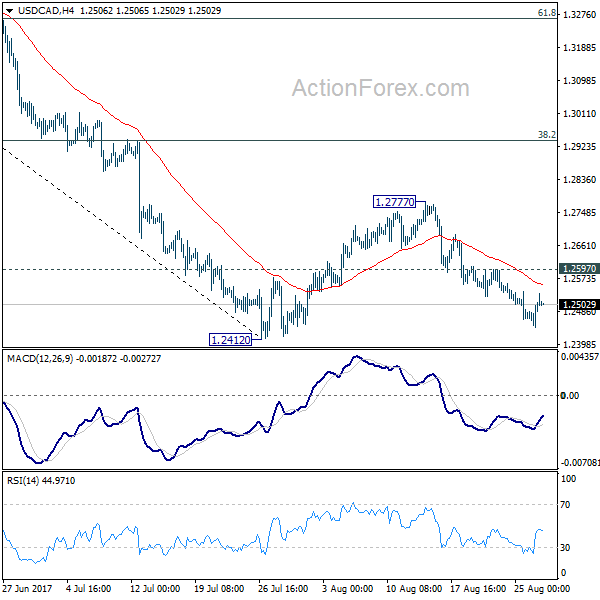
Daily Pivots: (S1) 1.2463; (P) 1.2486; (R1) 1.2530; More....
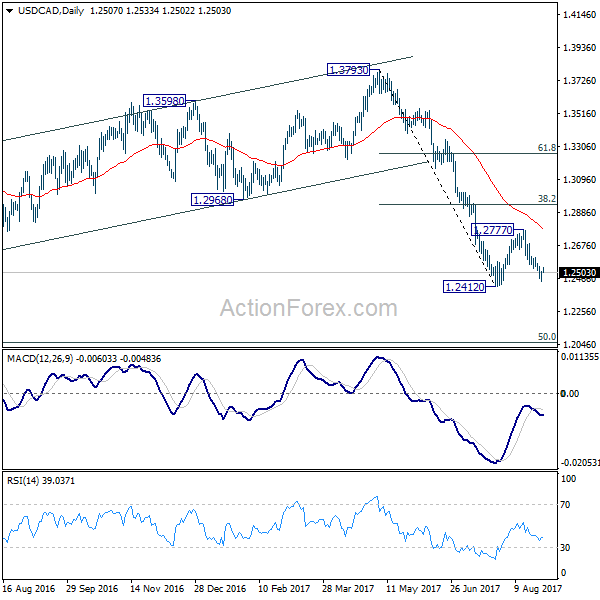
USD/CAD recovers ahead of 1.2412 low and intraday bias is turned neutral first. On the downside, break of 1.2412 will resume recent fall from 1.3793 and target next long term fibonacci level at 1.2048. On the upside, above 1.2597 minor resistance will extend the consolidation from 1.2412 with another rise. But we'd expect upside to be limited by 38.2% retracement of 1.3793 to 1.2412 at 1.2940 to bring fall resumption eventually.
In the bigger picture, price actions from 1.4689 medium term top are seen as a correction pattern. Such corrective fall is still expected to extend to 50% retracement of 0.9406 to 1.4869 at 1.2048. At this point, we'd look for strong support from there to contain downside and bring rebound. Nonetheless, on the upside, sustained break of 1.2968, 38.2% retracement of 1.3793 to 1.2412 at 1.2940 will be the first sign of completion of the correction and will turn focus back to 1.3793 key resistance.