
Sample Category Title
Technical Outlook: Cable Extends Gains After Break Above Daily Cloud
Cable extends gains after yesterday's rally and close above daily cloud that generated strong bullish signal. Fresh acceleration higher on Tuesday tested next barrier at 1.2962 (Fibo 38.2% of 1.3268/1.2773 descend) and could trigger further correction on sustained break.
Falling 30SMA (1.2990) and psychological 1.3000 barriers are next targets, followed by daily Kijun-sen (1.3020) and Fibo 61.8% at 1.3079.
Corrective easing could be anticipated as slow stochastic entered overbought territory.
Broken cloud top and 100SMA offer solid supports at 1.2912/1.2898 which should ideally contain dips.
Res: 1.2962, 1.2990, 1.3020, 1.3079
Sup: 1.2932, 1.2912, 1.2898, 1.2873
Technical Outlook: EURUSD Set For Further Advance After Breaking 1.2000 Barrier
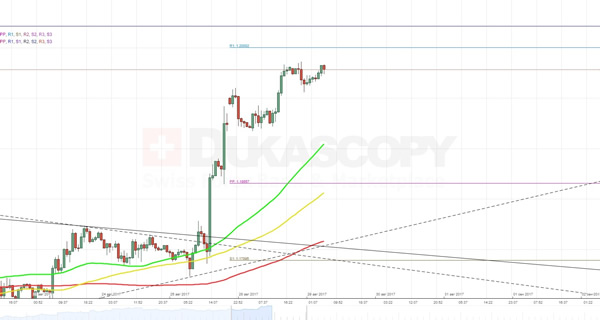
The Euro eventually broke above 1.2000 target in early Tuesday's trading and shows scope for further advance on triggering large stops that lay above.
Firm bullish sentiment has been reinforced by fresh weakness of the US dollar, after North Korea fired a missile that passed over northern Japan, raising global tensions and sparking fresh risk-off mode in the markets.
Fresh acceleration above 1.2000 barrier opens way towards Fibonacci 138.2% projection at 1.2101 and could travel to 1.2166 (50% retracement of larger 1.3992/1.0340 descend).
Some corrective easing could be expected as slow stochastic is strongly overbought and daily RSI is breaking into overbought zone, but no firmer signal seen so far.
Corrective dips will be seen as fresh buying opportunities.
Res: 1.2063' 1.2106' 1.2166' 1.2200
Sup: 1.2000' 1.1955' 1.1910' 1.1846
XAUUSD Analysis: Surges Above 1,316.50
During the whole previous trading day, the yellow metal was continuing to appreciate against the US Dollar. The only barrier that managed to stop the surge was a combined resistance level formed by the monthly R2 at 1,315.30 and the weekly R3 at 1,316.51.On the one hand, today the buck should try to restore some of the lost positions. On the other hand, the bullion now has a new, solid support level, which it can use to try to reach a new target, such as the monthly R3 at 1,359.22. It should be noted that this pivot point represents the only and closest obstacle from the northern side. In the meantime, there is also a need to take into account an effect from escalation of the North Korea crisis and a release of data on the US CB Consumer Confidence at 14:00 GMT.
USD/JPY Analysis: Falls As North Korean Crisis Escalates
In result of a new ballistic missile test conducted by North Korea, the American Dollar lost 0.57% against the Japanese Yen just in two hours. Accordingly, in the first half of Tuesday the buck is expected to try to recover some of the lost value. However, even if it succeeds to break through the upper boundary of a junior descending channel, the pair most likely will fail to climb above 109.28, as this resistance level is reliably protected by a combination of the weekly PP and the 55-, 100- and 200-hour SMAs.
In addition, there is a need to take into account another fundamental event that will happen at 14:00 GMT, i.e. a release of data on the US CB Consumer Confidence.
GBP/USD Analysis: Tries To Break 1.2944
Fortunately for the Pound, the eight-hour downfall was stopped already near the 1.2880 level. Accordingly, the rest of the day the Sterling spent in a recovery against the US Dollar. By the moment, the pair has reached a combined resistance level set up by the weekly R1 at 1.2942 and the monthly S1 at 1.2944. From a daily chart perspective, the further surge seems unlikely. On the other hand, an extensive fall is not expected as well, as the southern side is secured by the 55-, 100- and 200-hour SMAs together with the weekly R1 at 1.2858. It is quite possible that the rate will stuck at the above resistance for some time. In this sense, a decisive signal is expected to be given by release of information on the US CB Consumer Confidence at 14:00 GMT.
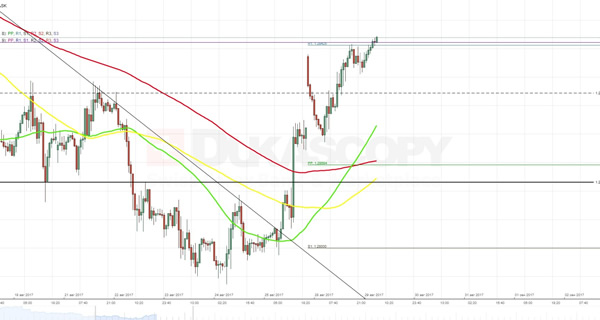
EUR/USD Analysis: Heads Towards 1.2000
The common European currency is continuing to advance against the US Dollar, using an upside momentum that was provided by the Jackson Hole Symposium. In result of the previous trading session, the currency rate has entered into a small ascending channel, which is expected to help the pair to surge to the 1.2000 level. Afterwards, a rebound might happen, as the further road is secured not only by the weekly R1, but also by the monthly R1 at 1.2021. The opposite side, in contrast, is protected only by the 55-hour SMA. However, there is a need to take into account an impact on the value of buck after release of information on the US CB Consumer Confidence at 14:00 GMT, which is expected to plunge to 120.9, compared to the 121.1 last month.
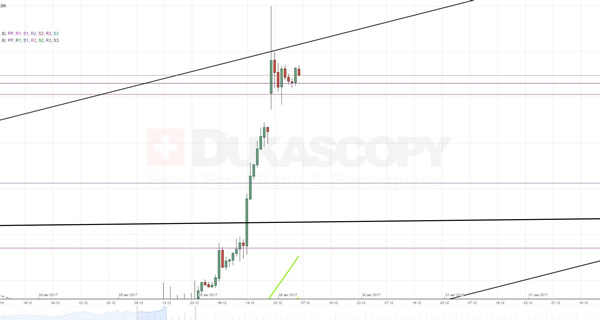
Trade Idea : EUR/USD – Buy at 1.2000
EUR/USD - 1.2041
Most recent candlesticks pattern : N/A
Trend : Up
Tenkan-Sen level : 1.2000
Kijun-Sen level : 1.1982
Ichimoku cloud top : 1.1903
Ichimoku cloud bottom : 1.1867
Original strategy :
Buy at 1.1870, Target: 1.1970, Stop: 1.1835
Position : -
Target : -
Stop : -
New strategy :
Buy at 1.2000, Target: 1.2100, Stop: 1.1965
Position : -
Target : -
Stop : -
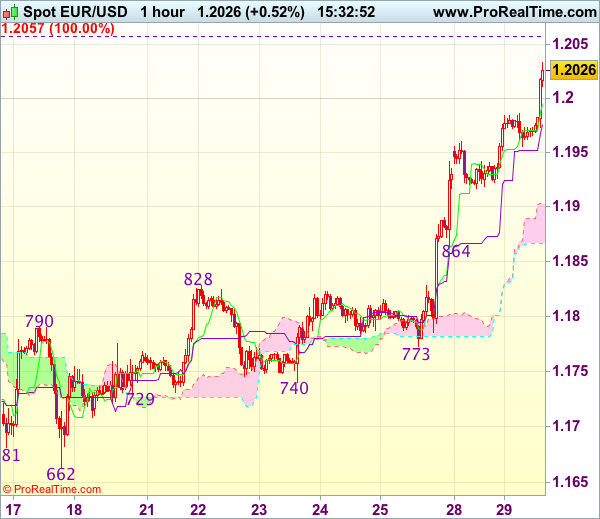
As euro’s upmove has accelerated after last week’s anticipated rally above previous resistance at 1.1910 (now support), adding credence to our bullish view that recent upmove is still in progress and may extend headway to 1.2055-60 and then 1.2095-00, however, near term overbought condition should limit upside and reckon 1.2150-55 (61.8% projection of 1.1119-1.1910 measuring from 1.1662) would hold from here, bring retreat later.
In view of this, would not chase this rise here and would be prudent to reinstate long on pullback as the Tenkan-Sen (now at 1.2000) should limit downside. Only below intra-day support at 1.1955 would defer and risk correction to 1.1930 but said previous resistance at 1.1910 should limit downside.
EUR/USD: M3 Money Supply
The European Central Bank published its monthly report showing the total change in M3 Money Supply as well as in private loans, which caused a modest fall in the EUR/USD exchange rate. A decrease was initially offset, suggesting stronger bullish sentiment for the Euro, which held the pair above the 1.1930 level in the early Monday's session.
The ECB released its monthly figures on the amount of money in circulation. According to the Central Bank's report, the M3 Money Supply dropped 4.5% on an annual basis over the course of July, following the prior month's 5.0% and missing forecasts for a decline of 4.9%. However, private lending grew 2.6%, matching the previous month's pace, providing an additional bullish signal for the future of the EU economy.
Yen Soars On North Korean Tensions
The Japanese Yen has moved to a four-month trading high against the U.S dollar, hitting 108.33, after North Korea fired a missile that flew over directly over Japan, further escalating tensions in the Korean peninsula.
At present, the USDJPY pair is trading around the 108.80 level, with traders now awaiting a response to North Korea's provocation, as fundamental developments dictate the directional bias of risk-assets.
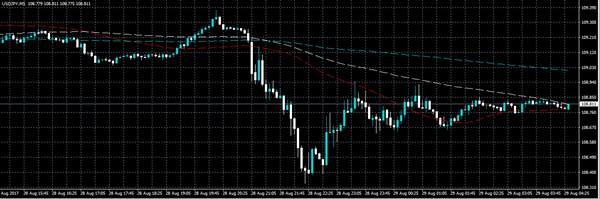
From a technical perspective, the USDJPY remains strongly bearish below the 109 level, with traders now watching higher-time frame price closes below the 108.60 support level.
Key technical support below the 108.60 level is found at, 108.33, the April 17th price low, at 108.13, and the 61.8 percent Fibonacci retracement of the 118.66 swing high to the 98.99 swing low, at 106.60.
To the upside, key intraday resistance for the USDJPY pair is found at the daily pivot point, at 108.99. Above the 109 level, the 50-hour moving average is located, at 109.20, with the weekly pivot point just above, at 109.28.
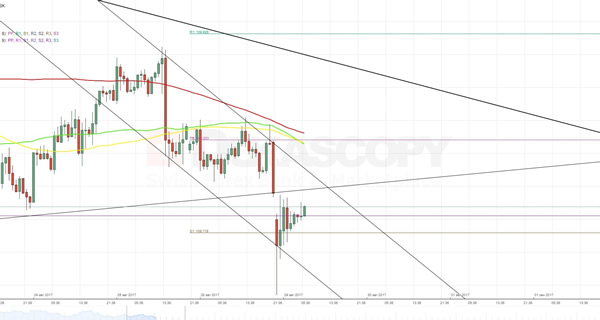
Trade Idea : USD/JPY – Sell at 109.15
USD/JPY - 108.62
Most recent candlesticks pattern : N/A
Trend : Near term down
Tenkan-Sen level : 108.76
Kijun-Sen level : 108.87
Ichimoku cloud top : 109.44
Ichimoku cloud bottom : 109.32
Original strategy :
Bought at 109.25, stopped at 109.00
Position : - Long at 109.25
Target : -
Stop : - 109.00
New strategy :
Sell at 109.15, Target: 108.15, Stop: 109.50
Position : -
Target : -
Stop : -
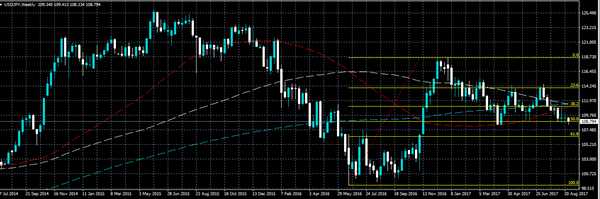
Dollar’s initial selloff below previous support at 108.60 signals recent decline from 114.50 is still in progress and further weakness to previous chart support at 108.13 (this year’s low) would be seen, break there would confirm early decline from 118.66 top has resumed and bring subsequent fall to 108.05-06 (50% projection of 114.50-108.73 measuring from 110.95) but reckon near term oversold condition would limit downside to 117.70 and 117.35-40 (61.8% projection) would hold from here, bring rebound later.
In view of this, would not chase this fall here and would be prudent to sell dollar on subsequent rebound as resistance at 109.41 (yesterday’s high) would cap upside and bring another decline. Only break of resistance at 109.85 would abort and signal a temporary low is formed instead.
