Sample Category Title
Trade Idea: GBP/JPY – Sell at 142.00
GBP/JPY - 140.75
Trend: Near term down
Original strategy:
Sell at 142.00, Target: 140.00, Stop: 142.60
Position: -
Target: -
Stop: -
New strategy :
Sell at 142.00, Target: 140.00, Stop: 142.60
Position: -
Target: -
Stop:-
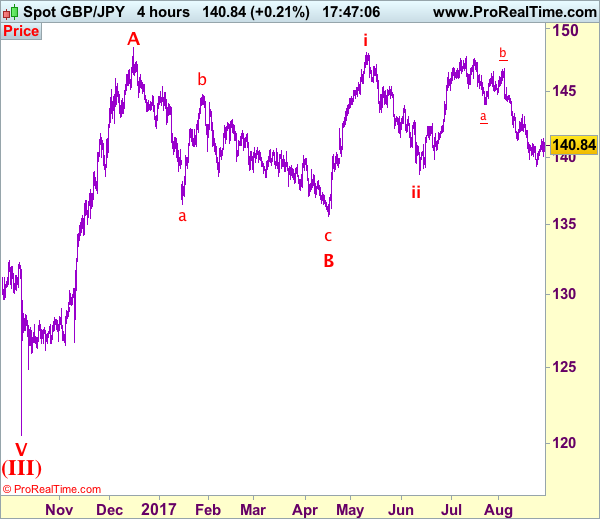
Although the British pound retreated after marginal rise to 141.40 yesterday, as sterling found good support just above 140.00 level and has rebounded, retaining our view that further consolidation would take place and another bounce to 141.40 is likely, however, still reckon upside would be limited to 141.90-00 and bring another decline later. A break of said support at 140.00-05 would suggest top is possibly formed, break of 139.80-85 would signal the rebound from 139.35 has ended, bring retest of this level, below would extend recent decline to 138.70 (previous support) but loss of downward momentum should prevent sharp fall below 138.30 and 138.00 should hold.
In view of this, we are looking to sell sterling on subsequent recovery as 141.90-00 should limit upside and bring such a decline. A firm break above resistance at 142.05 would suggest low is possibly formed instead, bring a stronger rebound to 142.50-60 but resistance at 143.20 should remain intact and bring another decline later.
Our preferred count is that larger degree wave V with circle is unfolding from 251.12 with wave (I) 219.34, (II): 241.38 and wave (III) is subdivided into 1: 192.60, 2: 215.89 (23 Jul 2008) and wave 3 ended at 118.87 earlier in 2009. The correction from there to 162.60 is wave 4 which itself is a double three and is labeled as first a-b-c ended at 151.53, followed by wave x at 139.03, 2nd a ended at 162.60, 2nd b at 146.75 and 2nd c leg of wave 4 ended at 163.00. Therefore, the decline from 163.00 to 116.85 is now treated as wave 5 which also marked the end of larger degree wave (III), hence wave (IV) major correction has commenced for retracement of the wave (III) from 241.38 and upside target at 183.95-00 (50% Fibonacci retracement of the wave (II) from 241.38) had been met, a drop below 160.00 would suggest wave (IV) has ended at 195.85, bring decline in wave (V) for initial weakness to 130 (already met) and 120.
Tensions Flare Amid Missile Launch
Rush for safe-haven as North Korea fires missiles
Investors piled into safe havens on Tuesday morning amid rising global uncertainties. Firstly, last week comments from Donald Trump have heightened concerned about a potential government shutdown should the Congress keeps refusing to fund the wall along the southern border with Mexico. Even the arrival of Hurricane Harvey in Texas wasn’t enough to make Trump back off on his threat. Against such a backdrop, the US dollar extended losses with the dollar index breaking the 91.91 support (low from May 2016) to the downside. Normally, the greenback is considered as a “light” safe haven asset meaning that when uncertainty rises, the dollar depreciates against the Japanese yen and the Swiss franc at most. It seems now that Trump punches its weights on the USD.
The launching of ballistic missiles over Japan by North Korea also helped the CHF and the JPY to rise across the board. So far investors wrongly assumed that the North Korean situation was under control and that some negotiations were taking place behind closed door. The Swiss franc and the Japanese yen rose 0.90% and 0.75% against the USD. The yellow metal was also better bid as it climbed to $1,325 per ounce, up 1.15% on the day.
Despite the fact that the Trump and Kim Jong-un are keeping investors on their toes for longer than expected, we maintain our view that the USD is oversold. The question now is to determine how long this spike in uncertainty will last. Therefore investors will need to have patience and let the storm go by.
Gold bounces back
For the first time this year, gold has broken the strong resistance at $1300 and the precious metal is now standing around 1317$, its highest level since 2016. The summer was quiet but volatility is back due to the escalating tensions between the US and North Korea. We also believe that those tensions are not the only reasons for the gold surge. Economic reasons are also important. The US S&P 500 index went from 2480 to 2440 and it seems that investors become more reluctant to buy stocks at those elevated prices.
On top of that, we consider that the Fed made a clear U-turn by raising rates twice this year before stating that it was almost done with rate hikes. The US central bank went from hawkish to dovish. We recall that the Fed was expected to raise rates at least 3-4 times this year. Markets are now ruling out a rate hike before year-end.
Trade Idea: EUR/JPY – Hold long entered at 129.70
EUR/JPY - 130.75
Original strategy:
Bought at 129.70, Target: 131.70, Stop: 129.10
Position: - Long at 129.70
Target: - 131.70
Stop: - 129.10
New strategy :
Hold long entered at 129.70, Target: 131.70, Stop: 130.00
Position: - Long at 129.70
Target: - 131.70
Stop:- 130.00
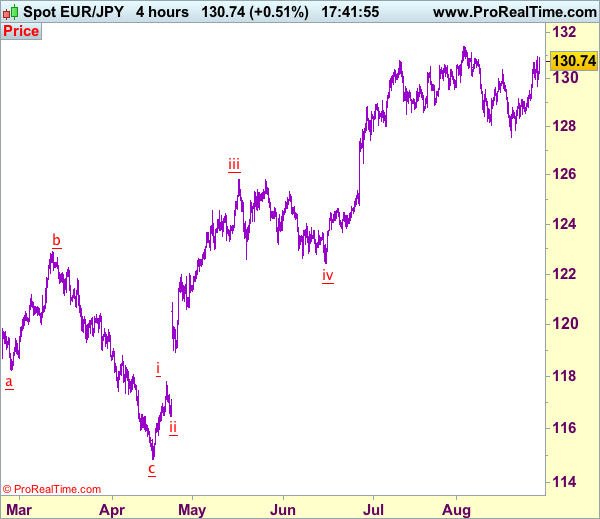
Although the single currency retreated after rising to 130.97 yesterday, as euro found renewed buying interest at 129.66 and has rebounded in line with our bullish expectation (we recommended to buy at 129.70 and a long position was entered), adding credence to our bullish view that the rise from 127.56 low is still in progress, hence further gain to recent high at 131.40 would be seen, once this level is penetrated, this would extend early upmove to 131.90-00 but near term overbought condition should prevent sharp move beyond 132.50-60.
In view of this, we are holding on to our long position entered at 129.70. Below 130.00 would risk test of said support at 129.66 but only break there would signal top is formed instead, risk correction to 129.10-15, break there would confirm and correction to 128.75-80 would follow but still reckon 128.30-35 support would remain intact and bring another rise later this week.
Our latest preferred count is that wave (ii) is ABC-X-ABC which ended at 123.33 and wave (iii) is unfolding with wave iii ended at 100.77, followed by wave iv at 111.57 and wave v as well as the wave (iii) has ended at 97.04, followed by wave (iv) at 111.43 and wave (v) has ended at 94.12 which is also the end of the larger degree v, this also implied the major wave (C) has also ended there, hence major correction has commenced from there with (A) leg unfolding in its lower degree wave c which has possibly ended at 145.69. Under this count, A-B-C wave (B) has commenced with A leg ended at 136.23, wave B at 143.79 and wave C has possibly ended at 149.79.
Our larger degree count is that the decline from 139.26 is wave (C) and is sub-divided into a diagonal triangle i-ii-iii-iv-v with wave i - 105.44, wave ii- 123.33, wave iii - 97.03, wave iv - 111.43, followed by the final wave v as well as the end of wave (C) at 94.12, this also mark the bottom of larger degree wave B. Under this count, major rise in wave C has commenced as an impulsive wave with minor wave III ended at 145.69, wave V is still in progress for further gain to 150.00. Having said that, this so-called wave V could well be the first leg of larger degree 5-waver wave C and this wave C should bring at least a retest of wave A top at 169.97 (July 2008).
Risk Aversion Prevails As North Korea Fires Missile Over Japan
Overnight, North Korea fired a missile that violated Japanese airspace and fell approximately 1180km east of Japan’s Hokkaido Island. According to media reports, this act may have been intended to show that an attack on the US territory of Guam is possible. North Korea has conducted several missile tests lately, but a rocket has not flown over Japan since 2009. This marks a clear escalation of the latest geopolitical tensions in the region, and likely comes as a response to the military drill that the US and South Korea have been conducting recently.
The market response was a classic risk-off reaction, with investors immediately turning to safe haven assets. Gold, JPY, and CHF all rallied on the news, while riskier assets such as the AUD and Japanese stocks tumbled. We believe that this negative sentiment may spill over into European and US equity markets, the indices of which could open with negative gaps today.
Moving forward, we expect market action to be very much headline-driven. A lot may depend on how the US, Japan and South Korea respond to this aggression. Japanese PM Abe already stated that 'We must immediately hold an emergency meeting at the United Nations, and further strengthen pressure against North Korea'. Such a diplomatic response would likely be the 'soft' approach, and may thus carry little market impact. On the other hand, if we see an escalation in rhetoric, such as more 'fire and fury' comments or some form of action from the NATO countries, this risk-off sentiment could linger and we may see the overnight price action continue.
USD/JPY traded lower overnight following the news. The pair dipped briefly below 108.70 (S1), but quickly rebounded to trade fractionally above it. The rate is back within the range between 108.70 (S1) and 111.00 and thus, the short-term outlook remains flat in our view. If the situation escalates further, we expect the bears to drive the battle back below 108.70 (S1), a move that could turn the bias to the downside this time, and initially aim for the 108.00 (S2) support.
Switching to the daily chart, we see that the pair is trading within a broader range between 108.70 (S1) and 114.40. This keeps the medium-term outlook flat as well, but a clear dip below 108.70 (S1) could be the first sign for larger downside extensions, perhaps towards the long-term upside support line, taken from the low of the 24th of June 2016.
Gold surged yesterday, breaking above the key psychological barrier of 1300 (S2). Subsequently, the metal gapped further up after North Korea fired a missile over Japan, to hit resistance at 1325 (R1) before retreating somewhat. The 1300 (S2) zone acted as the upper bound of the wide range the metal has been trading within since the 31st of January, between that hurdle and the 1200 territory. As such, its clearing make us confident that the outlook may have turned somewhat positive. We would expect a move above 1325 (R1) to set the stage for extensions toward our next resistance of 1340 (R2). Having said that, given that the latest rally appears overextended, we would stay careful of a possible retreat before the bulls decide to take charge again. A dip below 1313 (S1) may confirm the case and is possible to open the way for a test near the 1300 (S2) zone as a support this time.
The economic calendar is light today:
We only get second-tier economic indicators: The UK nationwide house price index for August, Canada’s PPI for July, the US S&P/Case-Shiller house price index for June, and the nation’s Conference Board consumer confidence index for August are all due out. We have only one speaker on the agenda: Chicago Fed President Charles Evans. He is a voting FOMC member this year, and usually maintains a cautious stance on policy matters. Speaking in early August, Evans said that inflation would have to accelerate for him to support an interest-rate hike at the end of the year. Given that the latest US CPI prints were disappointing, we doubt he will deviate much from his latest dovish remarks.
USD/JPY
Support: 108.70 (S1), 108.00 (S2), 107.40 (S3)
Resistance: 109.00 (R1), 109.40 (R2), 109.75 (R3)
Gold
Support: 1313 (S1), 1300 (S2), 1292 (S3)
Resistance: 1325 (R1), 1340 (R2), 1352 (R3)
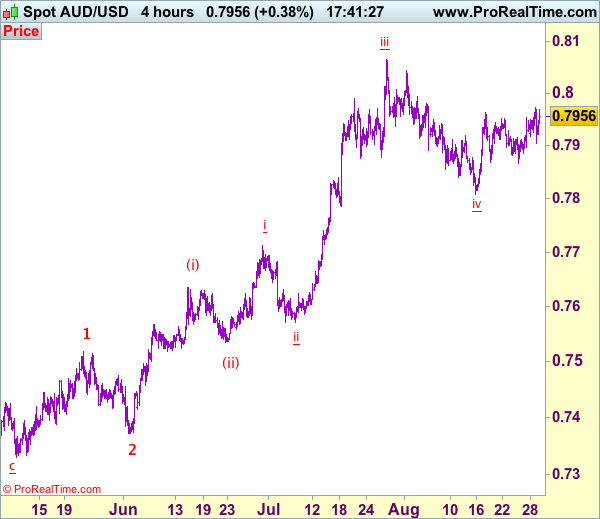
Trade Idea: AUD/USD – Hold long entered at 0.7895
AUD/USD – 0.7954
Original strategy :
Bought at 0.7895, Target: 0.8050, Stop: 0.7865
Position: - Long at 0.7895
Target: - 0.8050
Stop: - 0.7865
New strategy :
Hold long entered at 0.7895, Target: 0.8050, Stop: 0.7900
Position: - Long at 0.7895
Target: - 0.8050
Stop:- 0.7900
Although the pair retreated yesterday from 0.7973, as aussie found renewed buying interest at 0.7905 and has rebounded, retaining our near term bullishness and consolidation with upside bias remains for another rebound, above said resistance at 0.7973 would add credence to our view that low has possibly been formed at 0.7808 earlier this month, bring a stronger rebound to 0.8000, however, break there is needed to signal the pullback from 0.8066 top (wave iii peak) has ended at 0.7808 (wave iv) and bring eventual retest of this level.
In view of this, we are holding on to our long position entered at 0.7895. Below said support at 0.7905 would risk test of indicated previous support at 0.7865-67, break there would dampen this bullish scenario and suggest the rebound from 0.9808 has ended, bring another test of this level, below there would signal the wave iv correction from 0.8066 is still in progress for weakness to 0.7786 support, however, oversold condition should prevent sharp fall below 0.7750 and price should stay above i top at 0.7712, bring rebound later. We are keeping our latest bullish count that recent impulsive waves is unfolding as (1 2, (i)(ii), i ii) and may extend headway towards 0.8150.
On the 4-hour chart, the move from 0.8066 is the wave 5 with i: 0.8860, ii: 0.8315, wave iii is an extended move ended at 1.0183, iv: 0.9706 and wave v has ended at 1.1081 (also the top of entire wave 5). The subsequent selloff is the major correction which is unfolding as ABC-X-ABC and 2nd A leg has ended at 0.8848, followed by a-b-c wave B which ended at 0.9758, hence, 2nd C wave is now in progress and indicated downside target at 0.7000 and 0.6950 had been met, so further fall to 0.6710-20 cannot be ruled out.
Technical Outlook: Spot Gold – Fresh Bullish Acceleration Eyes Next Target At $1337
Spot Gold extends strong bullish acceleration from Monday which resulted in eventual break above key $1300 barrier. The yellow metal received fresh boost from deteriorating geopolitical situation over North Korea that strongly increased demand for safe-haven assets.
Yesterday's close above $1300 barrier was strong bullish signal for today's fresh bullish acceleration which extended above initial target at $1315 and broke above bull-channel upper boundary at $1319, to meet next target at $1325 (Fibo 200% projection of the upleg from $1276). Bulls are eyeing next barrier at $1337(09 Sep 2016 spike high).
Strong bullish sentiment continues to drive the price higher, ignoring overbought conditions of daily studies, which suggest corrective action that could be expected in coming sessions.
Res: 1331, 1337, 1343, 1352
Sup: 1319, 1313, 1300, 1296
Technical Outlook: Fresh Strength Looks For Clear Break Above Key Fibo 61.8% Barrier At 0.7967
The Aussie dollar regained traction and recovered the most of overnight's losses, maintaining overall bullish tone. Strong two-day bullish acceleration was capped by Fibo 61.8% of 0.8065/0.7807 pullback at 0.7970 zone yesterday, with overnight's pullback triggered by North Korea news, as strong sales of AUDJPY dragged lower the AUDUSD pair. Dip was contained by the base of thickening hourly cloud which continues to underpin recovery which returned near yesterday's high and neutralized downside threats. However, break and close above Fibo barrier at 0.7967 is required to confirm bullish continuation towards 0.80000/65 targets, signaled by yesterday's break above the triangle pattern. Meanwhile, overbought slow stochastic on daily chart may trigger extended consolidation before bulls resume. Plethora of strong supports at 0.7930 zone, comprising of hourly cloud top / converged 10/30SMA's and daily Tenkan-sen, should keep the downside protected.
Res: 0.7973, 0.8000, 0.8042, 0.8065
Sup: 0.7936, 0.7927, 0.7905, 0.7864
Technical Outlook: USDJPY – Fresh weakness eyes key support at 108.11 (2017 low)
The pair fell to fresh multi-month low at 108.33 overnight, as rising geopolitical tensions put the greenback under pressure. Break below supports at 108.70/60 zone which kept downside attempts in past two weeks limited, opens way towards key med-term support at 108.11 (2017 low posted on 17 Apr). Sustained break here would generate strong bearish signal for continuation of larger downtrend from 118.66 (15 Dec 2016 peak). Strong bearish sentiment and firmly bearish technical studies are supportive for further weakness, however, hesitation ahead of 108.11 pivot could be anticipated. Daily cloud is going to twist next week and may attract for some corrective action before final push through 108.11 trigger. Former lows at 108.60/70 now act as immediate barriers, followed by falling 10SMA (109.30) and 20SMA (109.70) which should cap extended upticks.
Res: 108.70, 109.00, 109.70, 110.00
Sup: 108.11, 107.49, 107.00, 106.71
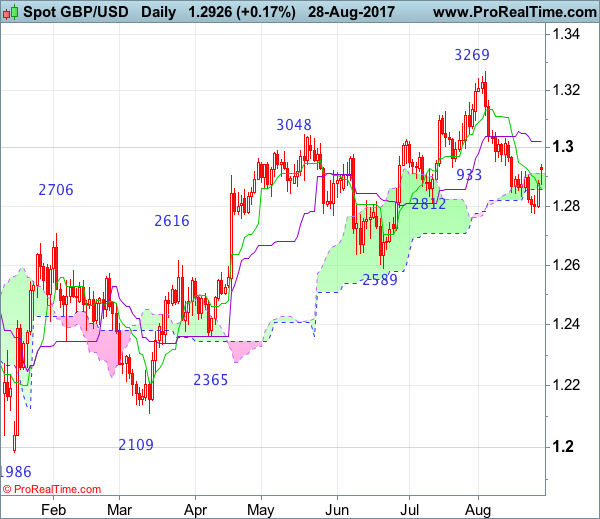
GBP/USD Candlesticks and Ichimoku Analysis
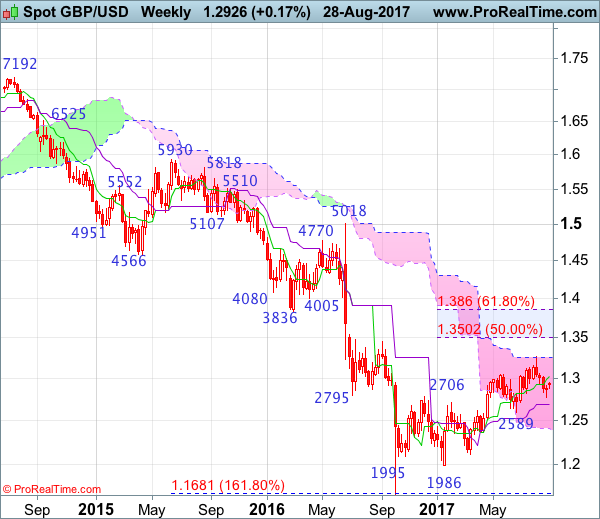
Weekly
• Last Candlesticks pattern: Long white candlestick
• Time of formation: 16 Jan 2017
• Trend bias: Down
Daily
• Last Candlesticks pattern: Long white candlestick
• Time of formation: 18 Apr 2017
• Trend bias: Near term up
GBP/USD – 1.2963
As cable found good support at 1.2774 and has staged a strong rebound, suggesting decline from 1.3269 has formed a temporary low there, hence consolidation with upside bias is seen for gain to the Kijun-Sen (now at 1.3020), however, upside should be limited to 1.3032 resistance and reckon 1.3080 (61.8% Fibonacci retracement of 1.3269-1.2774) would hold, bring retreat later to 1.2900, then 1.2870-75, having said that, said support at 1.2774 should continue to hold and bring another rebound later.
On the upside, whilst initial recovery to the Kijun-Sen (now at 1.3020) cannot be ruled out, reckon upside would be limited to 1.3050-55 and dynamic resistance at 1.3080 (61.8% Fibonacci retracement of 1.3269-1.2774) should hold, bring retreat later. A daily close above 1.3080 would risk a stronger rebound to 1.3120 and possibly towards 1.3165-70, however, we are keeping our view that a temporary top has been formed at 1.3269 earlier this month, reckon upside would be limited to 1.3200 and price should falter well below said resistance, bring another corrective decline later.
Recommendation: Sell at 1.3050 for 1.2850 with stop above 1.3150 or buy at 1.2875 for 1.3020 with stop below 1.2775.
On the weekly chart, as the British pound has rebounded on back of the rally in euro, suggesting first leg of decline from 1.3269 top has ended at 1.2774, hence initial upside bias is seen for the rebound from 1.2774 to extend gain to the Tenkan-Sen (now at 1.3021), however, reckon upside would be limited to 1.3080 (61.8% Fibonacci retracement of 1.3269-1.2774) and price should falter below 1.3165-70, bring another decline later, above there would bring a retest of 1.3269 but only break there would shift risk back to upside and extend early erratic rise from 1.1986 low to 1.3330-40 and later towards 1.3400-10.
On the downside, expect pullback to be limited to 1.2900 and cable should find renewed buying interest at 1.2873, bring another rebound later. Below 1.2800 would bring retest of 1.2774, break there would signal the fall from 1.3269 top is still in progress for retracement of recent upmove to the Kijun-Sen (now at 1.2689), however, reckon downside would be limited to previous support at 1.2589 and bring rebound later. Looking ahead, only a sustained breach below 1.2589 would signal the entire correction from 1.1986 has ended at 1.3269, bring further decline to 1.2500, then towards support at 1.2365.
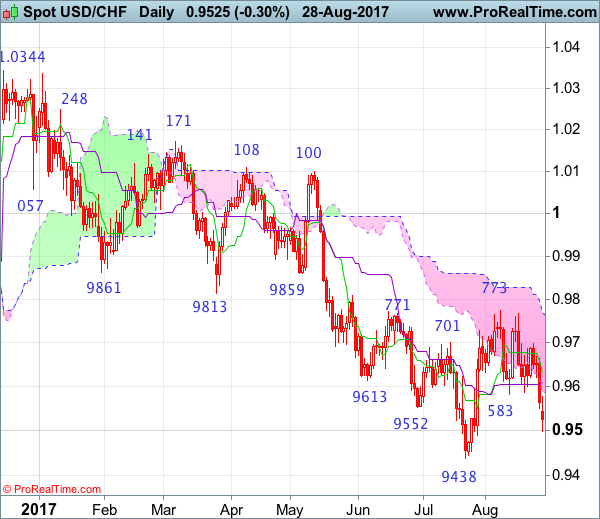
USD/CHF Candlesticks and Ichimoku Analysis
Weekly
• Last Candlesticks pattern: Shooting star
• Time of formation: 7 Mar 2017
• Trend bias: Sideways
Daily
• Last Candlesticks pattern: Morning star
• Time of formation: 9 May 2017
• Trend bias: Near term up
USD/CHF – 0.9468
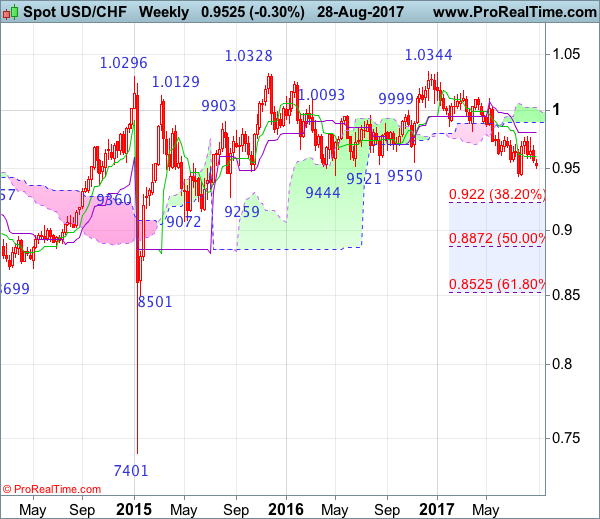
As the greenback has remained under pressure after breaking below indicated previous support at 0.9583, adding credence to our bearish view that the erratic decline from 0.9773 is still in progress, hence test of another previous support at 0.9438 would be seen, break there would signal early fall from 1.0344 (2016 high) has resumed and extend weakness to 0.9390-00, then towards 0.9330-35, having said that, near term oversold condition should prevent sharp fall below previous support at 0.9259 and reckon 0.9220 (38.2% Fibonacci retracement of entire rise from 0.7401-1.0344) would hold, risk from there is seen for a rebound to take place later.
On the upside, whilst recovery to 0.9530-40 cannot be ruled out, said previous support at 0.9583 should turn into resistance and limit dollar’s upside and bring another decline to aforesaid downside targets. Above 0.9620 would defer and risk a stronger rebound to 0.9663 and possibly test of resistance at 0.9698, however, upside should still be limited and price should falter below said resistance at 0.9773, bring another selloff next month.
Recommendation: Sell at 0.9520 for 0.9320 with stop above 0.9620
On the weekly chart, the greenback opened lower this week after breaking below previous support at 0.9583, suggesting the erratic decline from 1.0344 top has resumed and break of another previous support at 0.9438 would confirm and extend the aforesaid fall for further weakness to 0.9350, then towards previous support at 0.9259, however, near term oversold condition should prevent sharp fall below 0.9220 (38.2% Fibonacci retracement of 0.7401-1.0344) and reckon 0.9150 would hold from here, risk from there is seen for a rebound later.
On the upside, expect recovery to be limited to 0.9530-40 and said previous support at 0.9583 should turn into resistance and limit upside. A weekly close above the Tenkan-Sen (now at 0.9606) would defer and risk a stronger recovery to 0.9698 resistance, however, still reckon upside would be limited and resistance at 0.9773 should remain intact, bring another decline. Only a break of the Kijun-Sen (now at 0.9805) would abort and signal a temporary low is formed instead, bring a stronger rebound to the lower Kumo (now at 0.9894) but upside should be limited to the upper Kumo (now at 1.0023), price should falter well below resistance at 1.0100.