Sample Category Title
AUD/USD Throwback
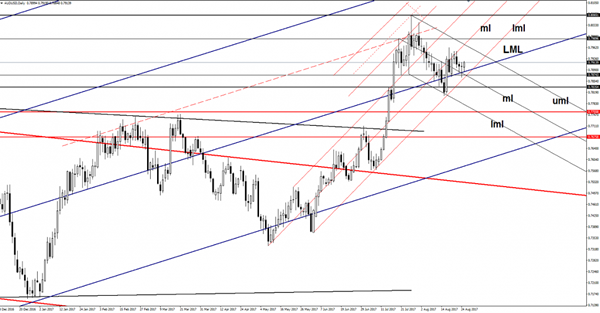
AUD/USD climb higher after the retest of the lower median line (LML) of the major ascending pitchfork and now is targeting the upper median line (uml) of the minor descending pitchfork. Technically should jump much higher after the failure to close on the LML. Only the fundamental factors will send it below the dynamic support.
USD/CAD Losing Altitude
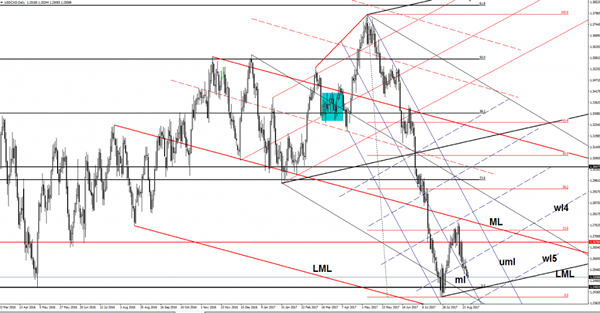
Price continues to drop and is expected to reach the major confluence area formed by the 1.2460 static support with the lower median line (LML) of the major black ascending pitchfork. It slips lower along the median line (ml) of the minor descending pitchfork, signaling that the bears are in full control.
EUR/USD Bloodless
Price changed little today and waiting to the afternoon's fundamental events to bring some volatility. Is still located in the buyer's territory, but needs a bullish spark to be able to resume the upside movement. Continues to move somehow sideways right now, is consolidating the latest gains, so we have to wait for a fresh trading signal.
Has shown some exhaustion signs in the last weeks, but maintains a bullish perspective as is located above some important support levels. We may have a high volatility in the afternoon as the economic calendar is filled with high impact data. The fundamental factors will take the lead, so you should be careful not to suffer a heavy loss.
The German Ifo Business Climate will be sent to the public earlier and is expected to drop from 116.0 to 115.0 points, while the German Final GDP could increase by 0.6%, matching the 0.6% growth in the former reading period.
The Yellen's and Draghi's speeches will shake the markets, remains to see how the EUR/USD will react, that's why will be better to stay away tonight.
Price hovers above the 1.1712 major static support, but failed to retest the upper median line (uml), signaling that could come down to retest the median line (ml) of the ascending pitchfork. The perspective remains bullish despite the minor retreat, should climb towards new peaks as long as the median line (ml) and the ML are intact.

FX Market Is Quiet Ahead Of Jackson Hole
Jackson Hole to be a non-event
After a soft start yesterday evening with comments from Fed’s George and Kaplan, who took opposite side about the highly discussed inflation issue, Janet Yellen and Mario Draghi will have the opportunity to present their views. We anticipate that Janet Yellen won’t take any risk and should come with a rather neutral stance, meaning that she’ll leave the door open for a tightening move before the end of the year, while at the same time maintaining a cautious tone in response to weak price pressures. However, keep in mind that the Fed Chair will talk about financial stability, which give her plenty of room to avoid any hot topic. There is great chance is will be a non-event.
However, Mario Draghi will have the difficult task to talk down the euro, which has surged substantially over the last weeks - the single currency reaching 1.1910 against the USD on August 2nd before stabilising at around 1.17 - while preparing the market for the end of the ECB’s quantitative programme. Indeed, the ECB’s September meeting is just around the corner and Draghi won’t have much opportunity to prepare at best investors.
The bottom line is that we expect the Jackson Hole Symposium to have much effect on the EUR and USD crosses. EUR/USD continues to trade within the 1.1662-1.1910 range. We still believe that maintaining a downside bias is the best choice.
Technical Outlook: AUDUSD Holding Within Triangle Ahead Of JH Speeches
Repeated strong rejection at 0.7867 (Fibo 61.8% of 0.7807/0.7962 upleg) on Friday and subsequent quick bounce suggests very strong support. In addition, two attempts below daily Tenkan-sen (0.7885) failed to close below, signaling that near-term pullback from 0.7962 (17 Aug high) might be running out of steam.
Near-term action is holding in triangular pattern (upper boundary at 0.7933, reinforced by daily Kijun-sen and lower at 0.7867) with break of either side needed to generate firmer direction signal.
Top at 0.7962 marks next pivotal barrier, violation of which would open way for fresh attempts through 0.8000. On the downside, loss of strong 0.7867 support would risk retest of key n/t support at 0.7807 (15 Aug correction low), reinforced by the top of rising daily cloud.
Res: 0.7920, 0.7933, 0.7950, 0.7962
Sup: 0.7885, 0.7867, 0.7832, 0.7807
All Eyes On Jackson Hole
US futures are flat ahead of the open on Friday, in keeping with moves seen elsewhere in the markets as we await comments from two of the world’s most influential central bankers later on in the session.
The Jackson Hole Symposium is widely regarded as one of the most notable annual events, not only because of the speakers it attracts but also because it has been used as a platform to warn of upcoming policy announcements. In the past it has been Janet Yellen’s predecessors – Alan Greenspan and Ben Bernanke - that have delivered such warnings, the question today is whether she will do the same.
The final months of the year are going to be very interesting as far as the Fed and the ECB are concerned which makes today’s appearances from Fed Chair Yellen and ECB President Mario Draghi all the more interesting. Both central banks have started the process of tightening monetary policy, although the ECB would probably claim it’s more a case of removing accommodation. Either way, with the process underway, investors are keen to know what they plan next.
The Fed is already well underway with its rate hikes, having started almost two years ago and having raised three more times since (so four in total). With inflation still lagging well below target though, there is growing unease within the central bank about whether the current pace is appropriate. Investors have long been unsure that there’ll be another rate hike this year and the message seems to finally be filtering through to the Fed. It will be interesting to see whether Yellen will address this today or instead focus on balance sheet reduction, which is expected to be announced in September and doesn’t interest investors in the same way.
The ECB is taking a far more cautious approach having dealt with a far more severe crisis for the last decade, one that the region is only just starting to truly recover from. The central bank announced one reduction on asset purchases last December and it’s expected to announce another in the coming months. While investors are desperate to get more information on this, I think it’s highly unlikely given the ECBs unease at past market reactions. I think the central bank will prefer to address this after the meeting next month on home turf and won’t want to risk further tightening of financial conditions in the meantime, with the euro having already sharply appreciated this year.
Yen Inches Down As Inflation Pressure Remains Weak In Japan
According to the Ministry of International Affairs and Communications, Japanese core inflation continued rising steadily for the seventh consecutive month in July. However, the measure remained weak, as anticipated, far away from the Bank of Japan’s (BOJ) 2% target, reducing chances for a rate hike anytime soon. Consequently, the yen retreated slightly against its US counterpart during the Asian trading hours.
As analysts projected, for the month of July, headline consumer prices in Japan picked up by 0.4% y/y for the fourth consecutive month.
Excluding fresh food items, the core CPI index improved in line with forecasts by 0.1 percentage points to 0.5% y/y, recording the highest growth since April 2015 and gaining for the seventh straight month. Though it remained below 2015 levels when the index was above the 2% target before the massive earthquake of a magnitude of 8.5 (Richter scale) hits the country. Barring energy products as well, the index posted its first growth in five months, increasing by 0.1% y/y.
Food prices were up by 0.6% y/y (-0.3% m/m, seasonally adjusted), while fuel, light and water charges increased the most, jumping by 4.3% y/y (0% m/m, seasonally adjusted).
In Tokyo, the flash CPI index for the month of August, experienced the highest increase since 2016, hinting that nationwide inflation to be released next month might elevate. The index rose surprisingly by 0.4 percentage points to 0.5% y/y, exceeding the forecast of 0.3%. Core CPI came in better than expected as well at 0.4% y/y. This was above the forecast of 0.3% and July’s mark of 0.2%.
While the Japanese economy picked up speed in the second quarter, with GDP growing substantially from 0.4% to 1.0% and household and business spending showing signs of improvement, companies still felt hesitant to raise prices. They were also reluctant to increase wages as they believe that the recent economic pickup might be temporary. Hence, taking all this into account, the decision of the BOJ in July to downgrade its inflation forecasts for the next two years is justified together with the projections that the BOJ will likely stick to its current ultra-easy policy during its next meeting on September 20. Note that the BOJ expects inflation to touch its 2% target in the fiscal year to March 2020 as it anticipates that gradual developments in the labor market will boost prices.
Looking at the reaction in the forex markets, the yen fell immediately by 0.20% relative to the dollar, with dollar/yen climbing from 109.51 prior the data release to a session high of 109.71. However, the pair edged down afterwards, last trading at 109.64.
Markets Turn To Yellen And Draghi For Guidance
Today, all eyes will be on two highly-anticipated speeches by Fed Chair Janet Yellen and ECB President Mario Draghi at Jackson Hole. Kicking off with Yellen, her speech will center on financial stability. Even though the subject suggests she may refrain from commenting on interest rates, she could always make a reference to the outlook of the US economy that indirectly conveys her policy view. Should she echo recent comments from Fed’s Dudley, who still favors another rate hike this year, markets could reprice the probability for such action, which now rests at only 39% according to the Fed funds futures. This could help the dollar recover some of its latest losses.
USD/JPY edged north after it found support once again near the 108.70 (S1) obstacle. Nevertheless, the rate found again resistance at 109.75 (R1) and retreated somewhat. The pair has been oscillating between 108.70 (S1) and 111.00 (R3) since the 28th of July and therefore, the short-term path remains sideways. Having said that, given that the latest recovery started from near the lower bound of the range, we see the case for the pair to continue trading higher. Yellen’s speech today could be the catalyst for further advances. A break above 109.75 (R1) could set the stage for more bullish extensions, perhaps towards our next resistance level of 110.35 (R2).
As for the bigger picture, the pair continues to trade within the broader range between 108.70 (S1) and 114.40. This keeps the medium-term outlook flat as well, and enhances the case for further recovery within the range. Nevertheless, we will keep an eye on a potential US government shutdown, increased speculation around which could bring the pair under renewed selling interest in coming weeks. In our view, a clear close below the key support zone of 108.70 (S1) is needed to turn the medium-term picture back negative.
Turning to Draghi, even though media reports familiar with 'ECB sources' suggest he is unlikely to deliver a new policy message, we believe investors will still be hanging on his lips for any hints on policy and/or the euro. That said, we think that any such remarks are unlikely to deviate from the communication at the latest ECB press conference. Back then, Draghi was explicit in stating that the conversation regarding changes to QE will take place in the 'autumn', suggesting he is highly unlikely to preannounce anything at a non-monetary policy meeting, especially if he doesn’t have the blessings of the Governing Council.
As such, we view the risks surrounding the euro today as being tilted to the downside. Investors looking for a preemptive QE-tapering announcement could be left disappointed, and Draghi could even mention the risk of future exchange rate appreciation as we saw in the latest ECB minutes, both of which could weigh on the currency.
On the other hand, if he doesn’t talk about the euro at all, this may signal that the Bank is not so worried about the currency. In this case, we could even see a relief rally, as traders get the 'green light' to renter long-EUR positions. On balance though, we think this is a lower-probability outcome than the above.
EUR/USD traded in a consolidative manner yesterday, staying slightly below the key resistance of 1.1830 (R1), which appears to be the upper bound of the sideways range the pair is trading within since the 4th of August, the lower bound of which is at 1.1660 (S2). Bearing in mind that the pair is still within this range, we consider the near-term outlook to be flat for now. Having said that though, we see the likelihood for a slide within the range, especially if Draghi appears concerned about the prospect of future euro appreciation. We expect such a slide to challenge the 1.1730 (S1) support, and if the bears are strong enough to overcome it, we believe that there is the prospect for extensions towards the 1.1660 (S2) barrier.
Switching to the daily chart, we still see a longer-term uptrend. The price structure remains higher peaks and higher troughs above the uptrend line taken from the low of the 17th April. As such, we would treat any possible slide on Draghi’s remarks today as a corrective move of that longer-term upside path. We believe that we are likely to see the resumption of the existing trend in coming weeks, given that the ECB remains set to announce QE changes soon. Although fresh data could be a game-changer, we think that a realistic scenario is one where the Bank removes it QE bias in September, thereby paving the way for an announcement in October that the pace of asset purchases may be reduced by the turn of the year.
As for today’s economic data:
We get Germany’s Ifo survey for August and US durable goods orders for July. However, there releases are very likely to be overshadowed by the aforementioned Jackson Hole speeches
EUR/USD
Support: 1.1730 (S1), 1.1660 (S2), 1,1590 (S3)
Resistance: 1.1830 (R1), 1.1900 (R2), 1.1980 (R3)
USD/JPY
Support: 108.70 (S1), 108.00 (S2), 107.40 (S3)
Resistance: 109.75 (R1), 110.35 (R2), 111.00 (R3)
EUR/JPY Elliott Wave Analysis
EUR/JPY - 129.38
Despite falling to 127.56 late last week, as the greenback found good support there and has rebounded throughout this week, suggesting consolidation above this level would be seen and gain to 129.50-60 and possibly 130.00 cannot be ruled out, however, only a daily close above resistance at 130.40 would signal the retreat from 131.40 has ended instead, risk a stronger rebound to 130.80-85 but price should falter below 131.40, bring another leg of corrective decline later this month. Only above said resistance at 131.40 would extend medium term upmove from 109.49 low (2016 low) to extend further gain to 132.00-10, however, overbought condition should prevent sharp move beyond 132.90-00 (1.236 times projection of 109.49-124.10 measuring from 114.85) and price should falter well below previous chart resistance at 134.59.
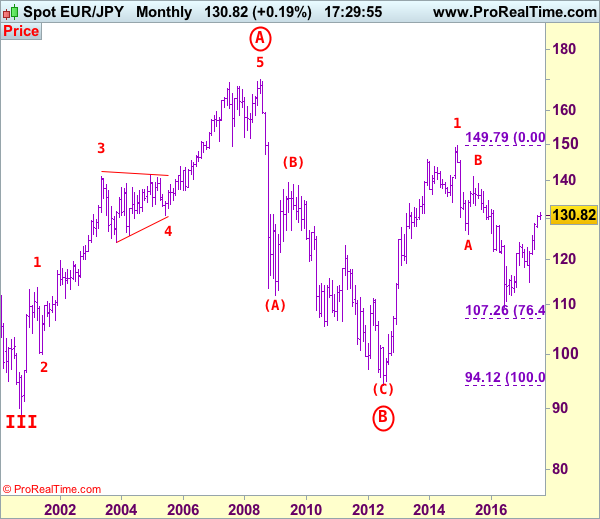
The daily chart is labeled as attached, early selloff from 169.97 (July 2008) to 112.08 is wave (A) of B instead of end of entire wave B and then the rebound from there to 139.26 is wave (B), hence, wave (C) has possibly ended at 94.12 with a diagonal triangle as labeled in the daily chart, hence upside bias is seen for further gain. Recent rally above indicated retracement level at 116.69 (50% Fibonacci retracement of the intermediate fall from 139.26-94.12) adds credence to this view and signal major reversal has commenced but first leg of this wave C has possibly ended at 149.79, hence wave 2 has commenced with wave A ended at 126.09, followed by wave B at 141.06, wave C commenced and could have ended at 109.49, above 126.00 would add credence to this view, then headway to 130.00 would follow.
On the downside, expect pullback to be limited to 128.45-50 and bring another rebound. Below 128.30-35 would risk test of 127.80-85 but break there is needed to signal the rebound from 127.56 has ended instead, bring another test of this level. Once this support is penetrated, this would revive our near term bearishness for the corrective fall from 131.40 top to bring retracement of recent upmove to 127.44 support, then 126.85-90 (50% Fibonacci retracement of 122.38-131.40), however, only a break of latter level would provide confirmation that temporary top has been formed at 131.40, bring further fall to 126.45-50. Having said that, price should stay above previous resistance at 125.82 (now support) and euro may head north again from there. \
Recommendation: Stand aside for this week.
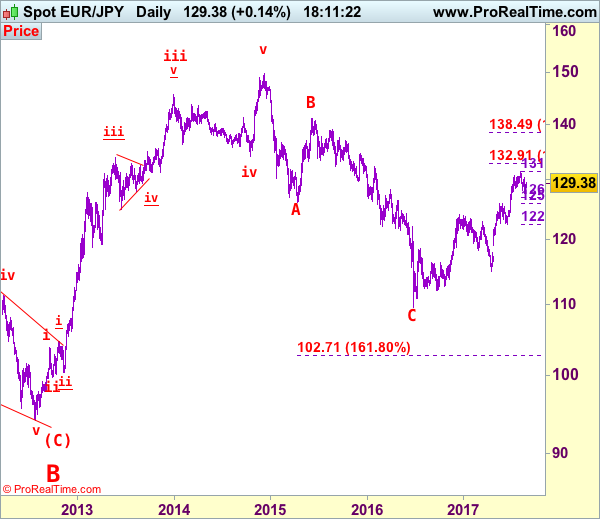
To re-cap the corrective upmove from the record low of 88.93 (18 Oct 2000), the wave A from there is subdivided as: 1:88.93-113.72, 2:99.88 (1 Jun 2001), 3:140.91 (30 May 2003), 4:124.17 (10 Nov 2003) and 5 ended at record high of 169.97 (21 Jul 2008). The brief but sharp selloff to 112.08 is viewed as a-b-c x a-b-c wave (A) of B. The subsequent rebound to 139.26 is (B) of B and (C) of (B) has possibly ended at 94.12 and in any case price should stay well above previous chart support at 88.93, bring rally in larger degree wave C towards 150.00.
USD/CHF Elliott Wave Analysis
USD/CHF – 0.9635
As the greenback retreated again after faltering below indicated resistance at 0.9773, retaining our view that further consolidation would be seen and although initial downside risk is for weakness to 0.9583 support, as early strong rebound from 0.9438 to 0.9773 signals a temporary low has possibly been formed at 0.9438, reckon downside would be limited to 0.9540-50 and bring another rebound later. Above 0.9700 would bring another bounce to 0.9773 resistance but break there is needed to add credence to this view and extend the rebound from 0.9438 low for further gain to 0.9845-50 (61.8% Fibonacci retracement of 1.0100-0.9438) but reckon upside would be limited to 0.9890-00 and price should falter well below psychological resistance at 1.0000.
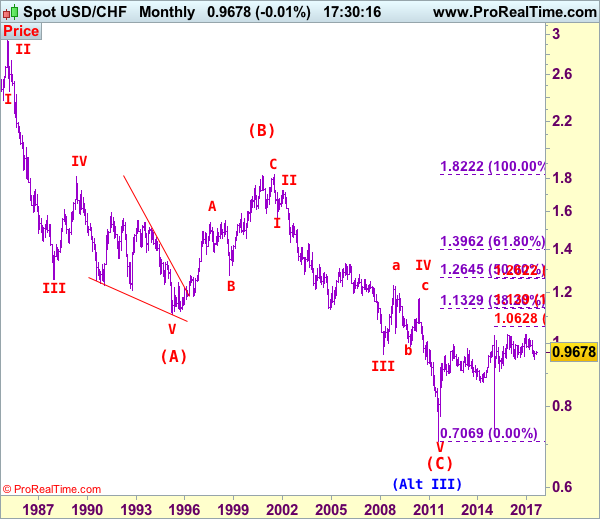
Our preferred count on the daily chart is that early selloff to 0.9630 is an end of the larger degree wave III and major correction is unfolding from there with a leg ended at 1.2298 (Nov 2008 with (a): 1.0625, (b):1.0011 and (c):1.2298), wave b ended at 0.9910 with (a): 1.0370, (b): 1.1967, (c): 0.9910. The rise from there to 1.1730 is the wave c which also marked the end of wave IV and wave V has possibly ended at 0.7068.
On the downside, whilst initial pullback to 0.9580-85 cannot be ruled out, reckon 0.9550-55 would limit downside and bring another rebound to aforesaid upside targets. Only a drop below said recent low at 0.9438 would revive bearishness and signal the erratic decline from 1.0344 top (formed back in late 2016) is still in progress and downside bias remains for this move to extend weakness to 0.9390-00, however, loss of downward momentum should prevent sharp fall below 0.9300-10, risk from there has increased for a rebound to take place probably later.
Recommendation: Buy at 0.9555 for 0.9755 with stop below 0.9455
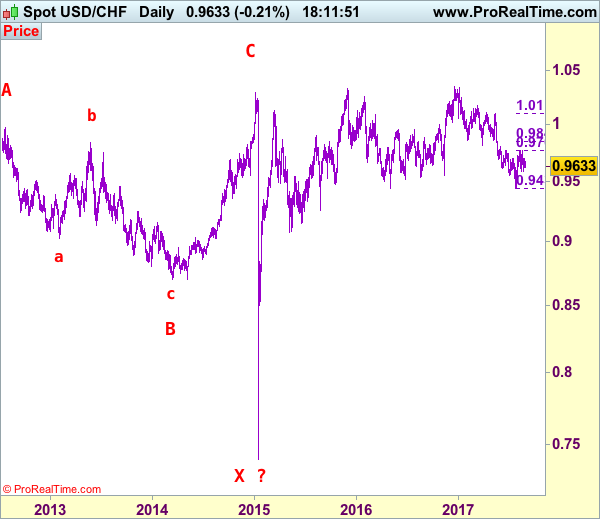
Dollar's long-term downtrend started from 2.9343 (Feb 1995) and it was unfolding as a (A)-(B)-(C) with (A): 1.1100, (B): 1.8310 (26 Oct 2000), then followed by another impulsive wave (C) with wave III ended at 0.9630 (Mar 2008). Under this count, correction in wave IV has possibly ended at 1.1730 and wave V already broke below support at 0.9630 and met indicated downside target at 0.7500 and 0.7400. The reversal from 0.7068 suggests the wave V has possibly ended and the breach of resistance at 0.9595 add credence to this view and indicated upside target at 1.0000 had been met, however, the sharp retreat from 1.0296 to 0.7401 suggests choppy trading would be seen but price should stay above said record low at 0.7068.