Sample Category Title
GBP/USD Could Buyers Take It Higher?
GBP/USD Posted little gains today and needs a spark to be able to start another bullish momentum. Is trading in the green right, but looks undecided. I hope that we'll have a trading opportunity very soon because looks like that the USD will decrease a little on the short term.
Price could increase as the USDX may slip lower in the upcoming days, the index is trading right below the 93.50 psychological level and could resume the Friday's bearish candle. USDX remains under pressure as long as stays below the 93.81 static resistance, it could come down to recapture more directional energy before will start another bullish momentum.
The Cable increased today, even if the United Kingdom Rightmove HPI dropped by 0.9% in August, versus a 0.1% growth in the previous reading period.
Price narrows on the short term right on the upper median line (ML) of the major descending pitchfork, only a retest of this dynamic support will signal another leg higher. Is premature to say that we'll really have a bullish momentum until will come to retest also the 1.2798 static support.
Support can be found at the second warning line (wl2) of the minor ascending pitchfork. We may have a sideways movement above the 1.2798 level in the upcoming period before we'll have a clear direction.
A further retreat will be confirmed only after a valid breakdown below the 1.2798 static support, this scenario will take shape only if the USDX will breakout above the 93.81 static resistance.
Gold Setting Up For More Gains
Price has come down to retest the 38.2% retracement level, a minor consolidation here will attract more buyers, which will lead the rate towards new highs. We had a false breakout above the 23.6% retracement level and above the $1295 per ounce.
Is still trapped within a sideways movement, only a valid breakout from this range will confirm a major increase towards the lower median line (LML) of the ascending pitchfork.
Brent Oil Bounce Or Break?
Price dropped sharply after the retest of the 53.03 static resistance, however, a breakout is favored after the Friday's impressive rally. Brent Oil is facing a tough resistance area, resistance can be found at the 61.8% retracement level and higher at the warning line (wl1) as well.
Only a breakout above these levels will send the rate towards the median line (ML) of the major ascending pitchfork.
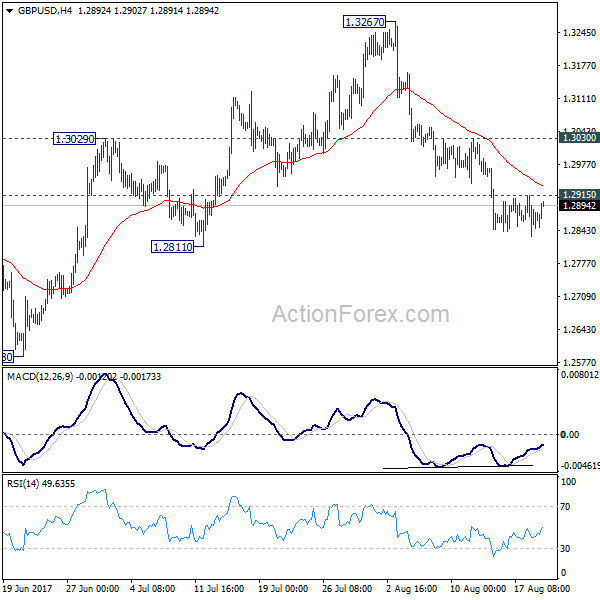
GBP/USD Mid-Day Outlook
Daily Pivots: (S1) 1.2830; (P) 1.2873; (R1) 1.2916; More...
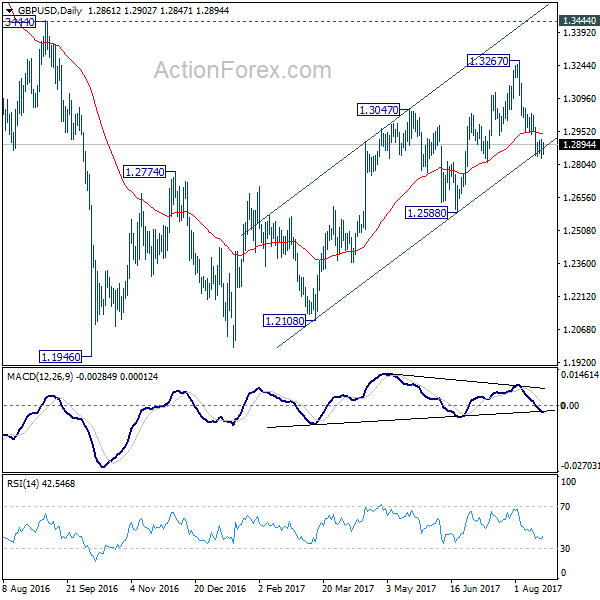
With 1.2915 minor resistance intact, intraday bias in GBP/USD stays on the downside. Current fall from 1.3267 should target 1.2588 key near term support. We're favoring the case that correction from 1.1946 is completed at 1.3267. Decisive break of 1.2588 will confirm our view and target a test on 1.1946 low. On the upside, above 1.2915 minor resistance will turn intraday bias neutral first. But near term outlook will remains cautiously bearish as long as 1.3030 resistance holds.
In the bigger picture, overall, price actions from 1.1946 medium term low are seen as a corrective pattern. While further rise cannot be ruled out, larger outlook remains bearish as long as 1.3444 key resistance holds. Down trend from 1.7190 (2014 high) is expected to resume later after the correction completes. And break of 1.2588 will indicate that such down trend is resuming.
USD/CHF Mid-Day Outlook
Daily Pivots: (S1) 0.9600; (P) 0.9634; (R1) 0.9683; More...
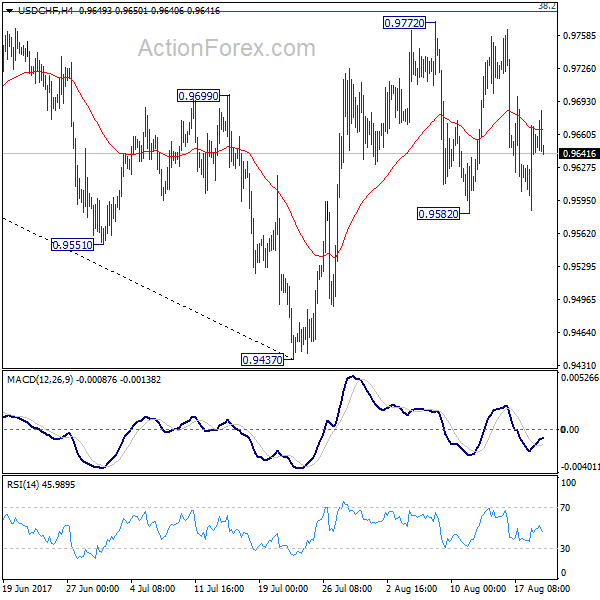
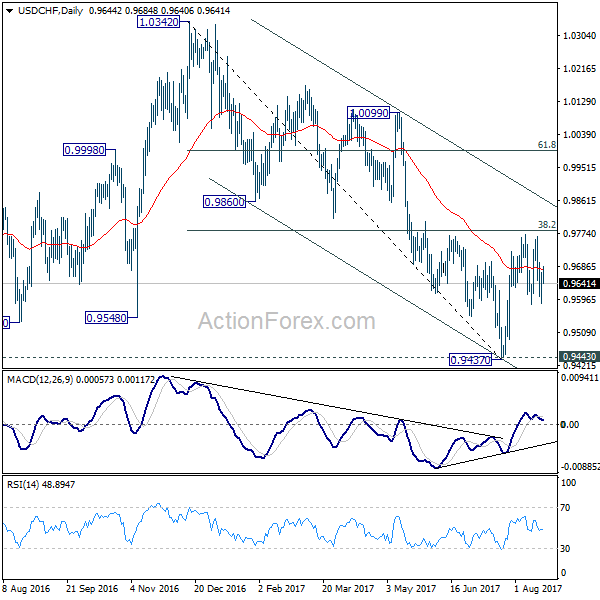
Intraday bias in USD/CHF remains neutral at this point as sideway trading continues. On the upside, decisive break of 0.9772 resistance will revive the bullish case of reversal. That is, whole decline from 1.0342 has completed at 0.9437 after defending 0.9443 support. USD/CHF should then target channel resistance (now at 0.9862) next. Meanwhile, the pair is bounded inside medium term falling channel and limited below 38.2% retracement of 1.0342 to 0.9437 at 0.9783 for the moment. Break of 0.9582 will turn bias back to the downside for 0.9437. This could also extend the fall from 1.0342 through 0.9437/43 key support level.
In the bigger picture, we're slightly favoring the case that USD/CHF has successfully defended 0.9443 key support level. And long term range trading in 0.9443/1.0342 is extending with another rise. At this point, there is no sign of an up trend yet. Hence, while further rise is expected in USD/CHF, we'll start to be cautious on loss of momentum above 61.8% retracement of 1.0342 to 0.9437 at 0.9996. However, firm break of 0.9443 will carry larger bearish implication and would target next key support at 0.9072.
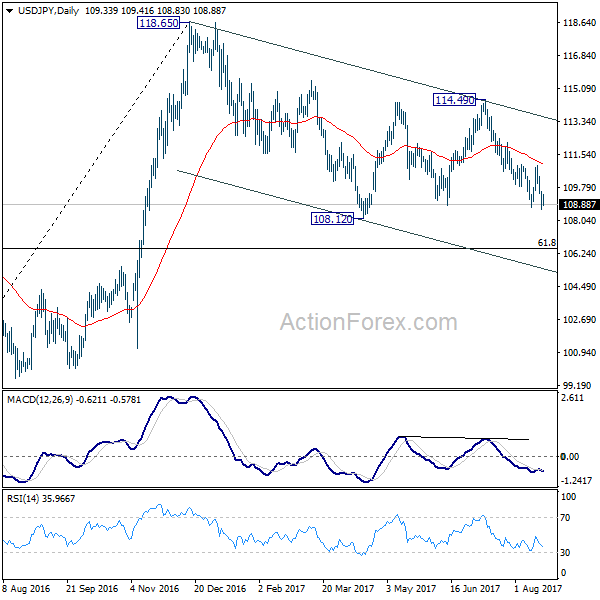
USD/JPY Mid-Day Outlook
Daily Pivots: (S1) 108.66; (P) 109.13; (R1) 109.65; More...
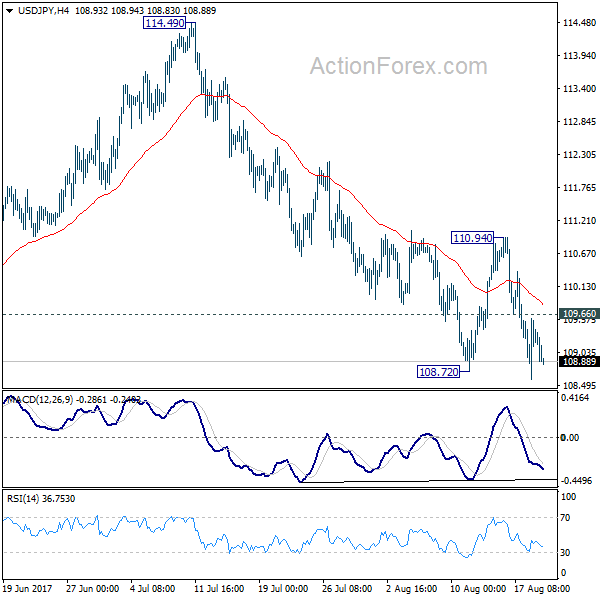
Intraday bias in USD/JPY remains mildly on the downside for the moment as fall from 114.49 is resuming. Such decline would target a test on 108.12 low. Whole corrective decline from 118.65 is possibly resuming and break of 108.12 will target 61.8% retracement of 98.97 to 118.65 at 106.48. On the upside, above 109.66 minor resistance will turn intraday bias neutral first. But break of 110.94 is needed to indicate short term bottoming. Otherwise, outlook remains bearish in case of recovery.
In the bigger picture, the corrective structure of the fall from 118.65 suggests that rise from 98.97 is not completed yet. Break of 118.65 will target a test on 125.85 high. At this point, it's uncertain whether rise from 98.97 is resuming the long term up trend from 75.56, or it's a leg in the consolidation from 125.85. Hence, we'll be cautious on topping as it approaches 125.85. If fall from 118.65 extends lower, downside should be contained by 61.8% retracement of 98.97 to 118.65 at 106.48 and bring rebound.
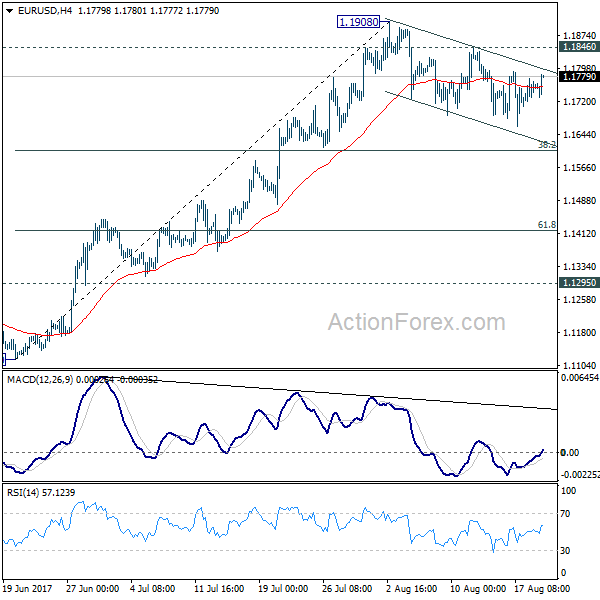
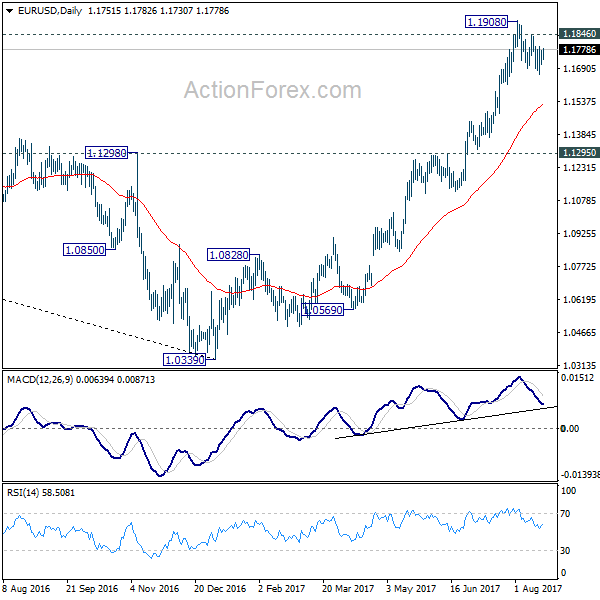
EUR/USD Mid-Day Outlook
Daily Pivots: (S1) 1.1719; (P) 1.1746 (R1) 1.1786; More...
EUR/USD recovers mildly today but stays below 1.1846 minor resistance. Intraday bias in EUR/USD remains neutral as consolidative pattern from 1.1908 might extend. In case of another fall, downside should be contained by 38.2% retracement of 1.1119 to 1.1908 at 1.1606 to bring up trend resumption. Break f 1.1846 minor resistance will argue that larger rise from 1.0339 is resuming for 1.2042 long term support turned resistance next.
In the bigger picture, an important bottom was formed at 1.0339 on bullish convergence condition in weekly MACD. Sustained trading above 55 month EMA (now at 1.1768) will pave the way to key fibonacci level at 38.2% retracement of 1.6039 (2008 high) to 1.0339 (2017 low) at 1.2516. While rise from 1.0339 is strong, there is no confirmation that it's developing into a long term up trend yet. Hence, we'll be cautious on strong resistance from 1.2516 to limit upside. But for now, medium term outlook will remain bullish as long as 1.1295 support holds, in case of pull back.
Euro’s Rally Attempt Limited by Cautiousness ahead of Jackson Hole
Euro is trying to reverse from initial dip today but buying is so far limited. Traders are getting cautious ahead of ECB President Mario Draghi's speech in the Jackson Hole symposium. There were media reports last week that Draghi won't delivery anything outside of the topic of the symposium, that is, "Fostering a Dynamic Global Economy". And it's also clear that ECB will wait for more economic data, especially on inflation, and discuss policy change in the September meeting. Hence, some analysts argue that Euro could indeed be lifted if Draghi meets this expectation by saying nothing. But of course, what Fed chair Janet Yellen delivers is another big factor for both Dollar and Euro. Markets are generally not convinced that Fed is going to hike again in December. The greenback could be given a lift instead and drag the Euro down if Yellen shows no concern over recent tame inflation reading.
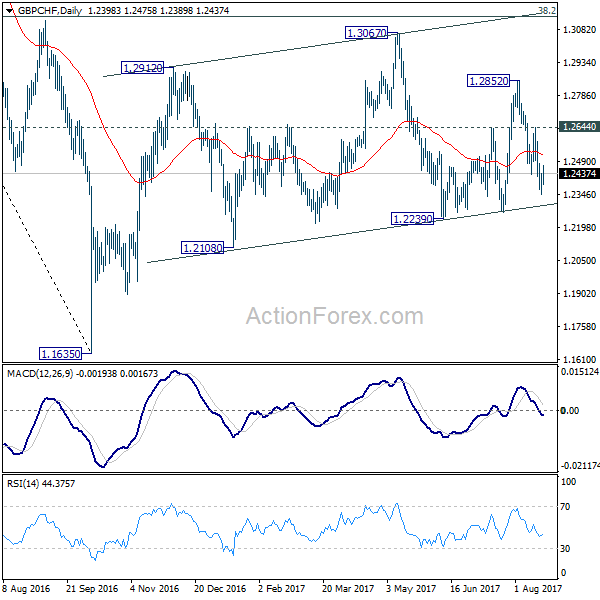
In the global stock markets, European indices are trading lower with both DAX and CAC down more than -0.3%. FTSE is hovering around break even. US futures also point to flat open. Risk aversion in a dominant theme this month, on White House turmoil, Korea tension, terrorist attacks. Yen and Swiss Franc are the main beneficiaries while Sterling suffers most. GBP/CHF's sharp fall from this month's high from 1.2852 to as low as 1.2346 is a clear example. Risk will stay on the downside as long as 1.2644 resistance holds, with focus on 1.2339. As price actions from 1.1635 are clearly corrective looking, break of 1.2239 will very likely bring deeper fall to retest last year's low at 1.1635.
UK's Unrealistic Customs Proposal Might Delay Brexit Negotiations.
Talking about weakness in Sterling, the upcoming round of Brexit negotiation with EU on August 29 will be a focus to watch later. Last week, the UK government, facing criticisms of its lacking preparation, released the policy papers on future customs arrangements, and Northern Ireland and the border with Ireland. The UK's positions, in particular the customs arrangements, triggered criticisms and are expected to delay the completion of the first phase negotiation, limiting the time for the second phase (trade issues). British pound has remained under pressure recently, with GBPUSD hovering around a one-month low and EURGBP firming around the highest levels in 10 months. More in UK's Unrealistic Customs Proposal Might Delay Brexit Negotiations.
Economists expected Cohn as front-runner to replace Yellen
In US, there are some findings from a survey by the National Association for Business Economics, polled 184 economists from July 18 to August 2. Only 17% expected Fed Chair Janet Yellen would be offered a second term when the current four-year term ends next February. 67% expected that Yellen will be replaced while 16% don't know. Among the contenders, 49% expect White House economic adviser Gary Cohn would be picked for the top Fed job. That's a wide margin from former Fed Governor Kevin Warsh's 9% as second. However, it should be noted that the survey was done way before US President Donald Trump's controversial remarks on the Charlottesville clash between Neo Nazi and counter protestors. Cohn was rumored to quite White House last week but denied.
The same survey showed that the respondents are "quite pessimistic about prospects for 'meaningful, revenue-neutral tax reform' in the near term." The survey showed only 10% chance of such legislation this year and 15% chance in 2018. Meanwhile, over 50% said Trump's tax reform will eventually add less than 1% to real GDP growth over the next decade. A third said that impact would be between 1-2%.
Regarding Fed's unwinding of balance sheet, 41% expect 10 year yield to rise by just 0.5% or less. 25% expect the jump in yield to be 0.75%-1.00%. NABE President Stuart Mackintosh noted that "the overall view of the panel is that the likely interest-rate impact of the Federal Reserve's balance sheet normalization is fairly benign."
On the data front
Canada wholesale sales dropped -0.5% mom in June versus expectation of -0.2% mom. UK Rightmove house price index dropped -0.9% mom in August. Japan all industry activity index rose 0.4% mom in June, in line with expectations.
EUR/USD Mid-Day Outlook
Daily Pivots: (S1) 1.1719; (P) 1.1746 (R1) 1.1786; More...
EUR/USD recovers mildly today but stays below 1.1846 minor resistance. Intraday bias in EUR/USD remains neutral as consolidative pattern from 1.1908 might extend. In case of another fall, downside should be contained by 38.2% retracement of 1.1119 to 1.1908 at 1.1606 to bring up trend resumption. Break f 1.1846 minor resistance will argue that larger rise from 1.0339 is resuming for 1.2042 long term support turned resistance next.
In the bigger picture, an important bottom was formed at 1.0339 on bullish convergence condition in weekly MACD. Sustained trading above 55 month EMA (now at 1.1768) will pave the way to key fibonacci level at 38.2% retracement of 1.6039 (2008 high) to 1.0339 (2017 low) at 1.2516. While rise from 1.0339 is strong, there is no confirmation that it's developing into a long term up trend yet. Hence, we'll be cautious on strong resistance from 1.2516 to limit upside. But for now, medium term outlook will remain bullish as long as 1.1295 support holds, in case of pull back.
Economic Indicators Update
| GMT | Ccy | Events | Actual | Forecast | Previous | Revised |
|---|---|---|---|---|---|---|
| 23:01 | GBP | Rightmove House Prices M/M Aug | -0.90% | 0.10% | ||
| 4:30 | JPY | All Industry Activity Index M/M Jun | 0.40% | 0.40% | -0.90% | -0.80% |
| 12:30 | CAD | Wholesale Sales M/M Jun | -0.50% | -0.20% | 0.90% | 1.00% |
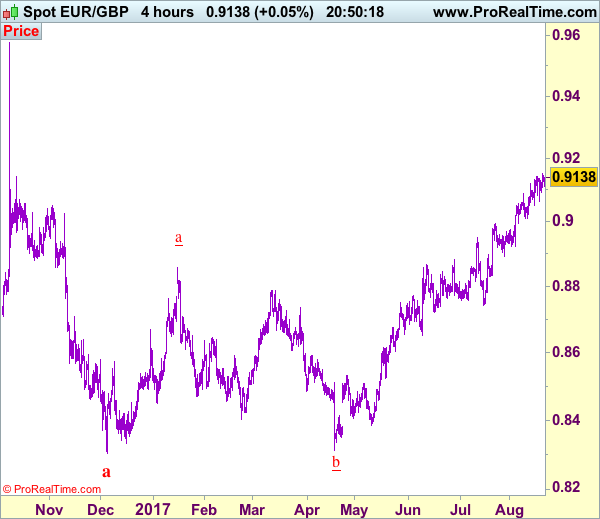
Trade Idea: EUR/GBP – Buy at 0.9000
EUR/GBP - 0.9136
Original strategy :
Buy at 0.9000, Target: 0.9130, Stop: 0.8960
Position : -
Target : -
Stop : -
New strategy :
Buy at 0.9000, Target: 0.9130, Stop: 0.8960
Position : -
Target : -
Stop : -
Although the single currency has maintained a firm undertone and bullishness remains for recent upmove to extend further gain to 0.9160, weakening of near term upward momentum should prevent sharp move beyond 0.9180-85 and price should falter below 0.9200, risk from there has increased for a retreat to take place later.
In view of this, would not chase this rise here and would be prudent to buy euro on subsequent pullback as 0.9000-05 would limit downside. Below 0.8960-70 would defer and suggest a temporary top is possibly formed, bring correction to 0.8922 support which is likely to hold from here.
Our preferred count is that, after forming a major top at 0.9805 (wave V), (A)-(B)-(C) correction is unfolding with (A) leg ended at 0.8400 (A: 0.8637, B: 0.9491 and 5-waver C ended at 0.8400. Wave (B) has ended at 0.9413 and impulsive wave (C) has either ended at 0.8067 or may extend one more fall to 0.8000 before prospect of another rally. Current breach of indicated resistance at 0.9043 confirms our view that the (C) leg has ended and bring stronger rebound towards 0.9150/54, then towards 0.9240/50.
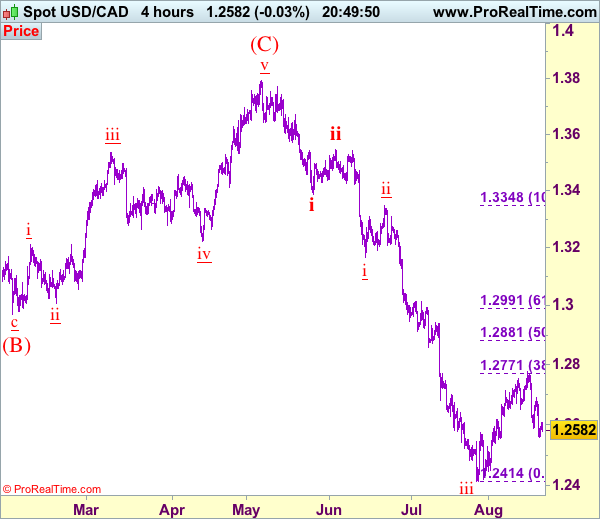
Trade Idea: USD/CAD – Hold short entered at 1.2690
USD/CAD - 1.2582
Original strategy :
Sold at 1.2690, Target: 1.2490, Stop: 1.2700
Position: - Short at 1.2690
Target: - 1.2490
Stop: - 1.2700
New strategy :
Hold short entered at 1.2690, Target: 1.2490, Stop: 1.2700
Position: - Short at 1.2690
Target: - 1.2490
Stop:- 1.2700
As the greenback has dropped again after meeting renewed selling interest at 1.2691 on Friday, retaining our bearish view that the decline from 1.2778 top is still in progress for weakness to 1.2540-50, however, a sustained breach below there is needed to signal the wave iv correction from 1.2414 (wave iii trough) has ended at 1.2778, bring further fall to 1.2490-00 but support at 1.2451 should hold on first testing. We are keeping our count that wave v as well as wave (C) ended at 1.3794 and impulsive wave (i ii, i ii) is now unfolding with minor wave iii possibly ended at 1.2414, hence wave iv correction is underway.
In view of this, we are holding on to our short position entered at 1.2690. Above 1.2700 would risk a stronger rebound to 1.2740-50, however, said resistance at 1.2778 should hold. Only break of said resistance at 1.2778 would abort and signal the rebound from 1.2414 is still in progress for retracement of recent decline to 1.2825-30 but still reckon upside would be limited to 1.2880-85 (50% Fibonacci retracement of wave iii) and price should falter well below 1.2990-95 (61.8% Fibonacci retracement), bring retreat later.
To recap, wave B from 1.3066 is unfolding as an a-b-c and is sub-divided as a: 1.2192, b: 1.2716 and wave c is a 5-waver with i: 1.1983, ii: 1.2506, extended wave iii with minor iii at 1.0206, wave iv ended at 1.0781 and wave v as well as wave iii has ended at 0.9931, hence the subsequent choppy trading is the wave iv which is unfolding as (a)-(b)-(c) with (a) leg of iv ended at 1.0854, followed by (b) leg at 1.0108 and (c) leg as well as the wave iv ended at 1.0674. The wave v is sub-divided by minor wave (i): 0.9980, (ii): 1.0374, (iii): 0.9446, (iv): 0.9913 and (v) as well as v has possibly ended at 0.9407, therefore, consolidation with upside bias is seen for major correction, indicated target at 1.3700 and 1.4000 had been met and further gain to 1.4700 would be seen later.