Sample Category Title
AUD/USD: Unemployment Change
The US dollar failed to sustain growth against the Aussie, as the Australian employment report surpassed expectations. The Australian dollar grew by 9 pips against the Greenback in the next couple of minutes after data were published, though the pair continued trading in a wide range in Thursday's morning.
The Australian Bureau of Statistics stated that the country's job market added 27K positions in July, showing an increase for tenth straight month in succession. Data revealed that the stronger employment growth was mainly driven by a surge in part-time jobs, which is unlikely to cause wage rise. Though, the labour market improved steadily during the year, the RBA remained concerned about further pay growth.
EUR/JPY Daily Outlook
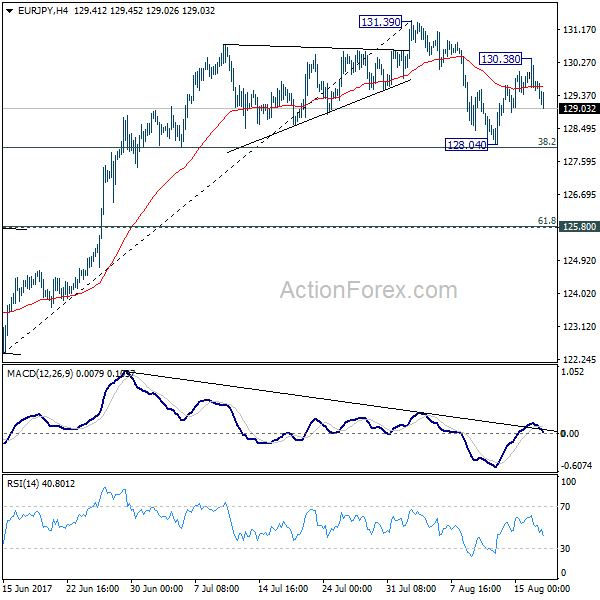
Daily Pivots: (S1) 129.31; (P) 129.85; (R1) 130.19; More...
EUR/JPY's recovery was limited at 130.38 and reversed. Intraday bias is turned neutral first. The consolidation from 131.39 could extend further. but downside should be contained by 38.2% retracement of 122.39 to 131.39 at 127.95 to bring rebound. On the upside, break of 131.39 will confirm up trend resumption. However, sustained break of 127.95 will bring deeper decline to 125.80 cluster support (61.8% retracement at 125.82) before completing the correction.
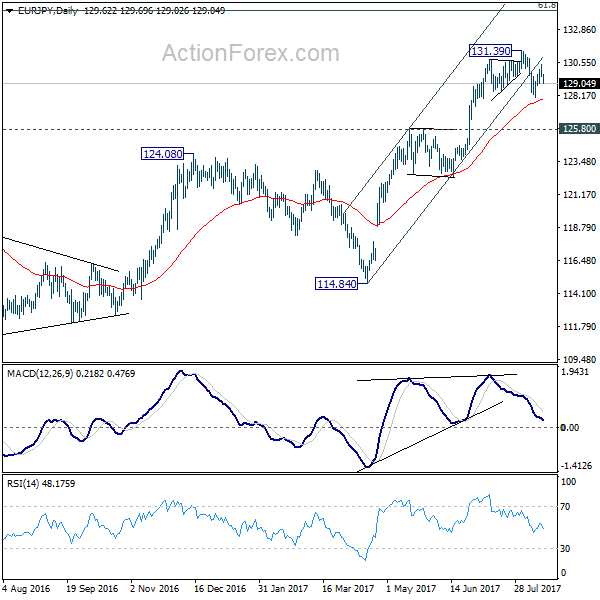
In the bigger picture, the down trend from 149.76 (2014 high) is completed at 109.03 (2016 low). Current rally from 109.03 should be at the same degree as the fall from 149.76 to 109.03. Further rise is expected to 61.8% retracement of 149.76 to 109.03 at 134.20. Sustained break there will pave the way to key long term resistance zone at 141.04/149.76. Medium term outlook will remain bullish as long as 124.08 resistance turned support holds.
GBPUSD Bearish Below Moving Averages
GBPUSD has significantly moved away from 10-month highs hit earlier in the month as it continues its downslide, dropping below the key 1.29 level. It is now attempting to reclaim that level after finding support at the 61.8% Fibonacci retracement level of the upleg from 1.2588 to 1.3266 between June and August.
Technical indicators continue to remain in bearish territory. The RSI is trending down again after failing to break above 50, while the MACD remains well below 0, though it has now climbed above the red signal line, suggesting an easing of the bearish bias in the near term.
The 1.2908 level proved a strong resistance area both today and yesterday and will likely again act as resistance in any upside moves. The next barrier could come from the 50% Fibonacci level at 1.2925. Above that, the 50-period moving average (MA), currently at 1.2967, would be one to watch as a break above the 50-period MA would shift the short-term bias to a bullish one. Further up, the 1.30 handle is a major resistance point as this has not only been a congested area in the past but also coincides with the 38.2% Fibonacci level, as well as the 200-period MA.
To the downside, the 61.8% Fibonacci level should again provide support at around the 1.2845 mark. Steeper declines would see the pair testing the July low of 1.2810, followed by the 78.6% Fibonacci level at 1.2730. A drop below this level would open the way towards the 1.26 handle and the June low of 1.2588.
Looking at the medium-term picture, the pair is looking increasingly neutral as it has slipped just below the 50-day moving average in the daily chart (though remains above the 200-day moving average).
NZDUSD Risk Back To Downside After Rebound Loses Steam
NZDUSD paused its decline from the July 27 high of 0.7557 to the August 16 low of 0.7222. After staging a robust rebound from this one-month low yesterday, the pair lost upside momentum. Prices reached the strong resistance level at the 61.8% Fibonacci retracement level (0.7335) of this downtrend.
RSI remains above 50 in bullish territory which leaves room for further upside in the near-term, with scope to target the 50% Fibonacci at 0.7378. A break of this resistance would help ease pressure and turn focus back to the upside to further Fibonacci levels at 0.7420 and 0.7472 ahead of the 0.7557 peak. From this point, there would be a resumption of the longer-term uptrend that started in May.
As long as 0.7335 resistance holds, the risk is to the downside. Failure to rise above this level could bring a deeper decline towards the key 0.7300 level ahead of the August 16 low of 0.7222. From here, the July 11 low of 0.7200 comes into view. A break below this would accelerate a decline towards 0.7000. Until this point, the market structure will remain neutral on the 4-hour chart, with NZDUSD hemmed in between 0.7200 and 0.7550. The overall outlook is neutral to bearish, with the 20 and 50-period moving averages giving a bearish signal.
Kiwi Dollar Back In Uptrend, Faces Challenge Near 0.7350-90
Key Highlights
- The New Zealand Dollar after trading as low as 0.7223, formed support against the US Dollar and recovered well.
- There was a break above a major bearish trend line at 0.7300 on the 4-hours chart of NZD/USD.
- New Zealand's Producer Price Index Output rose 1.3% (QoQ) in Q2 2017, more than the forecast of +0.7%.
- Today, the US Industrial Production figure for July 2017 will be released, which is forecasted to increase by 0.3%.
NZD/USD Technical Analysis
The New Zealand Dollar likely formed a bottom near 0.7220 this week against the US Dollar. The NZD/USD pair is back in the bullish zone and might soon face sellers near 0.7350-0.7390.
The pair recently made a nice upside move and cleared the 23.6% Fib retracement level of the last decline from the 0.7558 high to 0.7223 low. Buyers also succeeded in breaking a major bearish trend line at 0.7300 on the 4-hours chart.
The pair might continue to move higher towards 0.7350. The next major resistance is near the 200 simple moving average (H4) and the 38.2% Fib retracement level of the last decline from the 0.7558 high to 0.7223 low at 0.7351.
Above 0.7351, the next hurdle is near the 100 SMA, which is just below the 50% Fib retracement level of the last decline from the 0.7558 high to 0.7223 low.
On the downside, the broken resistance at 0.7300 may now act as a support if the pair corrects lower.
New Zealand's Producer Price Index
Recently in New Zealand, the Producer Price Index figures for Q2 2017 were released by the Statistics New Zealand. The market was looking for the PPI Output to increase by 0.7% compared with the previous quarter.
The actual result was above the market expectation, as there was an increase of 1.3% in the output index. Similarly, the Input index rose 1.4%, more than the forecast of 0.9% and higher than the last +0.8%.
The report pointed out that:
In the June quarter, meat product manufacturing and dairy product manufacturing rose 6.9 percent and 3.4 percent respectively. Dairy cattle farmers also received higher prices (up 5.8 percent), due to higher farm-gate milk prices.
Overall, the NZD/USD might continue to gain pace, but likely to face strong offers near the 0.7350-0.7390 resistance zone.
Economic Releases to Watch Today
- US Initial Jobless Claims – Forecast 240K, versus 244K previous.
- US Industrial Production July 2017 (MoM) – Forecast 0.3%, versus +0.4% previous.
- US Capacity Utilization July 2017 – Forecast 76.7%, versus 76.6% previous.
FOMC In Rear View While ECB Under Focus | Gold At Mercy Of Fed And Geopolitics
Dormant Inflation Kills The King Dollar
Gold At The Mercy of Fed and Geopolitics
Fed In Rear Mirror and ECB To Show Path
Dormant Inflation Kills The King Dollar
The FOMC committee members were all over the place rather than showing a united front during their FOMC minutes. However, the Fed left some life in the concept of winding down their balance sheet in September. The division is the chief concern here because some members feel comfortable that the inflation target would be achieved, others believe that there are strong odds that the current inflation is too weak and then you have the remaining members who anticipate that the Fed could be behind the curve.
The recent saggy inflation data made the committee ask themselves whether the inflation is dormant in the US. The data confirmed that the Fed does not need to keep hiking the interest rate at a supersonic pace, and this has taken the wind out of the dollar rally. Overall, the sentiment is negative amid dollar bulls, and the path of the least resistance is skewed to the downside. The dollar is suffering from a double whammy, Trump dissolved his two business advisory groups and then the Fed has shown their concern about the US inflation.
Initially, investors were optimistic about Trump's fiscal plan and they bet big on the dollar and on the US economy. However, Trump dissolving his major business groups makes the investment community even more pessimistic because this sets the stage for more failure for him. You can pretty much say goodbye to the idea that he would deliver anything on his promises. The double whammy doesn't stop here because we do not contemplate that investors have not paid attention to the details about Trump dealing with the recent violent situation in Charlottesville. His comments have divided the nation further which creates a more unstable ground for investments.
On the economic docket, we have the US unemployment data and Philly Fed number due later this afternoon. But the event which would matter for the dollar would be the Fed meeting in September.
Gold At The Mercy of Fed and Geopolitics
The precious metal may have another stab on the 1300 mark after recouping its losses yesterday. The geopolitical tensions are at the mercy of Trump's tweet and another missile test by North Korea. Finding a diplomatic solution to these tensions could ease those concerns and only that would take the shine off of the yellow metal, however given the nature of the personalities involved, it is arduous to fathom how that could happen. The Fed has dialled back from their hawkish stance and the minutes from the FOMC are dubbed dovish. All of this makes a firmer foundation for a bullish case for gold. The members were reticent when it comes to the timing and this also brings a big question mark for another rate hike for this year.
Fed In Rear Mirror and ECB To Show Path
With the Fed decision in the rear mirror, investors are focused on the ECB Minutes and they will try their best to get some clue with respect to the ECB's strategy to finally cuff the loose monetary policy. We do know that Mario Draghi is not going to lay down any kind of foundation with respect to the monetary policy during the Jackson Hole event. The bank has drummed one beat which is persistent and patience and we do think that the minutes will echo the same message. Inflation is still well behind their target thus, the ECB has many arms to combat any hawkish stance.
The Euro would be left high and dry if the ECB actually disappoints in not triggering any reasonable measures to tighten its monetary policy.
The European Central Bank has another bright star to look at; the annual GDP growth in the Eurozone was revised higher to 2.2 percent y/y. However, it does not mean that the economy in the Eurozone is sparking because the recovery is still uneven among the member states. Moreover, the inflation number has not recovered to pre-crisis level and the ECB does consider this as a vital part of their equation. Therefore, we do think that the ECB remains cautious in relation to their upcoming hawkish stance and they would certainly address the strength of the Euro. A higher euro is nothing but diabetes for the Eurozone's export.
GBP/JPY Daily Outlook
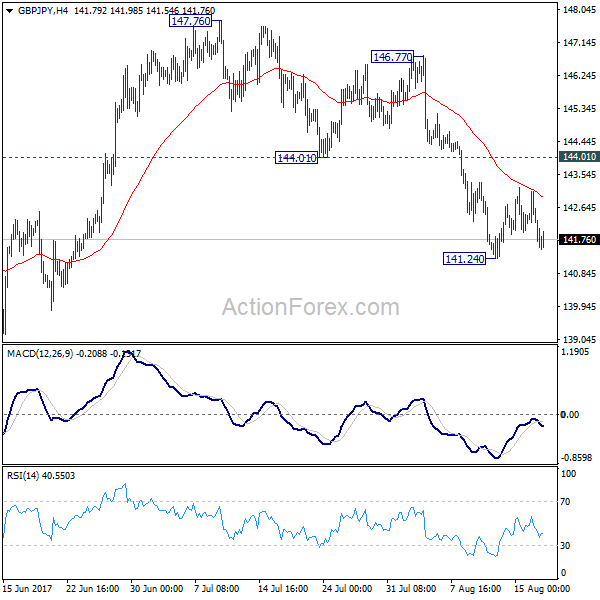
Daily Pivots: (S1) 141.47; (P) 142.28; (R1) 142.85; More
Intraday bias in GBP/JPY remains neutral for the moment as it's bounded in consolidation above 141.24 temporary low. With 144.01 support turned resistance intact, near term outlook stays mildly bearish for deeper decline. Break of 141.24 will extend the fall from 147.76 to 138.65 support and below. As GBP/JPY is seen as staying in consolidation pattern from 148.42, we'd expect strong support from 135.58 to contain downside. On the upside, break of 144.01 will indicate completion of the decline from 147.76 and turn bias back to the upside.
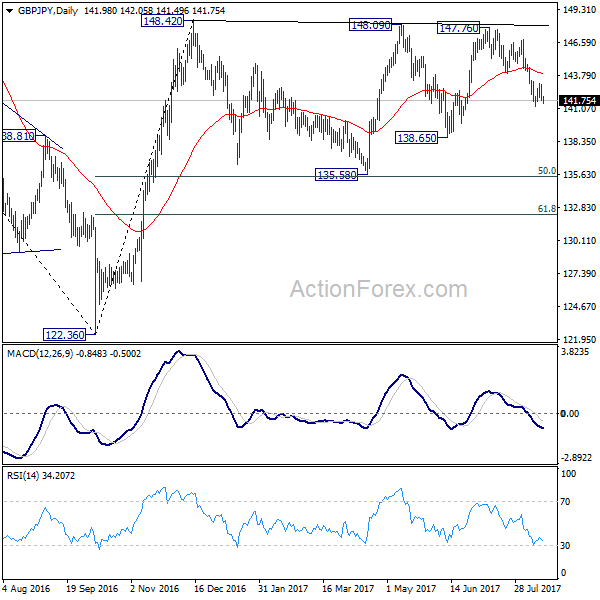
In the bigger picture, the sideway pattern from 148.42 is extending with another leg. But we'd expect strong support from 135.58 and 50% retracement of 122.36 to 148.42 at 135.39 to contain downside. Medium term rise from 122.36 is still expected to resume later. And break of 38.2% retracement of 196.85 to 122.36 at 150.43 will carry long term bullish implications. However, firm break of 135.58/39 will dampen the bullish view and turn focus back to 122.36 low.
Daily Technical Analysis: EURUSD, GBPUSD, USDJPY, USDCHF
EURUSD
The EURUSD attempted to push lower yesterday bottomed at 1.1681 but closed higher at 1.1765 and hit 1.1789 earlier today in Asian session. We have a bullish pin bar formation at the trend line support as you can see on my daily chart below suggests a potential bullish scenario which could end the bearish correction phase. The bias is bullish in nearest term testing 1.1850. A clear break and daily close above that area would expose 1.1910 – 1.2000 region. Immediate support is seen around 1.1750. A clear break below that area could lead price to neutral zone in nearest term testing 1.1700 area but as long as stay above 1.1650 I still prefer a bullish scenario and any downside pullback should be seen as a good opportunity to buy.
GBPUSD
The GBPUSD was indecisive yesterday. Price bounced-off the trend line support and EMA 200 as you can see on my daily chart below suggests a potential bullish bias. Immediate resistance is seen around 1.2950. A clear break above that area could trigger further bullish pressure testing 1.3000 – 1.3030 region. On the downside, 1.2865 remains a key support and good place to buy with a tight stop loss as a clear break and daily close below that area would expose 1.2600 region. Overall I remain neutral.
USDJPY
The USDJPY failed to continue its bullish momentum yesterday, bottomed at 110.03 and hit 109.66 earlier today in Asian session. The bias is bearish in nearest term. Price revisits the trend line support (109.50) as you can see on my daily chart below, which is a good place to buy with a tight stop loss as a clear break below 109.50/00 could trigger further bearish pressure testing 108.15 area. Immediate resistance is seen around 110.21 (current high). A clear break above that area could lead price to neutral zone in nearest term testing 110.80 or higher. Overall I remain neutral.
USDCHF
The USDCHF attempted to push higher yesterday topped at 0.9765 but whipsawed to the downside, closed lower at 0.9657 and hit 0.9641 earlier today in Asian session. The bias is bearish in nearest term testing 0.9620 – 0.9550 support area. Immediate resistance is seen around 0.9700. A clear break above that area could lead price to neutral zone in nearest term but key resistance remains around 0.9765 – 0.9807 region which remains a good place to sell.
Greenback Took A Double Hit
The U.S. dollar remained on the defensive early Thursday, after yesterday’s declines led by increased uncertainty over another U.S. rate hike in 2017 and President Donald Trump’s fiscal agenda after abolishing the Manufacturing Council and Strategy & Policy Forum.
The fall out between President Trump and Corporate America was the latest blow to his weakening administration. I wouldn’t be surprised to see him losing further support from his key Republican leaders as a result of his inadequate response to the deadly Charlottesville attacks. While this does not necessarily mean fiscal reforms are dead, it may slow down progress, which is bad news for both stocks and the dollar.
The minutes from the latest Fed meeting showed disagreement over the pace of raising rates. While some are concerned about the recent fall in inflation, others are worried about tightened labor conditions, which will eventually lead to higher prices and the Fed should not be behind the curve. However, the minutes showed that there is support for starting to reduce the $4.5 billion balance sheet, which could be announced at September’s meeting. The division over the next interest rate hike shouldn’t have been a surprise, given the different opinions we heard from Fed members last week. However markets felt the minutes were somewhat dovish, leading to a pullback in the dollar and U.S. yields.
Unless we start seeing prices heading north, the Fed is unlikely to raise rates again this year, and the dollar will remain under pressure. That’s why investors should keep a close eye on CPI, PCE, and wages data in the months to come.
Sterling also benefited from the weaker dollar, rising above 1.29 after touching a five-week low. However, it wasn’t just a weaker dollar story as the labor market still seems in good shape despite the Brexit drama unfolding. U.K. unemployment fell to a new 42-year low, putting the jobless rate at 4.4%. More importantly, wages grew to 2.1% from 2%, indicating that the tight labor market may have started impacting salaries. Despite real earnings remaining in negative territory, after taking into consideration the effects of inflation, this number is also improving as inflation seems to have peaked in May.
Today we’ll get to know whether the improvement in employment data will reflect in consumers’ spending habits. Previous data is not encouraging, with the BRC index showing discretionary spending dropping 0.7% over the three months to July. Any surprise to the upside is likely to provide additional support to the pound. Minutes from the latest ECB meeting are also due for release and traders would like to know whether the central bank is concerned about the most recent appreciation in the Euro.
EUR/GBP Candlesticks and Ichimoku Analysis
Weekly
• Last Candlesticks pattern: N/A
• Time of formation: N/A
• Trend bias: Near term up
Daily
• Last Candlesticks pattern: Doji
• Time of formation: 21 Jul 2017
• Trend bias: Up
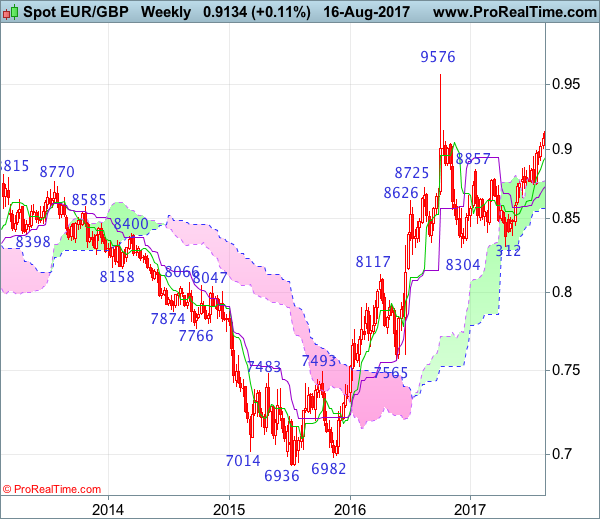
EURGBP – 0.9111
As the single currency has continued trading with a firm undertone, suggesting medium term upmove is still in progress and bullishness remains for medium term uptrend to extend headway to 0.9150-55, then towards 0.9190-00, however, near term overbought condition should prevent sharp move beyond 0.9250-55 and price should falter well below 0.9380-85 (100% projection of 0.8312-0.8950 measuring from 0.8743), risk from there is seen for a strong retreat to take place later this month.
On the downside, whilst initial pullback to 0.9050 and possibly support at 0.9008 cannot be ruled out, however, previous resistance at 0.8995 should limit downside and bring another rise later. Only a daily close below the Kijun-Sen (now at 0.8943) would signal a temporary top is formed, bring retracement of recent upmove to 0.8920-25, then towards previous support at 0.8891, once this level is penetrated, this would provide confirmation that recent upmove has ended, bring subsequent decline to 0.8850 but 0.8830-35 should hold.
Recommendation: Buy again at 0.8925 for 0.9125 with stop below 0.8825.
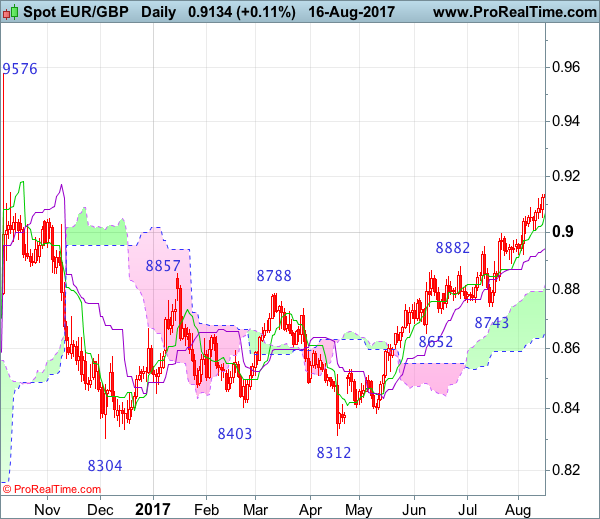
On the weekly chart, as the single currency has risen again after brief pullback, adding credence to our bullish view that recent erratic rise from 0.8304 is still in progress and upside bias remains for this move to extend gain to 0.9200-10, then towards 0.9250-60, however, near term overbought condition should limit upside to 0.9300-10 and upside should be limited to 0.9380-85 (100% projection of 0.8312-0.8950 measuring from 0.8743). Looking ahead, break there is needed to retain bullishness and signal the entire correction from 0.9576 top has ended at 0.8304 and encourage for further subsequent gain to 0.9450.
On the downside, although pullback to 0.9000-10 cannot be ruled out, reckon the Tenkan-Sen (now at 0.8939) would limit downside and bring another rise. A drop below support at 0.8891 would defer and suggest top is possibly formed, bring retracement of recent upmove to 0.8795-00 and then towards support at 0.8743, having said that, a weekly close below the Kijun-Sen (now at 0.8728) is needed to retain bearishness for subsequent decline to 0.8650-55 but the lower Kumo (now at 0.8571) should remain intact, bring another rally later.