Sample Category Title
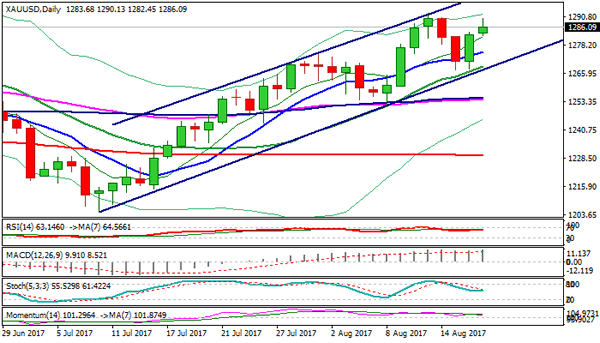
Technical Outlook: Spot Gold – Extended Recovery Looks For Retest Of $1292 Barrier
Spot Gold extended recovery from $1267 (Fibo 61.8% of $1251/$1292 upleg) to $1290 on Thursday, signaling retest of $1292 resistance (11 Aug high).
Strong rally on Wednesday, sparked by fresh dollar’s weakness on dovish Fed, formed bullish Outside Day pattern and generated reversal signal.
Signals that Fed may delay its expected rate hike boosted interest rate change sensitive gold, keeping bullish daily studies unaffected by recent $1292/$1267 correction and biased higher, eyeing targets at $1292 and $1296 (16 Apr /06 June highs) and psychological $1300 barrier.
Final break above key $1292/96 resistance zone is needed to signal resumption of broader uptrend $1122 (15 Dec 2016 low).
Meanwhile, corrective easing faces initial support at $1282 (session low / broken Fibo 61.8% of $1292/$1267 pullback) with rising 10SMA ($1275) expected to contain extended dips.
Res: 1290, 1292, 1296, 1300
Sup: 1282, 1275, 1279, 1276
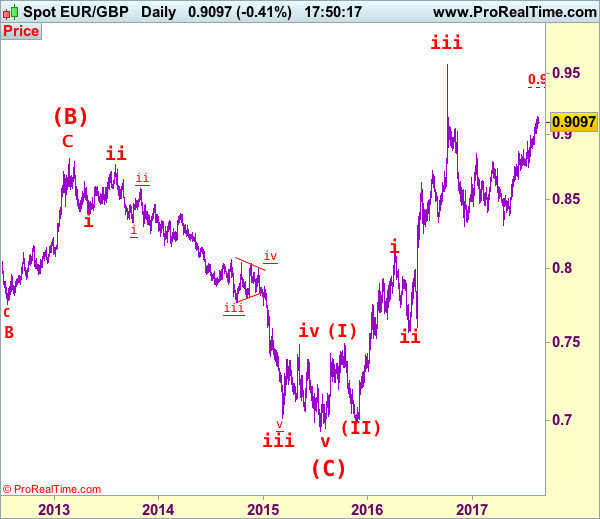
EUR/GBP Elliott Wave Analysis
EUR/GBP – 0.9089
As the single currency has risen again brief pullback, suggesting recent erratic rise from 0.8304 (Dec 2016) is still in progress and bullishness remains for this move to extend gain to 0.9190-00, then towards 0.9250-60, however, overbought condition should prevent sharp move beyond 0.9300 and reckon 0.9380-85 (100% projection of 0.8312-0.8950 measuring from 0.8743) would hold from here, risk from there is seen for a retreat due to near term overbought condition.
Our latest preferred count is that the wave V of a 5-wave series from 0.5682 ended at 0.9805 earlier and major from there has possibly ended at 0.8067 as A-B-C-X-A-B-C. We are keeping our view that the entire correction from 0.9805 has possibly ended at 0.7756 and as labeled as the attached daily chart and impulsive move from 0.9084 has ended at 0.7756 as a 5-waver which marked either the (C) wave or the A leg of (C), a daily close above resistance at 0.8831 would suggest (C) leg has ended and headway towards 0.9084.
On the downside, whilst initial pullback to 0.9050, then 0.9005-10 cannot be rule out, reckon downside would be limited to 0.8945-50 and bring another rise later. Below 0.8920-25 would suggest a temporary top is possibly formed, bring test of support at 0.8891 but a daily close below this level is needed to add credence to this view, bring retracement of recent upmove to 08850 and then 0.8800-10 later.
Recommendation: Buy at 0.8925 for 0.9125 with stop below 0.8825
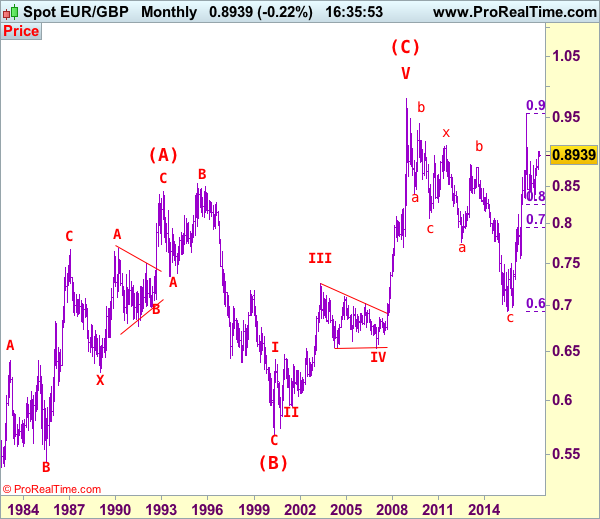
Euro's long term uptrend started in Feb 1981 at 0.5039 and is unfolding as a (A)-(B)-(C) move with (A): 0.8433 (Feb 1993), (B): 0.5682 (May 2000) and impulsive wave (C) should have ended at 0.9805 with wave III ended at 0.7254 (May 2003), triangle wave IV at 0.6536 (23 Jan 2007) and wave V as well as wave (C) has ended at 0.9805.
We are keeping an alternate count that only wave III ended at 0.9805 and the correction from there is the wave IV and may extend weakness to 0.7700, however, it is necessary to see a daily close above resistance at 0.9143 would change this to be the preferred count.
USD/CAD Elliott Wave Analysis
USD/CAD – 1.2643
Although the greenback has retreated after meeting resistance at 1.2778, as long as 1.2535-40 holds, further consolidation would be seen and prospect of another corrective bound remains, above said resistance would extend the recovery from 1.2414 low to 1.2800, however, reckon upside would be limited to 1.2850-60 and bring another decline, below 1.2535-40 would suggest the rebound from 1.2414 has ended, bring weakness to 1.2490-00, then test of 1.2451, break of latter level would signal recent decline has resumed for retest of 1.2414. Having said that, break there is needed to confirm recent wave c decline is under way for weakness to 1.2350, then 1.2300 but loss of momentum should prevent sharp fall below 1.2200-10 and price should stay well above 1.2000 level, bring rebound later. We are keeping our bearish count that wave b ended at 1.3794 and wave c has commenced for further fall to aforesaid downside targets.
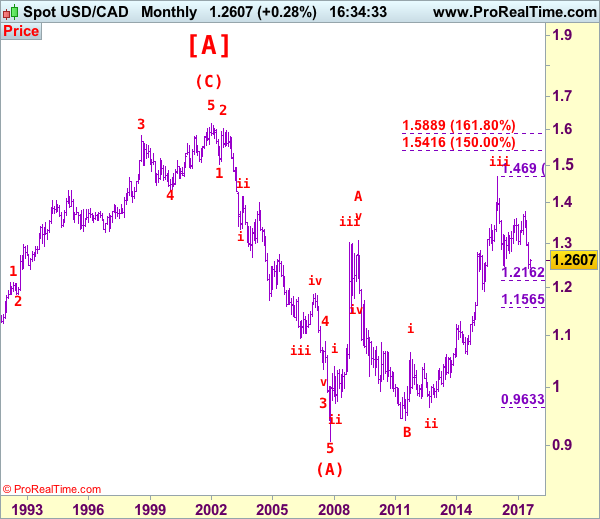
We are keeping our view that the wave b from 1.0657 (a leg top) has possibly ended at 0.9633 with (a): 0.9800, wave (b): 1.0447 and wave c at 0.9633, the subsequent rise from there is now treated as wave c exceeded indicated upside target at 1.3770-80 and 1.4000 and wave (3) has possibly ended at 1.4690 and wave (4) correction has commenced for retracement back to 1.2410-20, then towards 1.2200.
On the daily chart, our latest preferred count remains that the A of (B) rally from 0.9059 low (7 Nov 2007) unfolded into an impulsive wave with i: 0.9059-1.0380, ii ended at 0.9819, iii at 1.3019 followed by triangle wave iv at 1.2026 , then wave v formed a top at 1.3066 and also ended the wave A. The wave B is unfolding as an double three a-b-c-x-a-b-c and is sub-divided as a: 1.2192, b: 1.2716 and wave c at 1.0784, followed by wave x at 1.1725, another set of a-b-c unfolded with 2nd a at 0.9931, 2nd b at 1.0674. the 2nd c has possibly ended at 0.9407, therefore, consolidation with upside bias is seen for major correction, indicated target at 1.3900 had been met and gain to 1.4700 would follow.
On the upside, whilst initial recovery to 1.2800 cannot be ruled out, reckon upside would be limited to 1.2850–60 and renewed selling interest should emerge there, bring another decline to aforesaid downside targets. Above previous support at 1.2859 would defer and risk a stronger rebound to resistance at 1.2944 but upside should be limited to psychological resistance at 1.3000 and price should falter well below another previous support at 1.3165 (now resistance), bring another decline later.
Recommendation: Sell at 1.2850 for 1.2550 with stop above 1.2950.

Longer term - The selloff from 1.6194 (21 Jan 2002) to 0.9059 (07 Nov 2007) is viewed as (A) wave which is a 5-waver as labeled on the monthly chart as below, the subsequently rally is labeled as (B) with impulsive A leg of (B) ended at 1.3066, wave B of (B) is unfolding which has either ended at 0.9407 or would extend one more fall but downside should be limited to 0.9200 and 0.9000 should hold.
USD Broadly Lower Amid Dovish Fed Minutes But Set For A Bounce Back
'Dovish' Fed minutes weighs on USD
As expected the minutes of the July 25-26 FOMC meeting highlighted a broad division among Fed members. More specifically, the timing of the balance run-off was a major topic of discussion as several members were willing to pull the trigger last month, while the majority preferred to wait. Indeed, one reads 'several participants were prepared to announce a starting date for the program at the current meeting, most preferred to defer that decision until an upcoming meeting while accumulating additional information on the economic outlook'.
In addition, the minutes showed that despite the strengthening of the jobs market, many members were worried about inflation levels. The minutes said 'Many participants saw some likelihood that inflation might remain below 2 percent for longer than they currently expected, and several indicated that the risks to the inflation outlook could be tilted to the downside'.
All in all, the minutes were broadly in line with the June version, although some market participants construed them as dovish, I think that the September still is the key meeting as the Fed will announce the timing of the balance unwinding, while tightening borrowing cost in December.
Despite tumbling in the aftermath of the release of the minutes, the US dollar has reversed losses on Thursday morning amid a broad risk-off move. The uncertainties generated by Trump’s political jitters, together with worries about the upcoming ECB meeting in early September has helped the greenback to regain traction.
Russia: Retail sales to continue growing in July
Russia retail sales is set to be released today. Markets estimate a slight decline from June to 1% from 1.25 in July. The ruble is strengthening against the dollar and we believe that upside pressures should likely accelerate for the ruble. Late last July, the Central Bank of Russia has decided to hold rates unchanged at 9% probably on geopolitical fears.
The diplomatic relations bet ween the US and Russia are still one key driver for the USDRUB pair. For the time being the Russian economic fundamentals are improving. The unemployment rate which will also be released today should likely remain steady at 5.1%.
We consider that the Central Bank of Russia will before year-end to normalize its interest rate and its key rate should head back towards 8%. This would avoid any strong over-appreciation of the ruble due to improving fundamentals. The next meeting will take place the 15th of September. The central bank has definitely some room devalue its currency but will definitely do it at a slow pace not to derail ongoing recovery. One dollar will likely trade against 60 ruble within the short-term.
Trade Idea: GBP/USD – Sell at 1.2980
GBP/USD – 1.2883
Trend: Near term up
Original strategy :
Sell at 1.2980, Target: 1.2815, Stop: 1.3040
Position: -
Target: -
Stop: -
New strategy :
Sell at 1.2980, Target: 1.2815, Stop: 1.3040
Position: -
Target: -
Stop:-
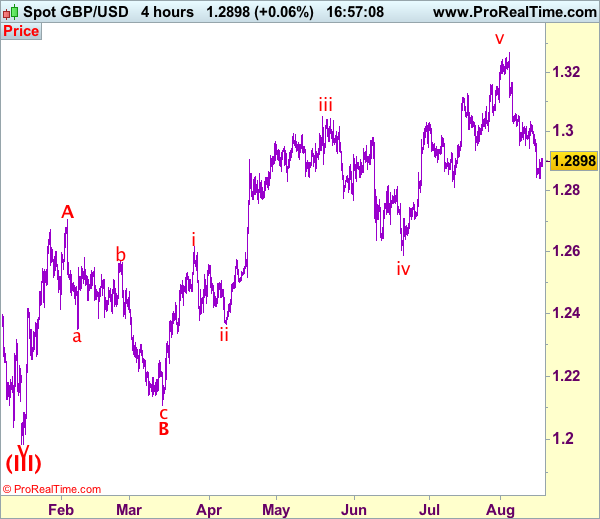
As cable has rebounded again after yesterday’s marginal fall to 1.2842, retaining our view that consolidation above this level would be seen and corrective bounce to 1.2950 is likely, however, reckon upside would be limited to 1.2980-90 and bring another decline, below said support at 1.2842 would add credence to our view that the selloff from 1.3269 top is still in progress and bearishness remains for this move to bring correction of early upmove, hence further weakness to 1.2812 support would be seen but near term oversold condition should prevent sharp fall below 1.2800 and reckon 1.2740-50 would hold on first testing, bring rebound later.
In view of this, would not chase this fall here and would be prudent to sell cable on recovery as 1.2980-90 should limit upside, above resistance at 1.3032 would defer and suggest low is formed, risk a stronger rebound to 1.3059 and possibly towards 1.3100 but previous support at 1.3112 (now resistance) should remain intact, bring another decline.
Our preferred count on the daily chart is that cable's rebound from 1.3500 (wave (A) trough) is unfolding as a wave (B) with A ended at 1.7043, followed by triangle wave B and wave C as well as wave (B) has ended at 1.7192, the subsequent selloff is the larger degree wave (C) which is still unfolding with minor wave (III) of larger degree wave 3 ended at 1.1986, hence wave (IV) correction is in progress which could either be a triangle wave (IV) of a complex formation but upside should be limited to 1.3500 and price should falter well below 1.4000, bring another decline in wave (V) of 3 for weakness to 1.1500, then 1.1200.
FOMC Minutes Reveal An Increasingly Cautious Committee
The minutes of the July FOMC meeting revealed an increasing level of concern among officials over the recent softness in inflation. For starters, more policymakers are now skeptical as to whether low inflation is indeed transitory. Perhaps more importantly, 'several' participants indicated that the risks to the inflation outlook could be tilted to the downside, something not seen in the June minutes. Some officials even noted that given this increased uncertainty around inflation, the Committee could afford to be patient with further rate hikes. As for the Fed's gigantic balance sheet, even though some members wanted to announce a starting date for normalization immediately at that meeting, most preferred to defer that decision until an 'upcoming meeting'.
The dollar declined on the news, as the Committee's increasing anxiety around inflation probably pushed back expectations regarding the timing of the next rate increase. We think that the currency could remain on the back foot for a few days, given that there are no major data releases or events on the US economic calendar in the near-term to distract investors and alter this negative sentiment.
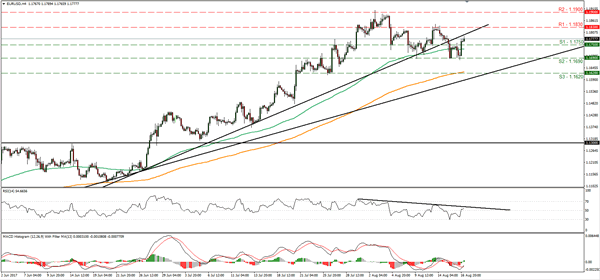
EUR/USD rebounded ahead of the minutes, after it found support near the 1.1690 (S2) zone. The dovish tone of the minutes pushed the pair even higher, to break above the resistance (now turned into support) level of 1.1750 (S1). Even though the latest rebound may continue for a while and perhaps aim for another test near 1.1830 (R1), the recent break below the short-term uptrend line taken from the low of the 23rd of June suggests to us that the near-term outlook of the pair has turned neutral. Having said that, despite the near-term outlook turning neutral, as long as EUR/USD continues to trade above the medium-term uptrend line drawn from the low of the 17th of April, we consider the broader picture to still be positive.
Draghi is unlikely to deliver a new message next week; sources
The euro tumbled somewhat yesterday, after a media report familiar with ECB sources suggested that ECB President Draghi will not deliver a fresh policy message when he speaks at the Jackson Hole economic symposium next week. This probably poured cold water on expectations that Draghi could provide some hints about an eventual exit from QE in his remarks. One source even stated that 'expectations that this will be a big monetary policy speech are wrong', according to the article.
Indeed, Draghi signaling the next step in ECB policy at a non-monetary policy meeting would be strange, as he would be essentially committing to policy action ahead of time, and without necessarily having the blessings of the Governing Council. At the latest ECB meeting, he clearly stated that a discussion on tweaks to QE should take place in the 'autumn', suggesting we are likely to get some signals on stimulus changes either in September or October. Although a lot will depend on incoming data, we maintain our view that a likely scenario is that the Bank removes its QE easing bias at the September meeting, thereby laying the groundwork for a formal announcement in October that the pace of QE purchases may be reduced by the turn of the year.
It's not all bad news for euro bulls though. Since Draghi will probably not deliver major policy signals at the Jackson Hole, that means he is also less likely to use that speech as an opportunity to jawbone the euro, something that seemed quite likely prior to this media report. As such, this development does not change our outlook for the euro. We believe that it could continue to gain overall, though we would prefer to exploit further gains primarily against the weak GBP, which has been bleeding recently amid diminishing expectations for a near-term BoE rate hike and continued uncertainty over the ongoing Brexit negotiations.
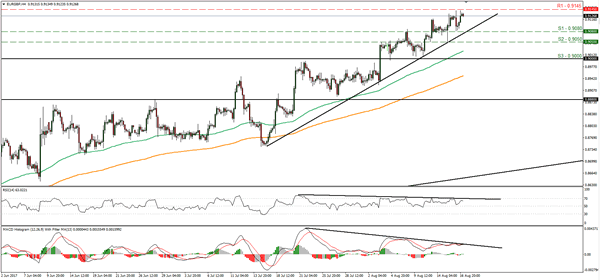
EUR/GBP spiked lower after this report, to hit support near the 0.9080 (S1) hurdle. Nonetheless, the rate rebounded in the following hours to find resistance at the 0.9145 (R1) level. The price structure on the 4-hour chart remains higher peaks and higher troughs above a short-term uptrend line taken from the lows of the 17th of July. Thus, we expect the bulls to seize control again soon and aim for another test near 0.9145 (R1). A clear break above that hurdle could initially aim for the 0.9190 (R2) barrier, marked by levels last seen in late October 2009.
Today's highlights:
During the European day, we get the UK retail sales for July and expectations are for both the headline and the core figures to have slowed, which could bring GBP under renewed selling interest. In Eurozone, the minutes of the ECB July meeting will be in focus. Even though this release is usually not a major market mover, we will go through the discussion surrounding the QE program for any clues as to whether the Governing Council is set to announce a reduction in its purchases soon. From the US, we get the Philly Fed business activity index for August and industrial production data for July.
We have two speakers on the agenda: Dallas Fed President Robert Kaplan and Minneapolis Fed President Neel Kashkari.
EUR/USD
Support: 1.1750 (S1), 1.1690 (S2), 1.1620 (S3)
Resistance: 1.1830 (R1), 1.1900 (R2), 1.1980 (R3)
EUR/GBP
Support: 0.9080 (S1), 0.9050 (S2), 0.9000 (S3)
Resistance: 0.9145 (R1), 0.9190 (R2), 0.9240 (R3)
Trade Idea: GBP/JPY – Stand aside
GBP/JPY - 141.80
Trend: Near term down
New strategy :
Stand aside
Position: -
Target: -
Stop:-
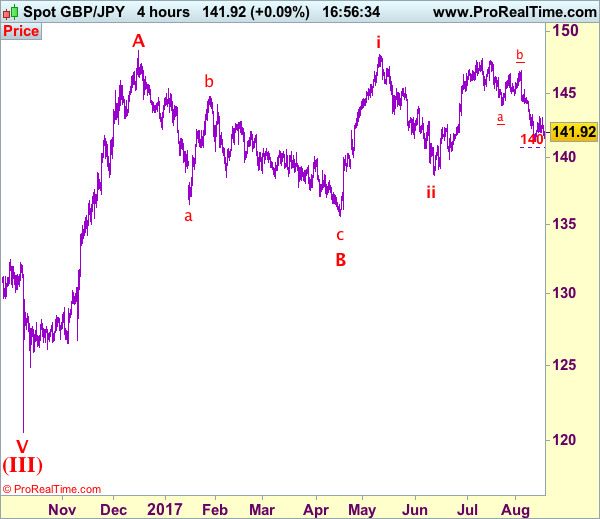
Despite rebounding to 143.20, the subsequent retreat suggests the rebound from 141.25 (Friday’s low) has possibly ended there and retest of said support cannot be ruled out, however, break there is needed to 140.80-85 (1.618 times projection of 147.75-144.05 measuring from 146.80) but near term oversold condition should prevent sharp fall below 140.50 and reckon psychological support at 140.00 would hold from here.
On the upside, whilst recovery to 142.10-20 cannot be ruled out, reckon upside would be limited to 142.70-80 and price should falter well below said resistance at 143.20, bring retreat later. Only a break of said this week’s high would suggest a temporary low has been formed at 141.25, bring retracement of recent decline to 144.00 (previous support turned resistance), however, reckon upside would be limited to 144.45-50 and 144.70 should hold, price should falter well below strong resistance at 145.30. As near term outlook is mixed, would be prudent to stand aside for now.
Our preferred count is that larger degree wave V with circle is unfolding from 251.12 with wave (I) 219.34, (II): 241.38 and wave (III) is subdivided into 1: 192.60, 2: 215.89 (23 Jul 2008) and wave 3 ended at 118.87 earlier in 2009. The correction from there to 162.60 is wave 4 which itself is a double three and is labeled as first a-b-c ended at 151.53, followed by wave x at 139.03, 2nd a ended at 162.60, 2nd b at 146.75 and 2nd c leg of wave 4 ended at 163.00. Therefore, the decline from 163.00 to 116.85 is now treated as wave 5 which also marked the end of larger degree wave (III), hence wave (IV) major correction has commenced for retracement of the wave (III) from 241.38 and upside target at 183.95-00 (50% Fibonacci retracement of the wave (II) from 241.38) had been met, a drop below 160.00 would suggest wave (IV) has ended at 195.85, bring decline in wave (V) for initial weakness to 130 (already met) and 120.
Forex Technical Analysis: EUR/USD, USD/JPY, GBP/USD
EUR/USD
Current level - 1.1730
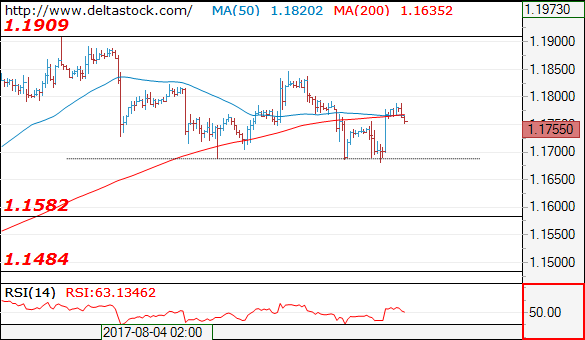
Yesterday's test of 1.1680 has failed again, but the outlook on the senior frames remains bearish, for a slide towards 1.1580. There is a minor intraday risk of short-lived attempt towards 1.1850 hurdle.
| Resistance | Support | ||
| intraday | intraweek | intraday | intraweek |
| 1.1770 | 1.1909 | 1.1680 | 1.1580 |
| 1.1830 | 1.2000 | 1.1580 | 1.1480 |
USD/JPY
Current level - 110.03
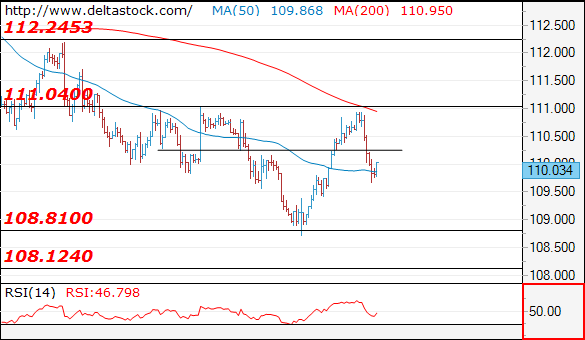
The reversal below 110.00 resistance should be considered corrective, preceding final leg upwards, to 111.50-112.20 area. The latter will pave the way for a sell-off towards 107.00.
| Resistance | Support | ||
| intraday | intraweek | intraday | intraweek |
| 110.30 | 112.20 | 109.40 | 108.10 |
| 111.10 | 114.50 | 108.80 | 107.00 |
GBP/USD
Current level - 1.2882
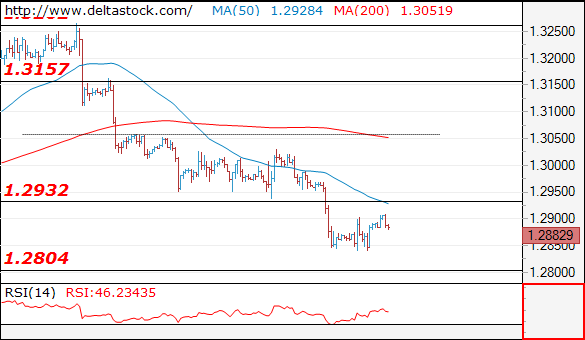
The intraday bias is slightly positive, for a test of 1.2930 resistance. The outlook on the higher frames remains negative, for a test of 1.2800 area.
| Resistance | Support | ||
| intraday | intraweek | intraday | intraweek |
| 1.2930 | 1.3260 | 1.2804 | 1.2804 |
| 1.3050 | 1.3500 | 1.2705 | 1.2480 |
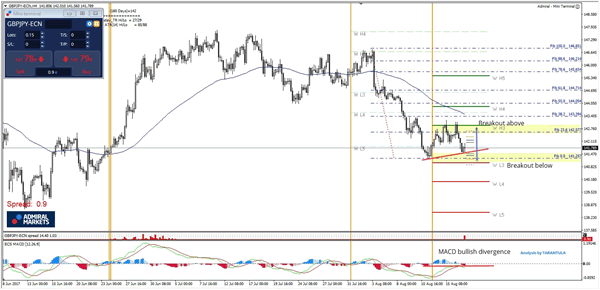
Daily Technical Analysis: GBP/JPY MACD Divergence At Monthly Support
The GBP/JPY has made a temporary bottom at 141.25 and we can see MACD divergence that could push the price to the upside.141.25-50 is the zone where price might spike towards the 142.60-85 where new sellers might be waiting. Only a clear 4h close or h1 momentum above 142.90 should target 143.40. Bearish continuation happens only below 140.90, but at this point, the GBP/JPY is supported by Monthly and Weekly supports and bullish MACD divergence.
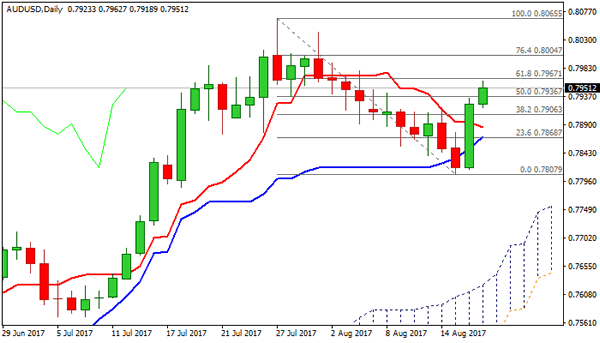
Technical Outlook: AUDUSD Extends Recovery, Boosted By Better Than Expected Australian Jobs Data
The pair hit fresh high at 0.7962 on Thursday, in extension of Wednesday's strong rally that formed higher base at 0.7810 zone. Release of upbeat Australian jobs data (27.9K new jobs created in July vs 20.0K f/c and Unemployment in July coming along with expectations at 5.6% vs 5.7% in June) additionally boosted Aussie dollar which was lifted by greenback's fall after FOMC minutes. Strong bullish acceleration suggests corrective phase from 0.8065 peak might be over. Fresh bulls need clear break above pivotal barrier at 0.7967 (Fibo 61.8% of 0.8065/0.7807 pullback) to confirm reversal and open way for attack at psychological 0.8000 barrier and key resistance at 0.8065 (23 July peak). Broken 20SMA offers immediate support at 0.7927, while daily Tenkan-sen at 0.7885 should contain extended dips.
Res: 0.7967, 0.8000, 0.8042, 0.8065
Sup: 0.7927, 0.7895, 0.7885, 0.7870