Sample Category Title
EUR/USD Weekly Outlook
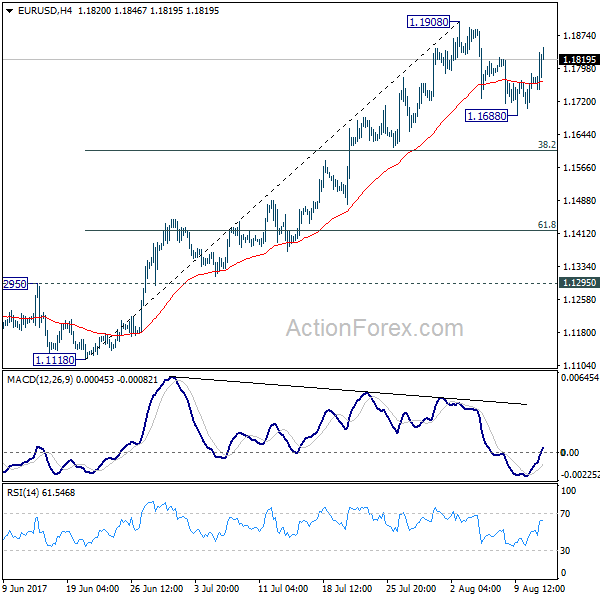
EUR/USD's pull back from 1.1908 extended to 1.1688 last week but recovered since then. With 1.1908 resistance intact, initial bias remains neutral this week for some more consolidations first. In case of another fall, downside should be contained by 38.2% retracement of 1.1119 to 1.1908 at 1.1606 to bring rebound. On the upside, break of 1.1908 will extend recent up trend to 1.2042 long term support turned resistance next.
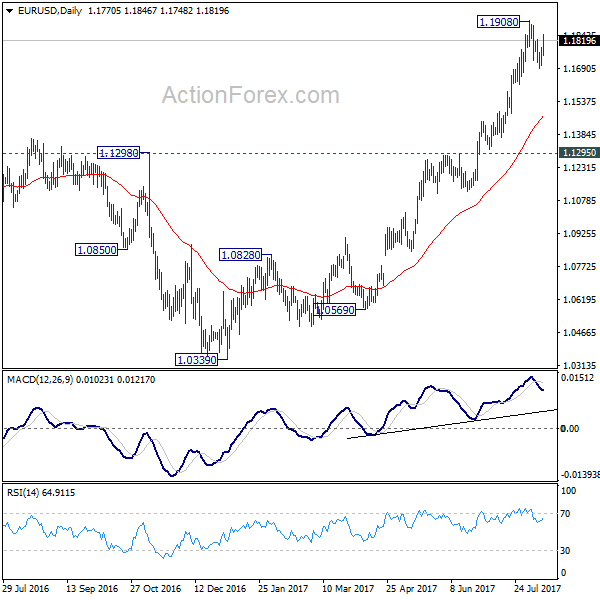
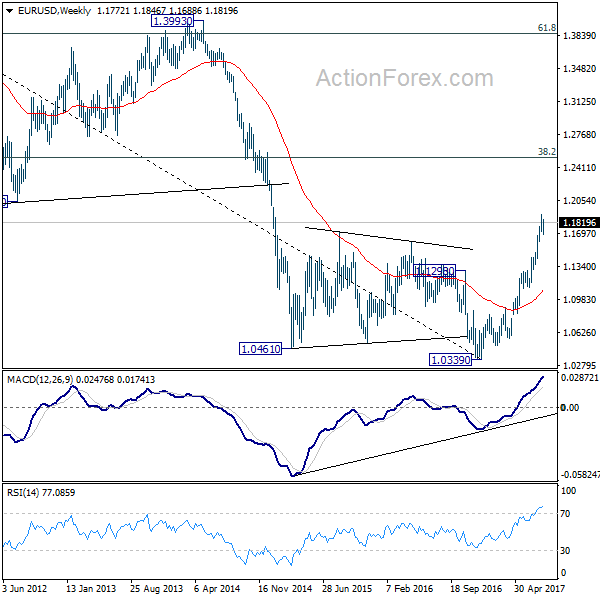
In the bigger picture, an important bottom was formed at 1.0339 on bullish convergence condition in weekly MACD. Sustained trading above 55 month EMA (now at 1.1768) will pave the way to key fibonacci level at 38.2% retracement of 1.6039 (2008 high) to 1.0339 (2017 low) at 1.2516. While rise from 1.0339 is strong, there is no confirmation that it's developing into a long term up trend yet. Hence, we'll be cautious on strong resistance from 1.2516 to limit upside. But for now, medium term outlook will remain bullish as long as 1.1295 support holds, in case of pull back.
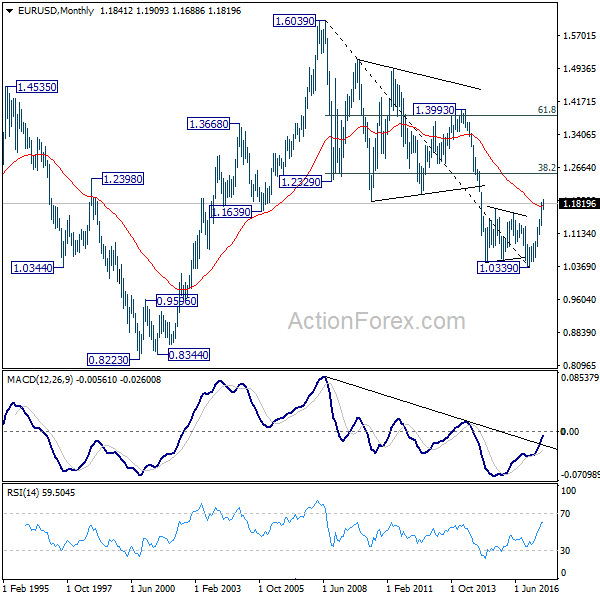
In the long term picture, 1.0339 is now seen as an important bottom as the down trend from 1.6039 (2008 high) could have completed. It's still early to decide whether price action form 1.0339 is developing into a corrective or impulsive move. But in either case, further rally would be seen to 38.2% retracement of 1.6039 to 1.0339 at 1.2516
USD/JPY Weekly Outlook
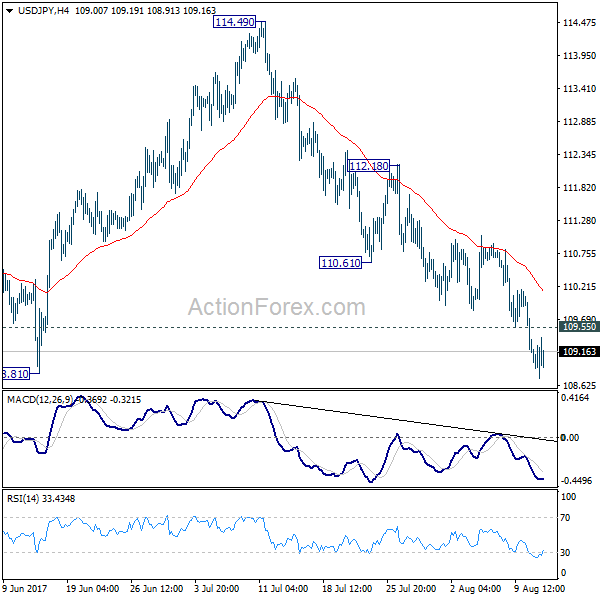
USD/JPY's fall from 114.49 extend lower last week and breached 108.81 support. Initial bias remains on the downside this week. Sustained break of 108.81 will resume whole corrective fall from 118.65 and target 61.8% retracement of 98.97 to 118.65 at 106.48. On the upside, above 109.55 minor resistance will turn intraday bias neutral first. But near term outlook will remain bearish as long as 110.61 support turned resistance holds.
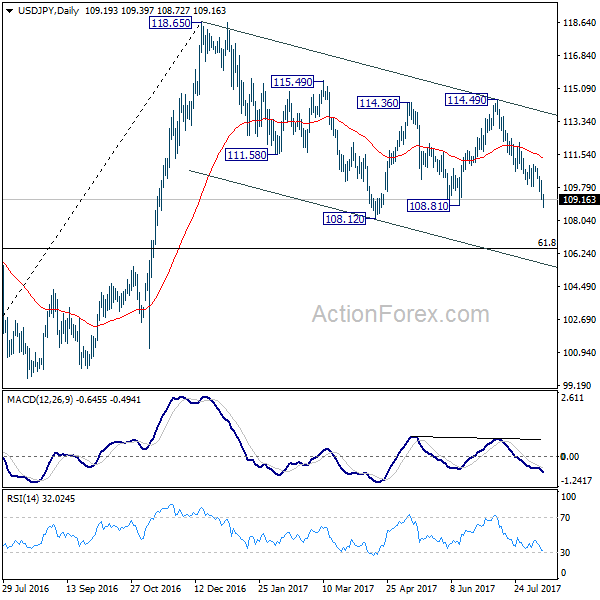
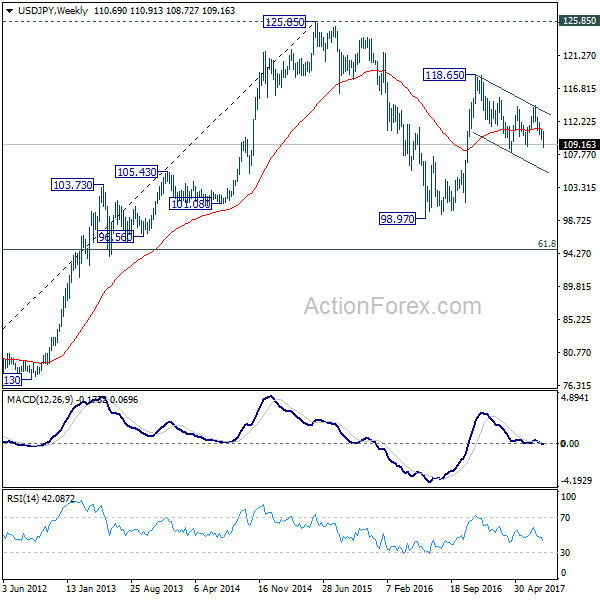
In the bigger picture, the corrective structure of the fall from 118.65 suggests that rise from 98.97 is not completed yet. Break of 118.65 will target a test on 125.85 high. At this point, it's uncertain whether rise from 98.97 is resuming the long term up trend from 75.56, or it's a leg in the consolidation from 125.85. Hence, we'll be cautious on topping as it approaches 125.85. If fall from 118.65 extends lower, downside should be contained by 61.8% retracement of 98.97 to 118.65 at 106.48 and bring rebound.
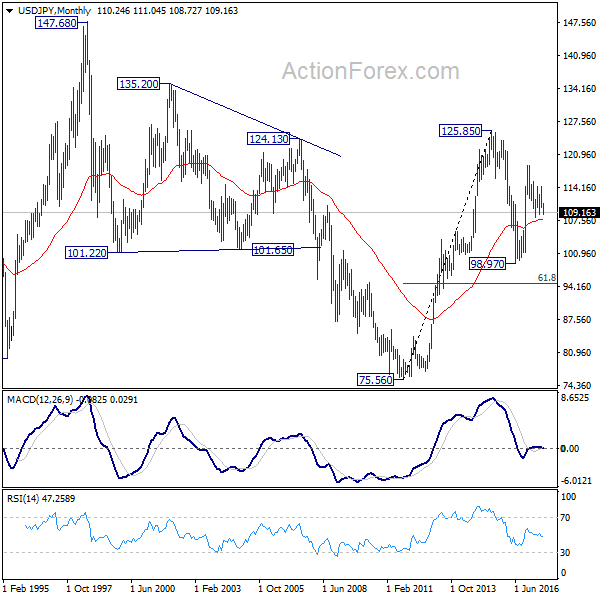
In the long term picture, the rise from 75.56 long term bottom to 125.85 top is viewed as an impulsive move. Price actions from 125.85 are seen as a corrective move which could still extend. But, up trend from 75.56 is expected to resume at a later stage for above 135.20/147.68 resistance zone.
GBP/USD Weekly Outlook
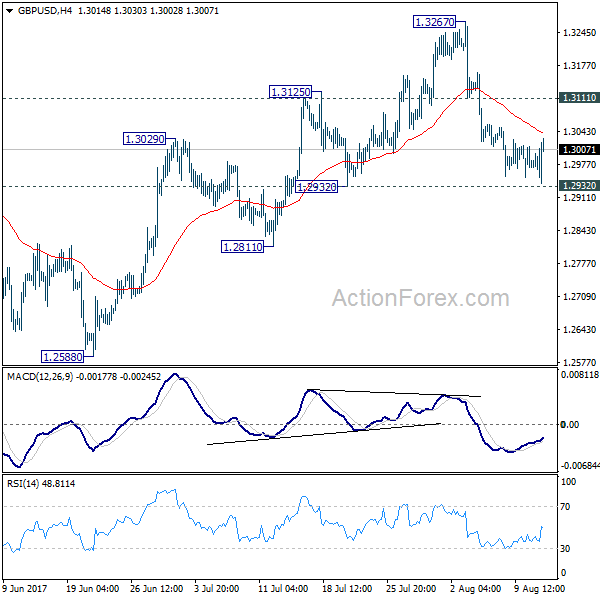
GBP/USD's decline from 1.3267 extended lower last week but lost momentum ahead of 1.2932 support. Initial bias is neutral this week first. Near term outlook stays cautiously bearish as long as 1.3111 resistance holds and deeper fall is expected. As noted before, price actions from 1.1946 are seen as a corrective pattern and could have completed at 1.3267. Break of 1.2932 will affirm this bearish case and target 1.2588 key near term support for confirmation. However, break of 1.3111 resistance will turn bias back to the upside for retesting 1.3267 high instead.
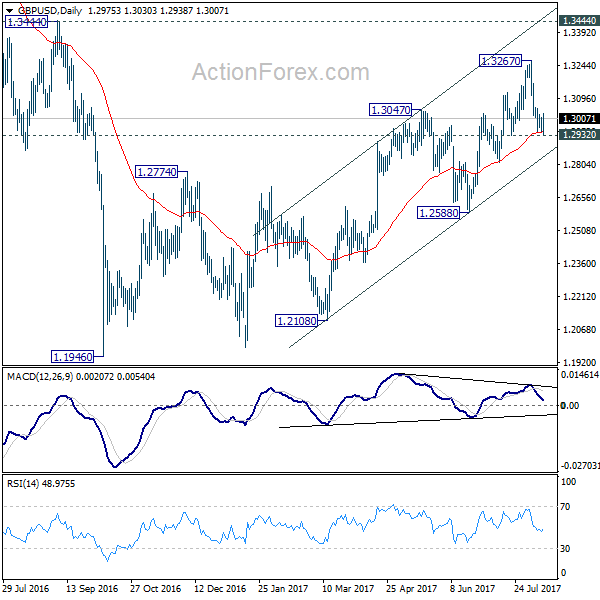
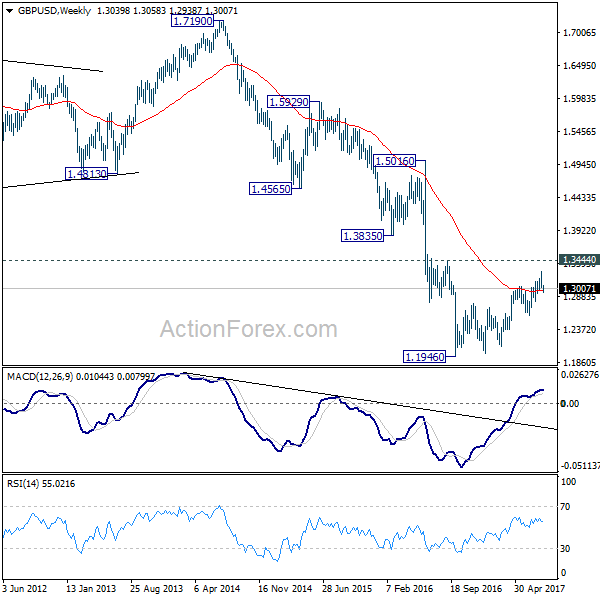
In the bigger picture, overall, price actions from 1.1946 medium term low are seen as a corrective pattern. While further rise cannot be ruled out, larger outlook remains bearish as long as 1.3444 key resistance holds. Down trend from 1.7190 (2014 high) is expected to resume later after the correction completes. And break of 1.2588 will indicate that such down trend is resuming.
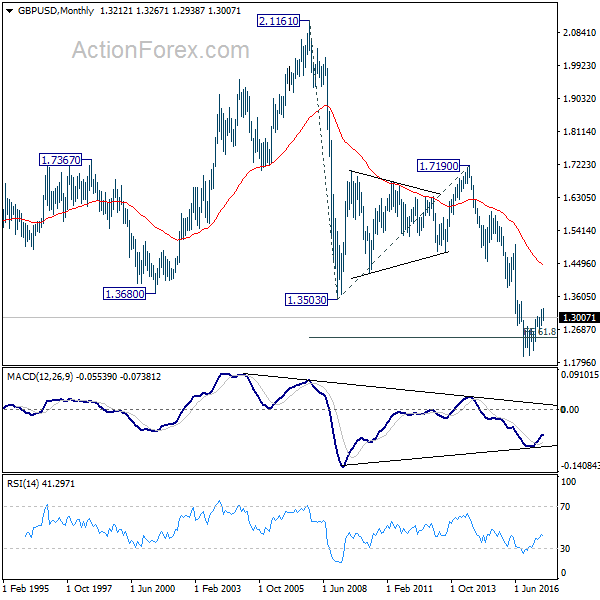
In the longer term picture, no change in the view that down trend from 2.1161 (2007 high) is still in progress. On resumption, such decline would extend deeper to 100% projection of 2.1161 to 1.3503 from 1.7190 at 0.9532. However, firm break of 1.3444 should confirm reversal and turn outlook bullish.
USD/CHF Weekly Outlook
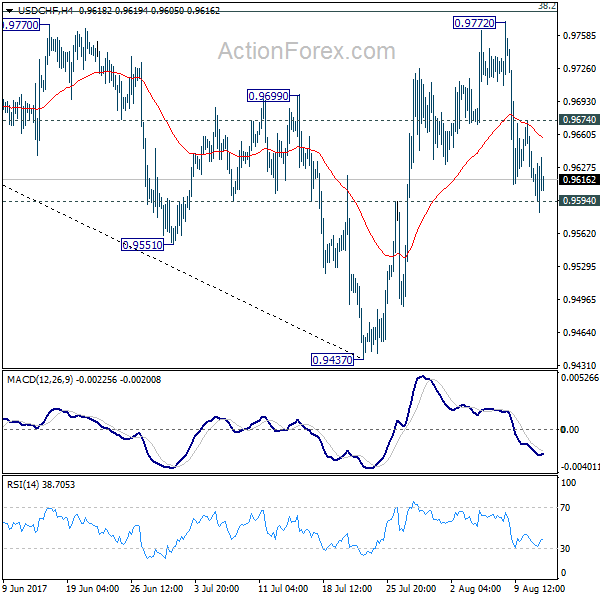
USD/CHF's fall from 0.9772 extended lower last week and breached 0.9594 support. But the pair quickly recovered. Initial bias remains neutral this week first. Near term outlook is a bit mixed. On the one hand, USD/CHF drew strong support from 0.9443 and rebounded. On the other hand, it is bounded inside medium term falling channel and limited below 38.2% retracement of 1.0342 to 0.9437 at 0.9783. On the downside, firm break of 0.9594 will dampen our bullish view and turn bias back to the downside for 0.9437. This could also extend the fall from 1.0342 through 0.9437/43 key support level. On the upside, above 0.9772 will revive the bullish case of reversal and turn bias back to the upside.
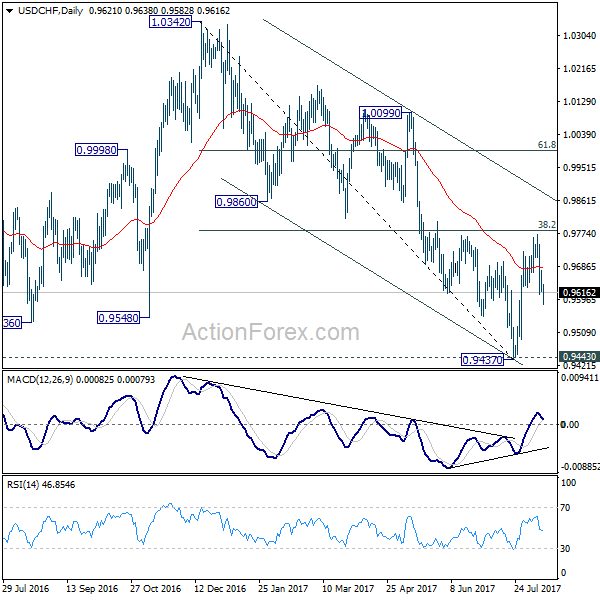
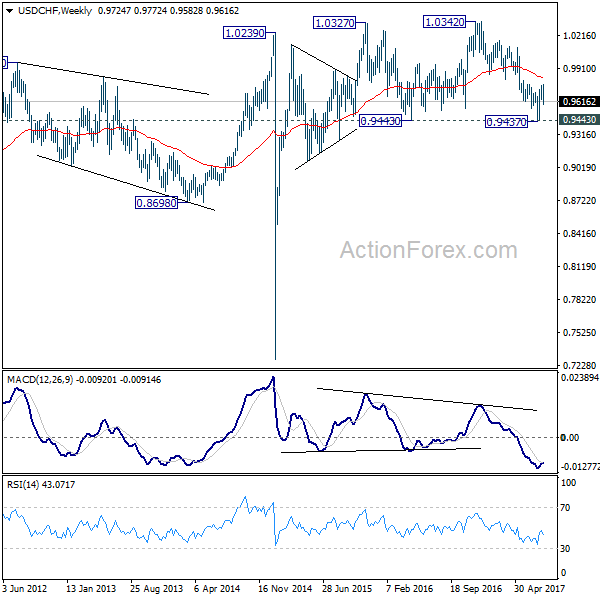
In the bigger picture, current development argues that USD/CHF has successfully defended 0.9443 key support level. And long term range trading in 0.9443/1.0342 is extending with another rise. At this point, there is no sign of an up trend yet. Hence, while further rise is expected in USD/CHF, we'll start to be cautious on loss of momentum above 61.8% retracement of 1.0342 to 0.9437 at 0.9996. However, firm break of 0.9443 will carry larger bearish implication and would target next key support at 0.9072.
AUD/USD Weekly Outlook
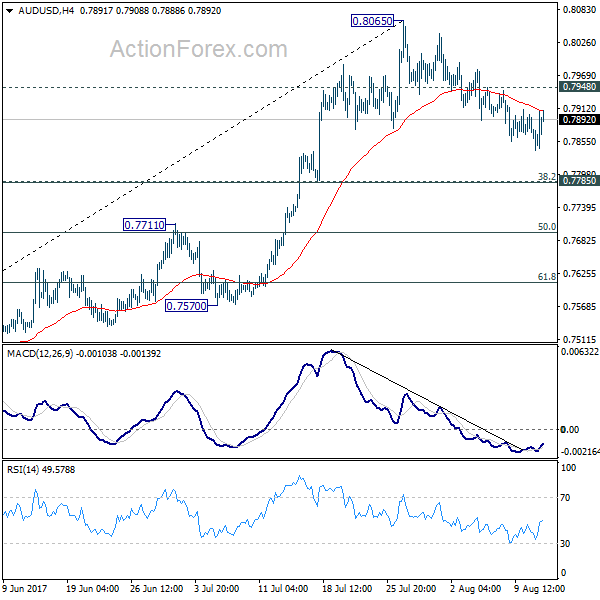
AUD/USD's pull back from 0.8065 short term top extended lower last week. The pair lost some downside momentum after hitting 0.7838. With 0.7948 minor resistance intact, deeper decline could be seen. But we'd expect strong support from 0.7785 cluster support (38.2% retracement of 0.7328 to 0.8065 at 0.7783) to contain downside and bring rebound. On the upside, break of 0.7948 will argue that the pull back is completed. In such case, intraday bias will be turned back to the upside for retesting 0.8065.
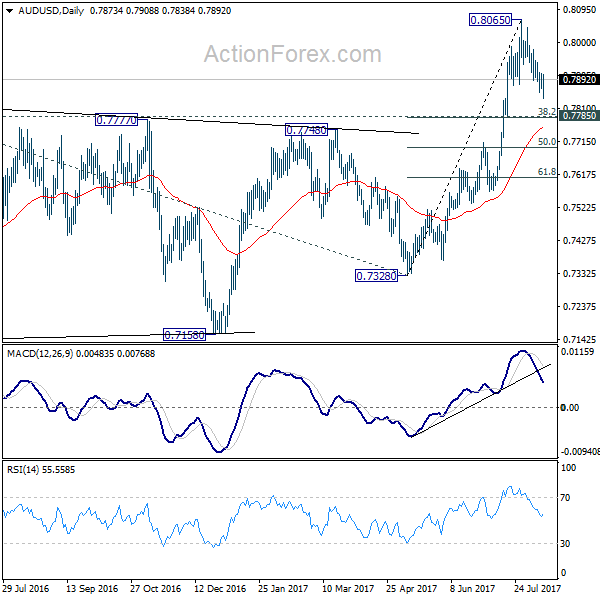
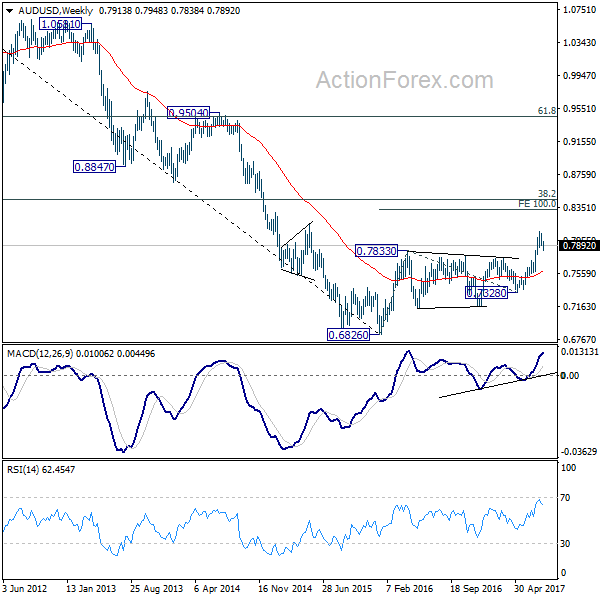
In the bigger picture, rise from 0.6826 medium term bottom is still in progress. At this point, there is no confirmation of trend reversal yet and we'll continue to treat such rebound as a corrective pattern. But in any case, break of 55 month EMA (now at 0.8100) will target 38.2% retracement of 1.1079 to 0.6826 at 0.8451. Break of 0.7328 support is needed to confirm completion of the rebound. Otherwise, further rise is now expected.
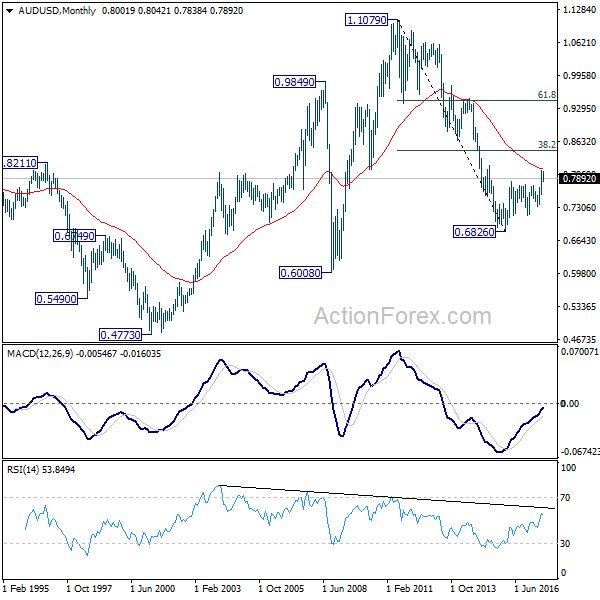
In the longer term picture, 0.6826 is seen as a long term bottom. Rise from there could either reverse the down trend from 1.1079, or just develop into a corrective pattern. At this point, we're favoring the latter. And, as long as 38.2% retracement of 1.1079 to 0.6826 at 0.8451 holds, we'd anticipate another decline through 0.6826 at a later stage.
USD/CAD Weekly Outlook
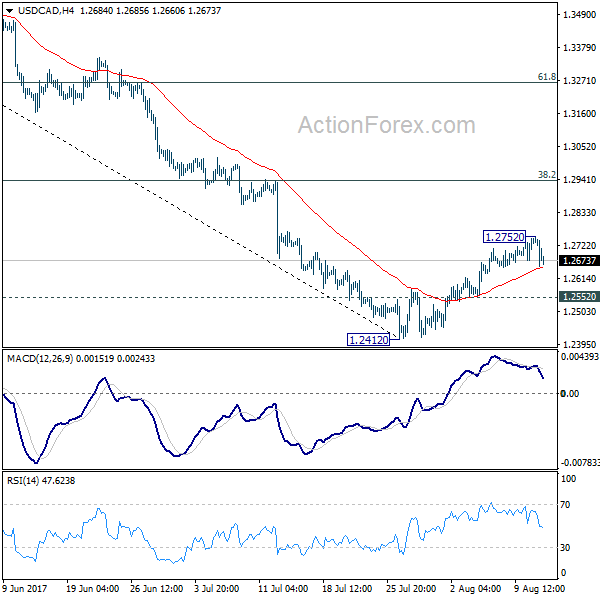
USD/CAD's recovery from 1.2412 short term bottom extended to 1.2752 last week. A temporary top should be formed there and initial bias is neutral this week first. At this point, further rise cannot be ruled out yet. But based on current momentum, upside should be limited by 38.2% retracement of 1.3793 to 1.2412 at 1.2940 to bring fall resumption. On the downside, below 1.2552 minor support will argue that the recovery is completed and turn bias back to the downside for retesting 1.2412.
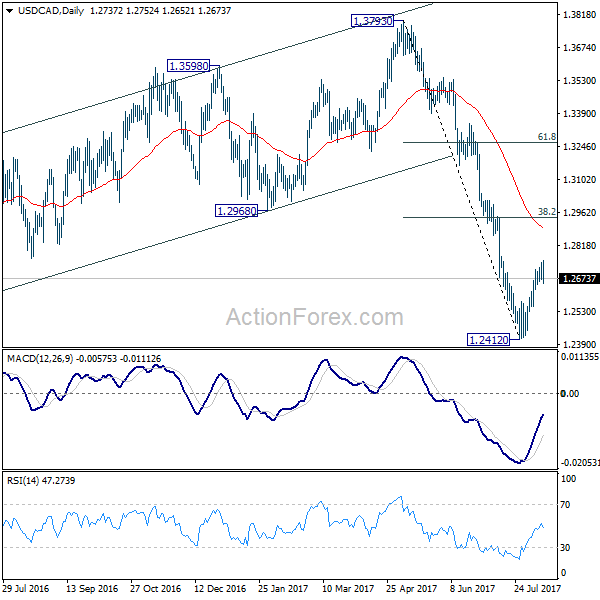
In the bigger picture, price actions from 1.4689 medium term top are seen as a correction pattern. Such corrective fall is still expected to extend to 50% retracement of 0.9406 to 1.4869 at 1.2048. At this point, we'd look for strong support from there to contain downside and bring rebound. Nonetheless, on the upside, sustained break of 1.2968, 38.2% retracement of 1.3793 to 1.2412 at 1.2940 will be the first sign of completion of the correction and will turn focus back to 1.3793 key resistance.
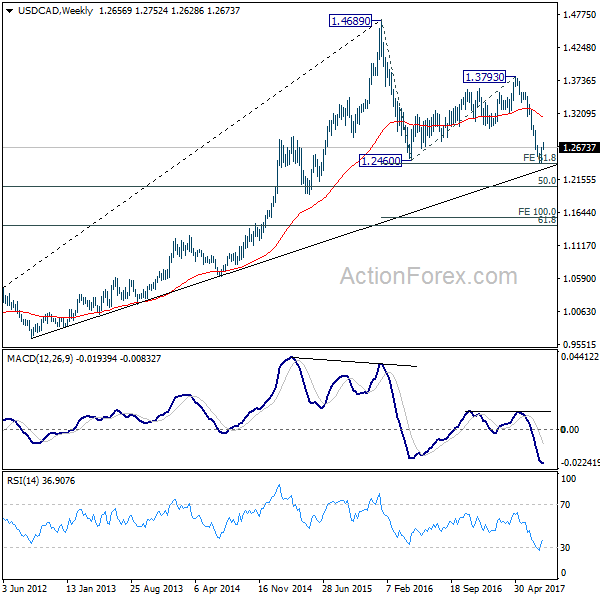
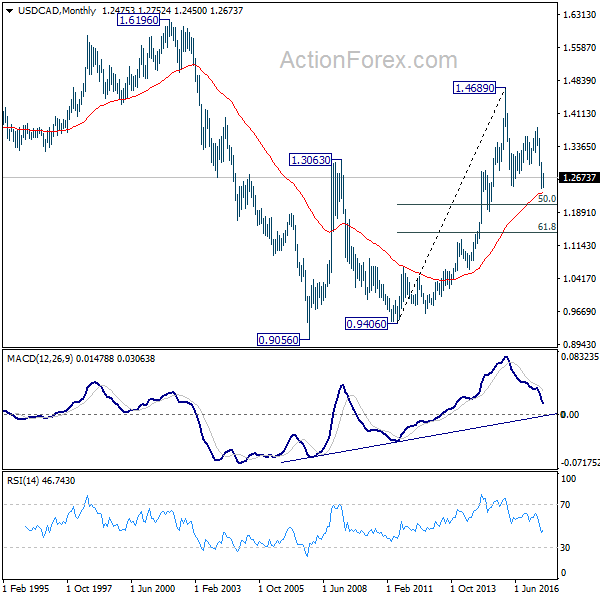
In the longer term picture, rise from 0.9056 (2007 low) is viewed as a long term up trend. It's taking a breath after hitting 1.4689. But such rise is expected to resume later to test 1.6196 down the road. But firm break of 50% retracement of 0.9406 to 1.4869 at 1.2048 will raise doubt over this view. In that case, the long term trend could have reversed.
GBP/JPY Weekly Outlook
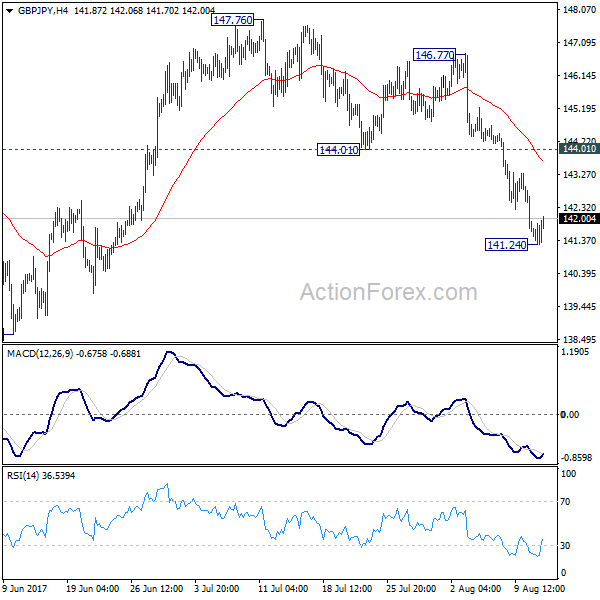
GBP/JPY's fall from 147.76 resumed last week and reached as low as 141.24. A temporary low is in place and initial bias is neutral this week first. But near term outlook remains mildly bearish as long as 144.01 support turned resistance holds. Below 141.24 will extend the fall from 147.76 to 138.65 support and below. As GBP/JPY is seen as staying in consolidation pattern from 148.42, we'd expect strong support from 135.58 to contain downside. On the upside, break of 144.01 will indicate completion of the decline from 147.76 and turn bias back to the upside.
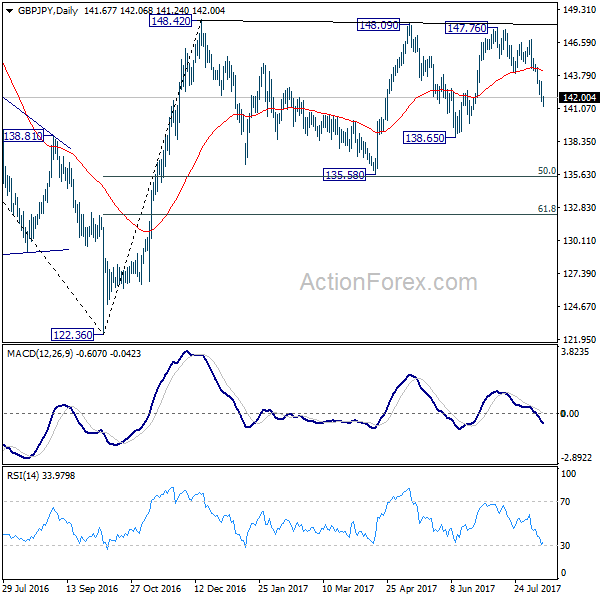
In the bigger picture, the sideway pattern from 148.42 is extending with another leg. But we'd expect strong support from 135.58 and 50% retracement of 122.36 to 148.42 at 135.39 to contain downside. Medium term rise from 122.36 is still expected to resume later. And break of 38.2% retracement of 196.85 to 122.36 at 150.43 will carry long term bullish implications. However, firm break of 135.58/39 will dampen the bullish view and turn focus back to 122.36 low.
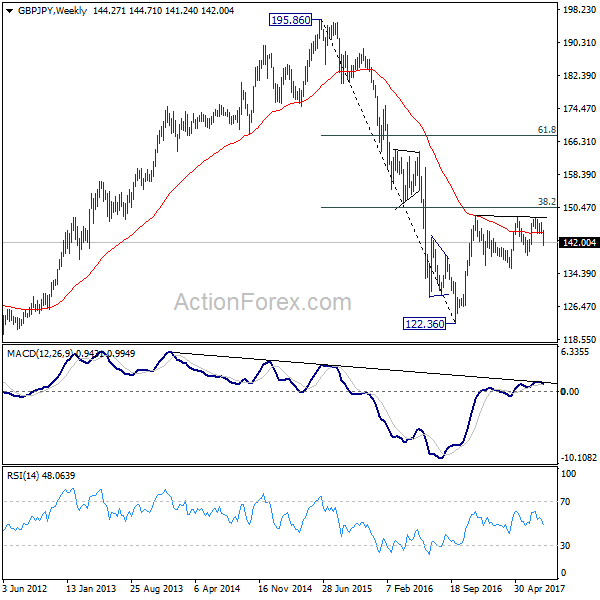
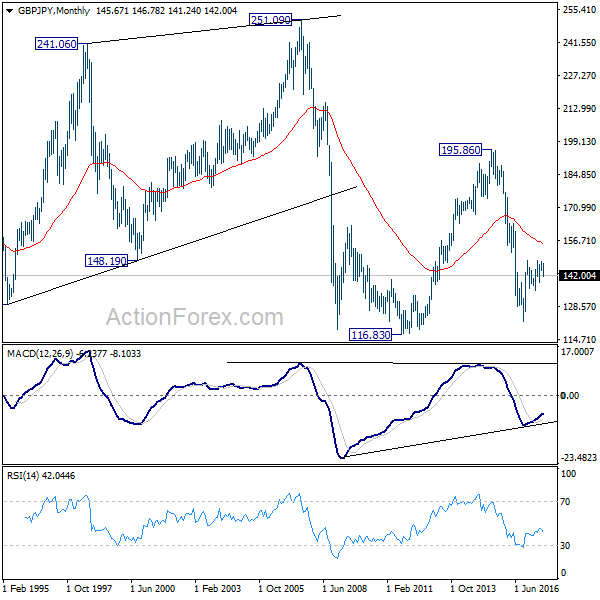
In the longer term picture, it remains to be confirmed if whole down trend from 195.86 has completed at 122.36 already and there is no confirmation yet. But in any case, firm break of 38.2% retracement of 195.86 to 122.36 at 150.43 would pave the way to 61.8% retracement at 167.78. And with that, the 55 month EMA will be firmly taken out which suggests that price actions from 116.83 is indeed a sideway pattern that could last more than a decade.
EUR/JPY Weekly Outlook
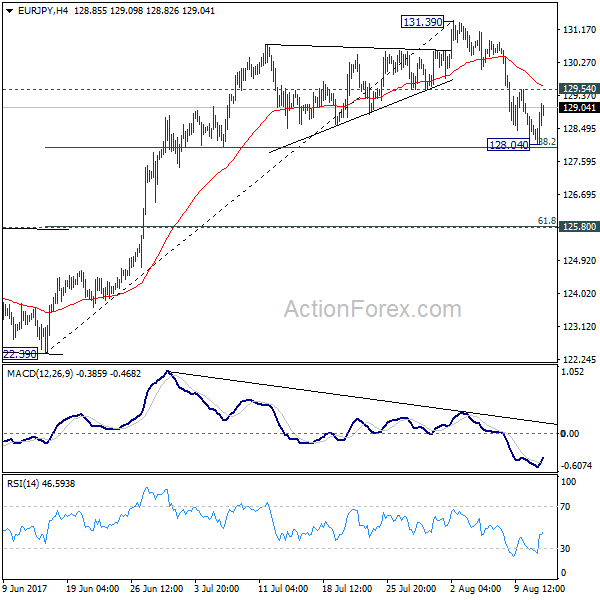
EUR/JPY's correction from 131.39 short term top extended to 128.04 last week. The cross then tried to draw support from 38.2% retracement of 122.39 to 131.39 at 127.95 and recovered. Initial bias is neutral this week first. Above 129.54 minor resistance will argue that the pull back is completed and will turn bias back to the upside for retesting 131.39. However, sustained break of 127.95 will bring deeper decline to 125.80 cluster support (61.8% retracement at 125.82) before completing the correction.
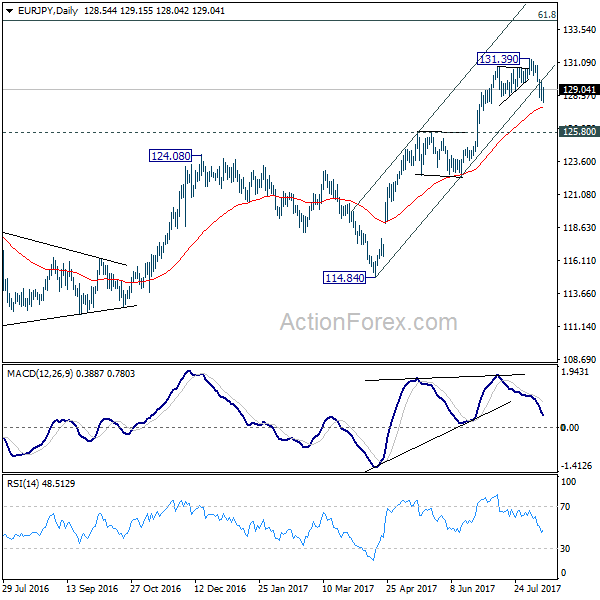
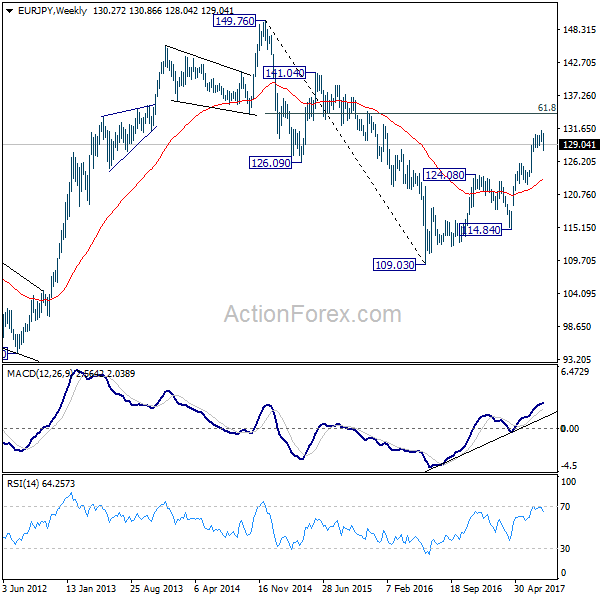
In the bigger picture, the down trend from 149.76 (2014 high) is completed at 109.03 (2016 low). Current rally from 109.03 should be at the same degree as the fall from 149.76 to 109.03. Further rise is expected to 61.8% retracement of 149.76 to 109.03 at 134.20. Sustained break there will pave the way to key long term resistance zone at 141.04/149.76. Medium term outlook will remain bullish as long as 124.08 resistance turned support holds.
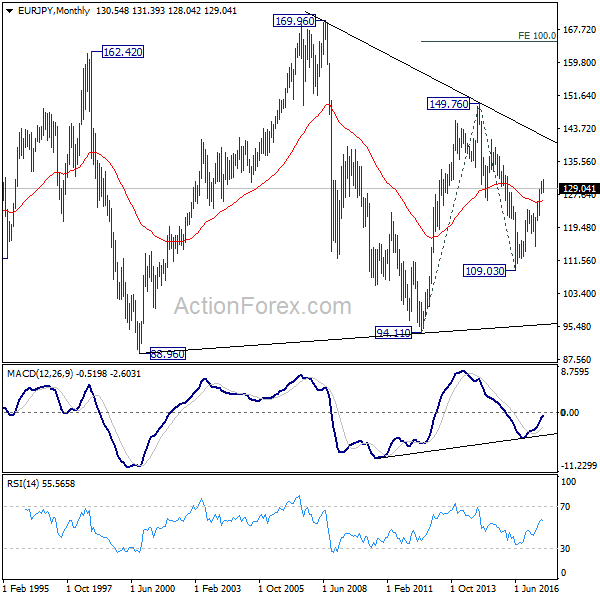
In the long term picture, at this point, there is no clear indication that rise from 109.03 is resuming that from 94.11. Hence, we'd be cautious on topping below 149.76 to extend range trading. Nonetheless, firm break of 149.76 will indicates strong underlying buying. In such case, EUR/JPY will target 100% projection of 94.11 to 149.76 from 109.03 at 164.68.
EUR/GBP Weekly Outlook
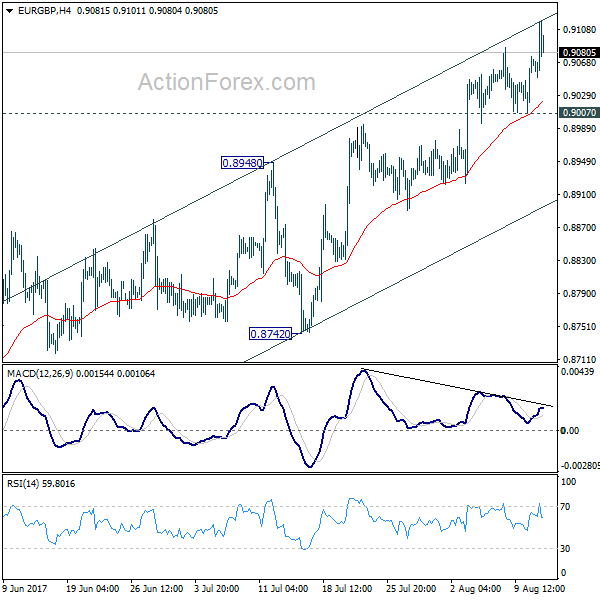
EUR/GBP's rally extended to as high as 0.9118 last week and there is no change in the bullish outlook. Initial bias stays on the upside this week as rise from 0.8312 would target a test on 0.9304 high. At this point, there is no clear sign of up trend resumption yet. Hence, we'll be cautious on strong resistance from 0.9304 to limit upside and bring another fall. On the downside, considering bearish divergence condition in 4 hour MACD, break of 0.9007 support will indicate short term topping. Intraday bias will then be turned back to the downside for 0.8742/8948 support zone.
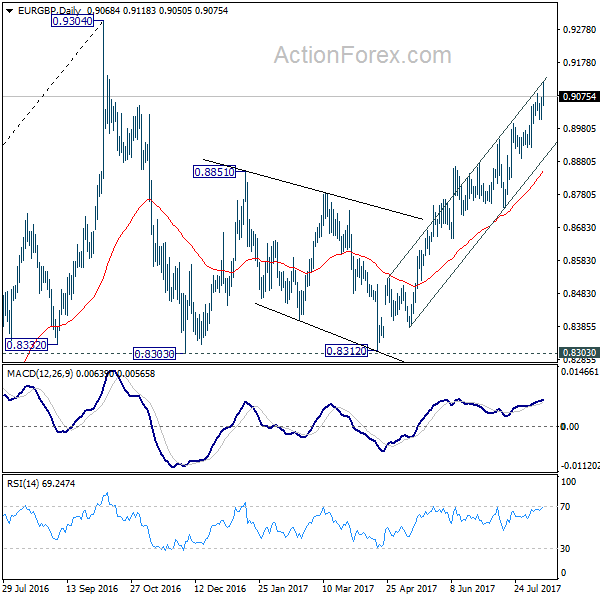
In the bigger picture, price actions from 0.9304 are viewed as a medium term corrective pattern. It's uncertain whether it is finished yet. But in case of another fall, we'd expect strong support from 0.8116 cluster support (50% retracement of 0.6935 to 0.9304 at 0.8120) to contain downside and bring rebound. Whole up trend from 0.6935 is expected to resume after consolidation from 0.9304 completes.
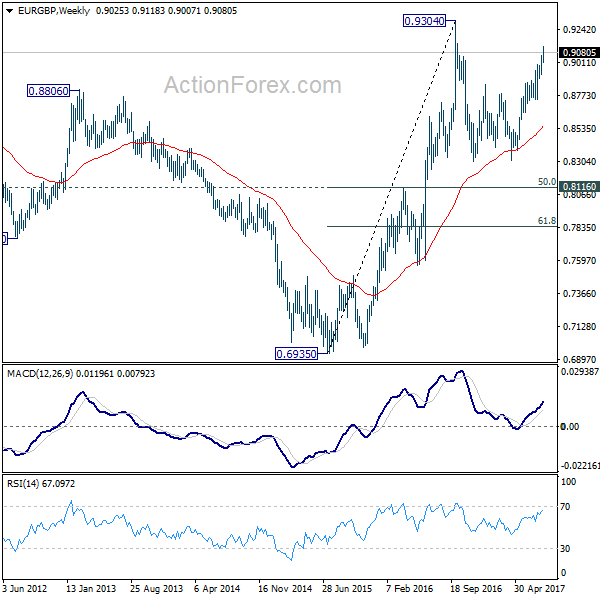
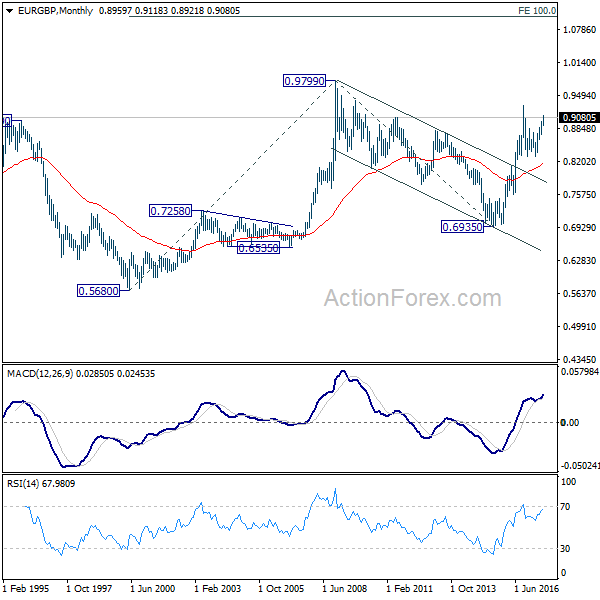
In the long term picture, firstly, price action from 0.9799 (2008 high) is seen as a long term corrective pattern and should have completed at 0.6935 (2015 low). Secondly, rise from 0.6935 is likely resuming up trend from 0.5680 (2000 low). Thirdly, this is supported by the impulsive structure of the rise from 0.6935 to 0.9304. Hence, after the correction from 0.9304 completes, we'd expect another medium term up trend to target 0.9799 high and above.
EUR/AUD Weekly Outlook
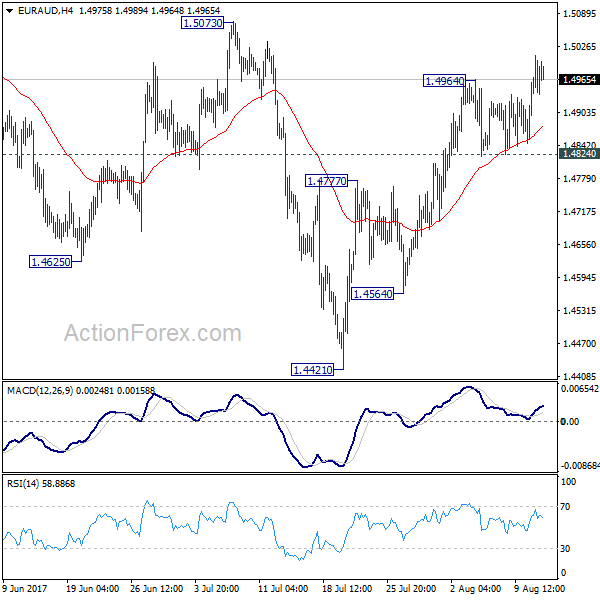
EUR/AUD's rise from 1.4421 resumed by taking out 1.4964 last week. Overall bullish near term outlook is unchanged. That is, correction from 1.5226 should have completed with three waves down to 1.4421 already. Initial bias remains on the upside this week for 1.5073 resistance first. Firm break there will likely resume the rise from 1.3624 and target 61.8% projection of 1.3624 to 1.5226 from 1.4421 at 1.5411 next. On the downside, however, break of 1.4824 support will dampen our bullish view and turn bias back to the downside for 1.4564 support instead.
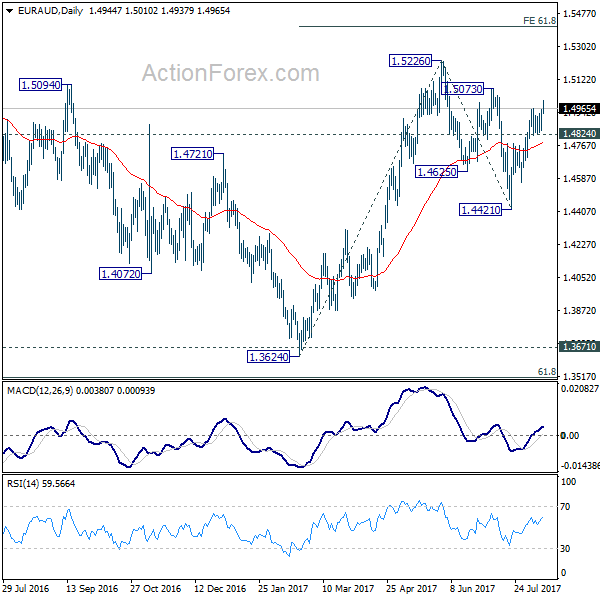
In the bigger picture, we're holding on to the view that corrective decline from 1.6587 medium term has completed at 1.3624. Rise from 1.3624 is expected to extend to retest 1.6587. The corrective structure of the fall from 1.5226 is affirming this view. Above 1.5226 will target a test on 1.6587 key resistance. However, another decline will dampen our view and would drag EUR/AUD lower to retest key support zone around 1.3624.
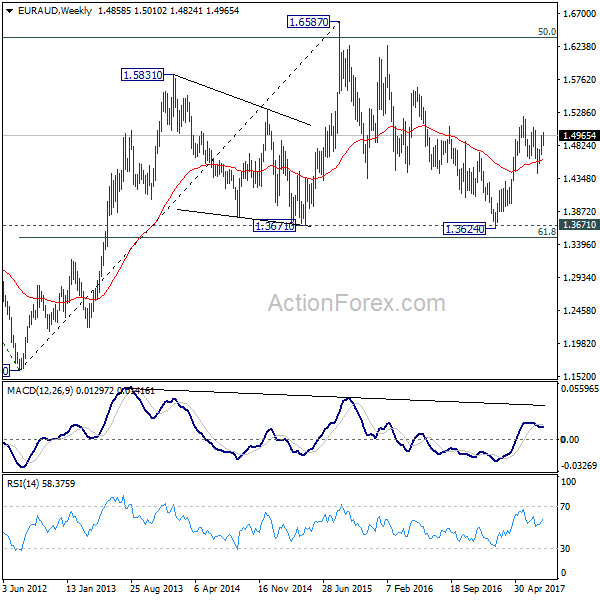
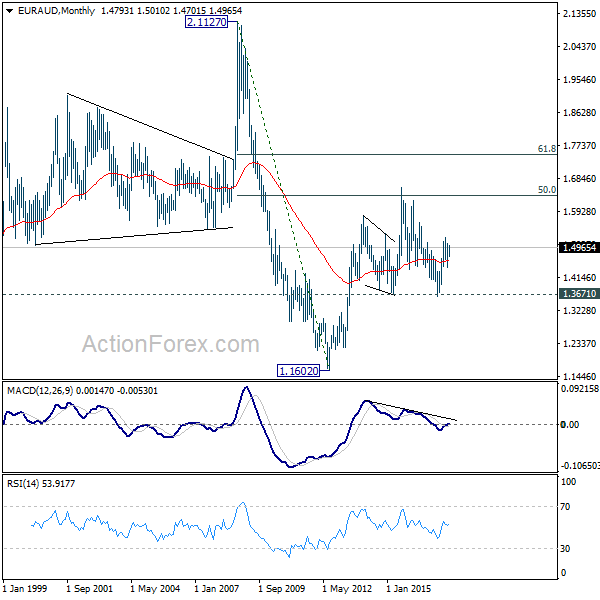
In the longer term picture, the rise from 1.1602 long term bottom isn't over yet. We'll keep monitoring the development but there is prospect of extending the rise to 61.8% retracement of 2.1127 to 1.1602 at 1.7488 and above. However, sustained trading below 1.3671 should confirm trend reversal and target 1.1602 long term bottom again.