Sample Category Title
Pound Steady as UK Manufacturing Production Matches Estimate
The British pound is almost unchanged in Wednesday trade. In the North American session, the pair is trading at 1.2995, down 0.18% on the day. On the release front, its has been a busy day on both sides of the pond. in the UK, Manufacturing Production improved to 0.0%, matching the forecast. The UK trade deficit jumped to GBP 12.7 billion, higher than the deficit of GBP 11.0 billion. Over in the US, inflation indicators disappointed, as PPI and Core PPI both declined 0.1%, missing their estimates of +0.1%. Unemployment claims rose to 244 thousand, higher than the estimate of 240 thousand. Inflation numbers will again be in focus on Friday, as the US releases CPI and Core CPI.
The British manufacturing sector is in trouble, based on a key indicator, Manufacturing Production. The indicator has managed just one gain in 2017, and the June reading of 0.00% is hardly good news. There was no relief from Britain's trade balance, as the deficit climbed to GBP 12.7 billion in June, marking a three month high. Investors remain concerned about Brexit, and the Bank of England has not shied away from warning that Britain's departure from the EU will hurt the British economy. One of the buzz words surrounding Brexit is "transition period", as some politicians have come out in favor of a period between Britain's departure and post-Brexit rules coming into effect. This would minimize the destabilizing effect of Brexit on financial companies, for example. On Wednesday, BoE Deputy Governor and PRA Chief Executive Sam Woods said that "some form of implementation period is desirable", although he stopped short of providing any specifics. The concept of a transition period could come up in talks between the two sides if the May government decides that it wants a transition period.
The markets are looking for some clarity from the Federal Reserve, which is showing signs of backtracking on another rate hike in 2017. Earlier this year, the Fed strongly hinted that it planned to raise rates three times in this year, but so far only pressed the rate trigger twice, in March and June. After the June hike, Fed Chair Janet Yellen shrugged off concerns over low inflation, saying that it was due to "transient" factors. However, inflation has not improved and the Fed has changed its tune. Last week, St. Louis Federal Reserve President James Bullard said he opposed further Fed hikes, warning that another hike would actually delay inflation from hitting the Fed's target of 2%. The Fed appears uncertain about when to raise rates, and predictably, this hesitancy is making investors skeptical that the Fed will act. There is little chance that the Fed will make any moves at the September and November meetings, and the odds of a rate hike in December are currently at 42%. Analysts are hoping for some insight into the Fed's thinking when the Fed Reserve Dallas President Robert Kaplan and Minneapolis President Neel Kashkari deliver speeches on Friday.
Dollar Down after Poor US Producer Prices and Rising Unemployment Claimants
While the dollar was struggling to recover as geopolitical risks between the US and the North- Korea heightened after the two presidents exchanged war of words, data on producer prices and initial jobless claims came in lower than expected, pushing the currency further down.
According to the figures published by the US Bureau of labor Statistics on Thursday, US PPI decreased by 0.1% in July month-on-month, driven mainly by declining energy and services prices. This downfall, which was the biggest one in 11 months, surprised analysts who expected producer prices to climb by 0.1% instead as with a month ago. On a yearly basis, PPI continued its downward path, slipping to 1.9% from 2% in June and missing the forecast of 2.2%.
Excluding energy and food prices, core PPI fell by 0.1% month-on-month, while analysts anticipated the index to rise by 0.1 percentage points to 0.2%. The annual rate stood at 1.8%, which was below the 1.9% observed last month and the forecast of 2.1%.
Regarding labor data, the number of people applying for unemployment benefits for the first time rose by 3,000 to 244,000 (seasonally adjusted) during the week ending August 5. Analysts expected initial jobless claims to decline to 240,000. However, the 4-week average figure dropped by 1,000 to 241,000.
Taking the above numbers into account, markets are less confident that the Fed will deliver another rate hike this year, as Fed policymakers will want to see evidence that inflation is moving back towards 2% goal before raising rates further. The next key data on focus will be tomorrow's CPI figures which should shed more light on the path of the US inflation.
Looking at the reaction in the forex markets, the dollar weakened against its rivals following the release of the data. The dollar index fell to a session low of 93.35 from 93.56 before it climbed to 93.40. Euro/dollar edged up from 1.1747 to 1.1754, while the yen gained the most, with dollar/yen sinking by 0.37% to an eight-week low of 109.31.
Strong Data on Industrial Production Supported GBP/USD
The EUR/USD could not continue its fall due to the suggestions of increased volatility following the release of the consumer price index in the US. The average growth forecast is around 0.2% in July but considering the rebound of oil prices, we may see a faster increase in inflation. In such cases, the probability of a third rate hike by the Fed before the end of the current year may be higher. That in turn may result in a declining price for the EUR/USD. Some pressure on the greenback was provided by the weaker data on initial unemployment claims in the US which have grown to 244.000 thousand vs an anticipated 240.000. Moreover, the producer price index in America reduced by 0.1% in the prior month compared to an anticipated increase of 0.1%.
The RBNZ has published its statement on monetary policy according to which the strong national currency may hurt the pace of economic expansion in New Zealand. Inflation in the country is slowing but at the moment its central bank does not see the reasons for additional monetary easing in the country. Considering the US dollar strengthening and the weaker kiwi, we may see further declines in the nearest future.
The British pound restored some previously lost ground after the statistics on industrial production growth in the UK cheered the bulls. Thus, the indicator increased by 0.5% which is 0.4% more than expected. On the other hand, positive dynamics was restrained by disappointing news on growing trade balance deficit of 12.7 billion pounds in June vs 11.0 billion pounds predicted earlier.
EUR/USD
The single currency price was again unable to overcome the closest support at 1.1700. Currently, the quotes approached angled resistance and in the case of its breaking through, we may see a further increase to 1.1800 and 1.1900. On the other hand, in the case of breaking through 1.1700, the fall is likely to continue to 1.1620 or even 1.1500. Volatility is likely to remain high during the rest of the week.
NZD/USD
The kiwi is moving along the lower limit of the descending channel. Fixing below the important level of 0.7300 may become the stimulus for continued decline to 0.7200. On the opposite, in case of a price return above 0.7300, we are likely to see the rising dynamics to the potential target near the upper limit of the channel and the resistance at 0.7375. The MACD signal line sharply rising and crossing the zero mark may be an additional stimulus for the bulls.
GBP/USD
The pound sterling keeps moving within the range of 1.2950-1.3050. Recently the quotes touched an important inclined support line and fixing below it at 1.2950 may provoke the sharp fall to 1.2880 and 1.2800. We should note the possibilities for opening long positions with potential targets at 1.3150 and 1.3250 and a short stop below 1.2950. Volatility may be high tomorrow due to the release on inflation data in the US.
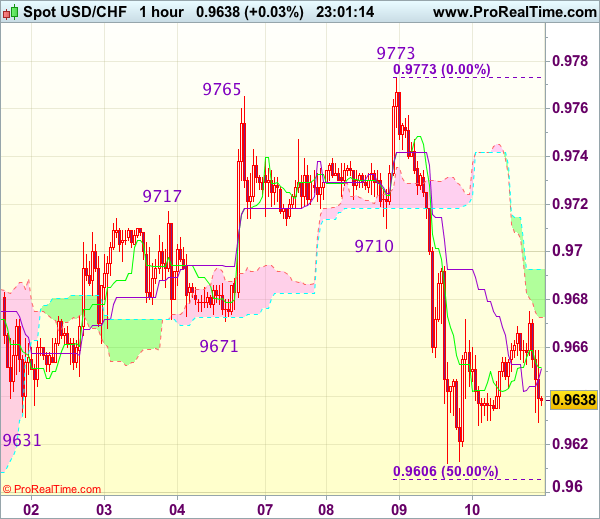
Trade Idea Wrap-up: USD/CHF – Sell at 0.9710
USD/CHF - 0.9639
Most recent candlesticks pattern : N/A
Trend : Near term up
Tenkan-Sen level : 0.9652
Kijun-Sen level : 0.9652
Ichimoku cloud top : 0.9693
Ichimoku cloud bottom : 0.9673
Original strategy :
Sell at 0.9725, Target: 0.9625, Stop: 0.9760
Position : -
Target : -
Stop : -
New strategy :
Sell at 0.9710, Target: 0.9610, Stop: 0.9745
Position : -
Target : -
Stop : -
As the greenback recovered after yesterday’s selloff to 0.9612, suggesting consolidation above this level would be seen and gain to 0.9700 cannot be ruled out, however, as top has been formed at 0.9773, reckon upside would be limited to 0.9715-25 and bring another decline, below said support at 0.9612 would add credence to this view and extend the fall from 0.9773 top for retracement of recent upmove to 0.9605-10 (50% Fibonacci retracement of 0.9438-0.9773), then 0.9580 but reckon 0.9665 (61.8% Fibonacci retracement) would hold from here.
In view of this, we are looking to sell dollar on subsequent recovery as 0.9710 (previous support turned resistance) should limit upside. Only a break of this week’s high at 0.9773 would abort and revive bullishness for the rise from 0.9438 to extend gain to 0.9800-10.
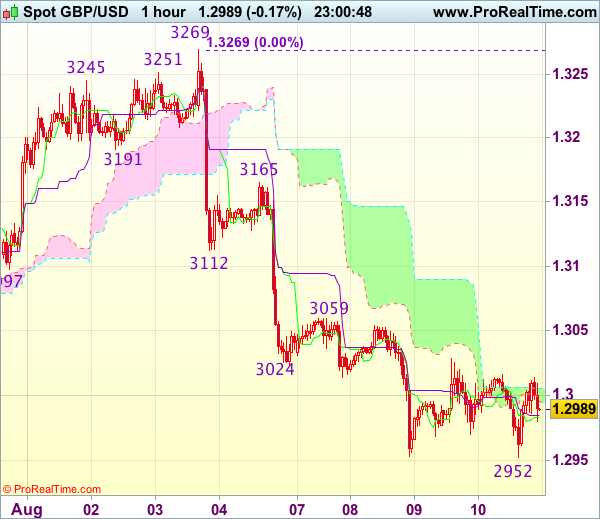
Trade Idea Wrap-up: GBP/USD – Stand aside
GBP/USD - 1.2983
Most recent candlesticks pattern : N/A
Trend : Near term down
Tenkan-Sen level : 1.2983
Kijun-Sen level : 1.2984
Ichimoku cloud top : 1.3005
Ichimoku cloud bottom : 1.2995
New strategy :
Stand aside
Position : -
Target : -
Stop : -
Although cable fell marginally to 1.2952, lack of follow through selling and current rebound suggest further consolidation would take place and another bounce to 1.3025-30 cannot be ruled out, however, reckon upside would be limited to resistance at 1.3059 and price should falter below 1.3085-90 and bring another decline later.
On the downside, below support at 1.2952-53 would signal recent fall from 1.3269 top has resumed and extend weakness to previous chart support at 1.2933 but reckon 1.2900 would hold from here, risk from there has increased for a rebound to take place later.
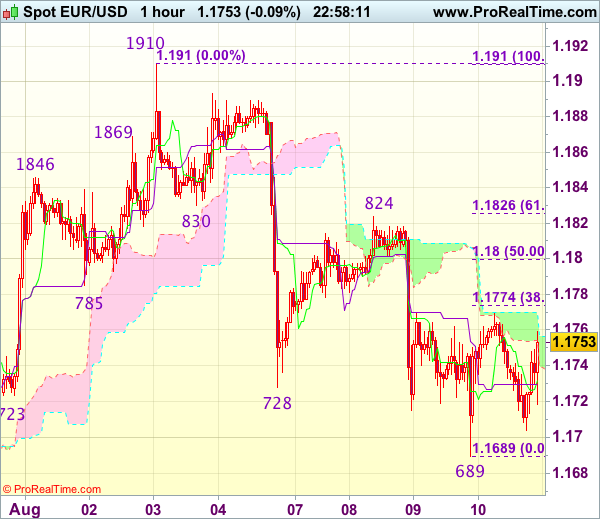
Trade Idea Wrap-up: EUR/USD – Hold short entered at 1.1770
EUR/USD - 1.1748
Most recent candlesticks pattern : N/A
Trend : Near term up
Tenkan-Sen level : 1.1732
Kijun-Sen level : 1.1737
Ichimoku cloud top : 1.1757
Ichimoku cloud bottom : 1.1740
Original strategy :
Sold at 1.1770, Target: 1.1670, Stop: 1.1770
Position : - Short at 1.1770
Target : - 1.1670
Stop : - 1.1770
New strategy :
Hold short entered at 1.1770, Target: 1.1670, Stop: 1.1770
Position : - Short at 1.1770
Target : - 1.1670
Stop : - 1.1770
As the single currency found support at 1.1689 yesterday and rebounded, suggesting consolidation above this level would be seen, however, as long as resistance at 1.1770 holds, bearishness remains for the fall from 1.1910 top to bring retracement of early upmove, hence further weakness to 1.0670 would be seen but reckon support at 1.1650 would remain intact due to oversold condition.
In view of this, we are holding on to our short position entered at 1.1770. Above 1.1800-05 would risk another test of 1.1824-30 resistance but only break there would signal the erratic fall from 1.1910 has ended, bring further gain to 1.1855-60 first.
Risk-off Weighs on Euro; Pound Up after UK Data; Dollar Mixed
Market sentiment remained largely in risk-off mood on Thursday as the latest escalation of tension between North Korea and the United States showed no sign of dissipating. North Korea said today it plans to fire four missiles near the US territory of Guam in the Pacific Ocean, branding President Trump's warning that North Korean threats will be met with "fire and fury" as "a load of nonsense".
The heightened geopolitical anxiety continued to drive gold and the Japanese yen higher as investors sought safety, though the Swiss franc was weaker. Gold extended its gains into a third day, hitting a 9-week high of $1287.73 an ounce. The yen also advanced further after a brief pull-back overnight. However, the Swiss franc fell broadly against other majors as traders were wary of a possible SNB intervention after yesterday's 1% jump against the dollar and the euro. The dollar was last up 0.3% at 0.9660 francs, while the euro was trading marginally higher at 1.1339 francs.
The euro was struggling on Thursday as it came under pressure from the latest bout of risk-off, with traders seeking to unwind some of their positions following the strong rally seen over the past month. The single currency fell to a more than one-week low of $1.1687 yesterday before rebounding to a high of $1.1769 in Asian trading today. It since drifted back towards the $1.17 level before being pushed up by weak US data. The euro was last trading at $1.1733 and was also down on the day against the yen and the pound at 128.61 yen and 0.9023 pounds.
The pound benefited from the euro's weakness via euro/pound cross flows, and was additionally supported by positive UK data released earlier in the day. Industrial output in the UK rose by 0.5% month-on-month in June, beating expectations of a 0.1% increase. On an annual basis, output rose by 0.3%, up from -0.2% in May. Data for the manufacturing sub-component was not as impressive however, as manufacturing production was flat over the month in June, in line with expectations. Trade figures also disappointed as the UK's deficit in goods widened to £12.7 billion in June, missing estimates of £11 billion, though the prior month's deficit was revised slightly lower to £11.31 billion.
Sterling reversed higher from a three-week low of $1.2950 touched prior to the data to climb to just above the $1.30 level in afternoon European trading.
The US dollar meanwhile remained sluggish, with the dollar index being unable to hold on to modest gains from earlier in the session. The greenback faced fresh downside pressure after US producer prices declined the most in 11 months in July.
The producer price index (PPI) for final demand fell by 0.1% m/m in July instead of rising by 0.1% as expected. The 12-month rate missed forecasts too as it dipped to 1.9% from 2.0%. Excluding food and energy components, PPI was also down 0.1% m/m in July, while the annual rate moderated to 1.8% from 1.9%, missing forecasts of 2.1%.
Weekly jobless claims also came in below expectations, though not by much, and still pointed to a strong labour market. Initial claims for unemployment benefits rose by 244k in the week starting July 24. Expectations were for 240k and compares with a revised 241k in the prior week.
The dollar hit a new eight-week low against the yen after the data, dropping to as low as 109.32 yen. The dollar index was slightly up though at 93.62. The US currency found only limited support from a speech by New York Fed President William Dudley, who reiterated the Fed's expectations that inflation will rise to 2% over the medium term.
In commodities, oil prices continued to edge higher, helped by OPEC's latest forecasts for demand. In its latest monthly report, OPEC raised its forecasts for global demand by around 200,000 barrels a day for 2017 and 2018. However, it also showed compliance by OPEC members to the output deal decreased to 86% in July from 96% in June, and higher production from Libya and Nigeria led to an overall increase in OPEC's total output in July. WTI crude was up 0.3% at $49.72 a barrel in late European session, while Brent crude was 0.8% firmer at $53.13 a barrel.
The higher oil prices were of little boost to the Canadian dollar, which continued to move away from its July two-year highs. Dollar/loonie briefly fell sharply to 1.2668 after the US data before quickly bouncing back to trade around 1.2715. There was not much reaction to Canadian housing data, which showed new home prices rose by 0.2% in June, missing expectations of 0.4%.
How the Markets Could React to a North Korea Strike
It's difficult to interpret a rational response to an untested modern day warfare strategy using nuclear weapons. Nevertheless, below are a number of possible market scenarios under 'flash' and 'short-term' constraints.
A nuclear flashpoint is difficult to factor as its considered a non-traditional build up to conflict.
It's assumed that the U.S would be required to destroy North Korea's ability to retaliate in one massive short onslaught, not just its ballistic missile capability. Any strike of this scale would require a massive deployment of battleships and aviation assets to the region.
There are two main reason for that:
- Seoul, South Korea lies less than -100km from the border. It is within artillery strike.
- Japan is also within range of missiles and could expect a heavy bombardment.
In a war scenario we could expect the following:
Under Flash Conditions:
- USD/JPY could rally immediately above ¥130.00 (possibly ¥140+) and the Nikkei could drop by at least ~20%. By day's end, JPY may "not" be a safe haven. However, negating some of the 'big' dollar moves will be the fact that Japan is a net overseas investor, both on the retail and institutional levels. Thus, investors who have their assets in 'non-yen' is at risk because they are exposed to FX volatility - expect many domestic investors to want to reduce their risk by unwinding some of their overseas investments.
- USD/Asia - all Asian currencies could depreciate aggressively ~10%+
- ASIAN stock markets could collapse by at least ~10% and probably more in China and Hong Kong.
- KRW will most likely be untradeable due to liquidity constraints.
- With trade routes, east and west, expected to be severely disrupted, could be particularly bad for Australia. Expect the ASX to drop by ~10-20% as a high beta to China and its main export market. Expect the AUD to come under severe pressure and drop by at least ~10%.
- USD is expected to appreciate by at least ~5 to 10% against G10 pairs for starters.
- Global stock markets ex-Asia and APAC could drop by ~5 to 10%.
- Oil will be expected to rally aggressively, up to $70-90+ a barrel and then some
- CHF could appreciate by ~10% crushing the SNB along the way. It's already posted its biggest daily rise in 2 and a half years this week on 'carry' trade unwinds.
- Gold will move higher by a minimum of ~20% to $1500, and expected to go much higher. Similar moves will be seen in Silver and Platinum.
- Base metals could collapse as demand from China plummets, or because it is unsafe to transport raw materials.
- Food prices will suffer a knee jerk reaction higher as Asia scrambles for supplies to stockpile, but probably finds that no one will be willing to ship them.
Under Short-Term conditions:
- G7 Central Banks will be expected to produce massive cuts in interest rates to head of a liquidity crisis.
- U.S Treasury's, Bunds, Gilts yields will collapse - Bunds going strongly negative and U.S 10-year yields to plummet towards +1 - 1.5%.
- On collateral damage to either South Korea or Japan could see a reversal of some of the USD bets into EUR as a safe haven.
Are Further Gains in WTI Limited?
Oil prices drifted slightly higher on Wednesday, after the weekly US EIA crude inventory data showed a bigger-than-anticipated drawdown. The precious liquid traded in a relatively quiet manner so far this week, despite the OPEC & non-OPEC meeting in Abu Dhabi on Monday and Tuesday. Even though members that have been overproducing in recent months reaffirmed their commitment to comply with the production numbers agreed in May, these signals probably fell short of impressing investors, evident by oil being unable to assume a clear direction in the aftermath.
Moving forward, besides the weekly inventory data, there aren't that many items on the agenda that could drive oil prices in the next days. The next OPEC & non-OPEC compliance meeting is scheduled on the 21st of August. Until then, oil's forthcoming direction may be primarily decided by movements in the US dollar. Tomorrow's US CPI data could prove critical for the currency's forthcoming direction. A rebound in US inflation could support the greenback and thereby put a lid on any near-term oil rallies.
WTI traded higher during the European morning Thursday, but it still remains within a narrow range between the support of 48.60 (S1) and the resistance of 50.35 (R1). Having in mind that the price is trading above the short-term uptrend line taken from the low of the 21st of June, and also above the upper bound of the downside channel that contained the price action from the beginnings of February until the 7th of July, we consider the short-term outlook to be cautiously positive. We expect the bulls to challenge the 50.35 (R1) line soon, where a decisive break is possible to set the stage for extensions towards the next key obstacle of 51.50 (R2).
Shifting our attention to the short-term momentum indicators, we see that both of them support the case for oil prices to continue trading higher, at least for a while. The RSI is back above 50 and is now headed towards its 70 line, while the MACD has bottomed near zero, crossed above its trigger line, and is now pointing up.
As for the broader picture, even if the price continues higher in the short run, we remain sceptical with regards to the establishment of a long-term healthy uptrend. WTI is now getting closer to the lower end of the 51.50-55.00 range, where we believe US shale producers may be attracted to increase production.
Trade Idea Wrap-up: USD/JPY – Stand aside
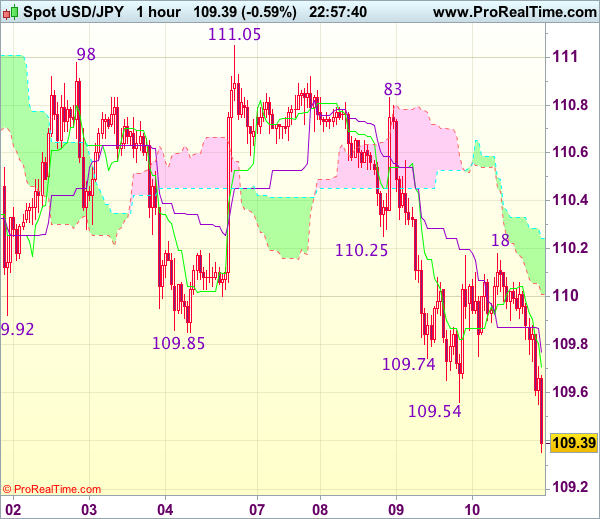
USD/JPY - 109.39
Most recent candlesticks pattern : N/A
Trend : Near term down
Tenkan-Sen level : 109.70
Kijun-Sen level : 109.76
Ichimoku cloud top : 110.24
Ichimoku cloud bottom : 110.01
New strategy :
Stand aside
Position : -
Target : -
Stop : -
The greenback met renewed selling interest at 110.18 and has dropped again, suggesting recent selloff is still in progress and bearishness remains for weakness to 109.20-25, then towards 109.00, however, near term oversold condition should prevent sharp fall below 108.70-75 today and reckon 108.50 would hold from here, bring rebound later.
In view of this, would not chase this fall here and would be prudent to stand aside in the meantime. Above the Kijun-Sen (now at 109.76) would defer and risk recovery to 110.00 but only break of said resistance at 110.18 would signal low is formed instead, bring further gain towards 110.45-50.