
Sample Category Title
Daily Technical Analysis: EUR/USD Breaks Falling Wedge And Starts Wave B Correction
Currency pair EUR/USD
The EUR/USD bearish retracement indeed turned at the support zone (blue lines) as expected in yesterday's wave analysis. Considering the divergence on this 4 hour chart, the bearish price action could be just one part of larger ABC (purple) retracement within wave 4 (green).
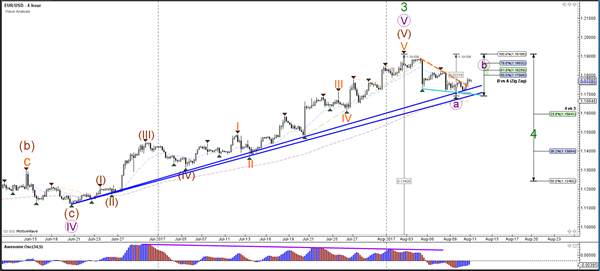
The EUR/USD broke above the resistance (dotted orange) of yesterday's falling wedge chart pattern and could moving towards the Fibonacci levels of wave B vs A which could act as potential resistance spots.
Currency pair USD/JPY
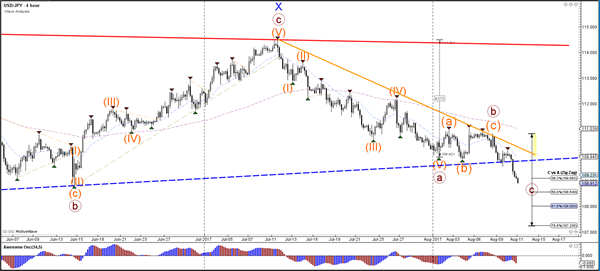
The USD/JPY is breaking below the larger support trend line (blue) from the daily support at 109.50. This bearish break could indicate a downtrend continuation within wave C (brown).
The USD/JPY is breaking below the larger support trend line (blue) from the daily support at 109.50. This bearish break could indicate a downtrend continuation within wave C (brown).
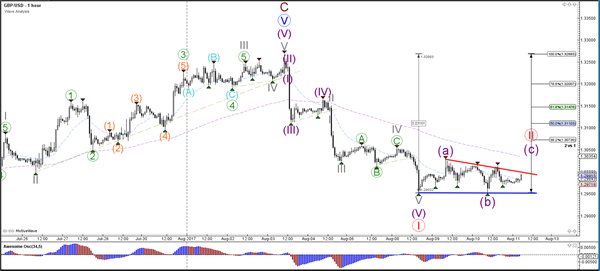
Currency pair GBP/USD
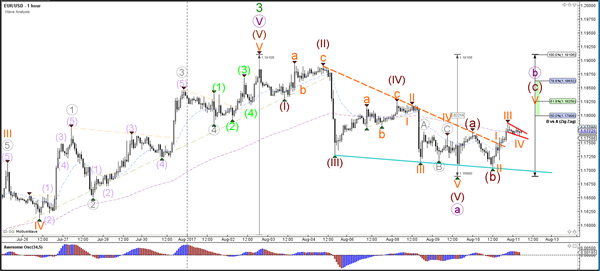
The GBP/USD seems to have completed 5 bearish waves within wave 1 (red). The Cable could be building a potential bullish retracement as part of a wave 2 (red).
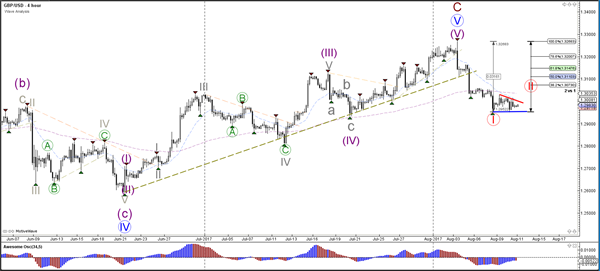
The GBP/USD has support and resistance trend lines which could offer breaking spots for the Cable. A bullish breakout could lead to a wave C (purple) whereas a bearish break could see the downtrend continue.
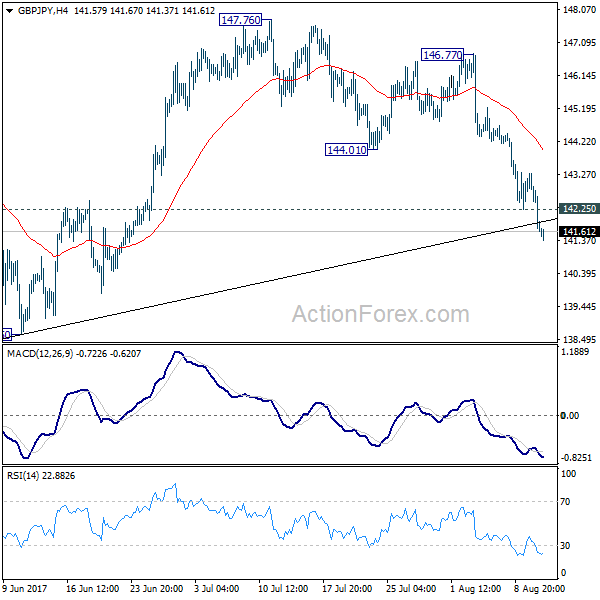
GBP/JPY Daily Outlook
Daily Pivots: (S1) 141.12; (P) 142.22; (R1) 142.82; More
GBP/JPY reaches as low as 141.37 so far as decline from 147.76 continues. Intraday bias stays on the downside for deeper fall. Sustained trading below trend line support will pave the way to 135.58/138.65 support zone. As GBP/JPY is seen as staying in consolidation pattern from 148.42, we'd expect strong support from 135.58 to contain downside. On the upside, above 142.25 minor resistance will turn intraday bias neutral first. But near term outlook will remain bearish as long as 144.01 support turned resistance holds.
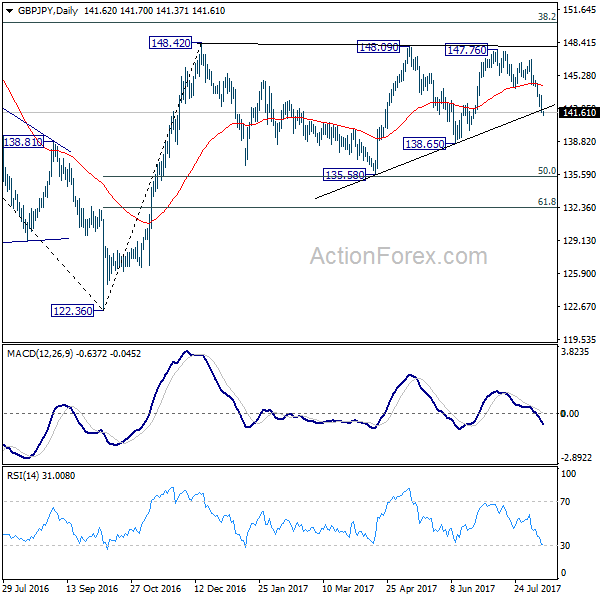
In the bigger picture, the sideway pattern from 148.42 is extending with another leg. But we'd expect strong support from 135.58 and 50% retracement of 122.36 to 148.42 at 135.39 to contain downside. Medium term rise is still expected to resume later. And break of 38.2% retracement of 196.85 to 122.36 at 150.43 will carry long term bullish implications. However, firm break of 135.58/39 will dampen the bullish view and turn focus back to 122.36 low.
Yen Surges Further as Trump Stepped Up His Verbal Combat With North Korea
Risk aversion continues to dominate the global financial markets. DOW dropped -204.69 pts, or -0.93% overnight to close at 21844.01, comparing to intra-week high at 22179.11. S&P 500 also lost -35.81 pts, or -1.45% to close at 2438.21. Selloff in equities extends in Asian session. While Japan is on holiday, but Hong Kong HSI is trading down -1.8%, Korean KOSPI down -1.7% and Australia ASX 200 down -1.3%. In the currency markets, Japanese yen remains the strongest currency, followed by Swiss Franc and commodity currencies are all under pressure. Gold is staying firm above 1290 and is still on course for 1300 handle. WTI crude oil, however, is heading back to 48 after breaching 50 briefly.
Trump: They should be very nervous
Selloff in stocks and rally in Yen picked up steam again after US President Donald Trump stepped up his verbal combat with North Korea. Trump warned that "they should be very nervous, because things will happen to them like they never thought possible, OK?" And he said North Korea Kim Jong UN "has been pushing the world around for a long time". And, Trump stood by his "fire and fury" threat on North Korean and went further to say that the statement maybe "wasn't tough enough".
New York Fed Dudley: Take time to recent weak inflation readings to drop out
New York Fed President William Dudley said that inflation will "start to move higher in the medium term". However, he also noted inflation "probably not get all the way back to sort of 2% on a year-on-year basis". He noted that there have been "very weak inflation readings for a number of months in a row". And it will "take some time" for them to "drop out of" the annual readings. The economy will have a "continued moderate growth trend". However, the "comparatively modest" wage growth argues that "productivity growth has been sluggish compared to historical experience."
RBA Lowe: Next move will be up rather than down
RBA Governor Philip Lowe told the parliament today that the next move in interest rate will be "up rather than down", but that is "quite some time away". He referred to market pricing that "implies greater probability of a rate rise than a rate reduction". Also, another implication is that "the next move in interest rates is a long way out". Lowe said they're "both reasonable assumptions". Meanwhile, he also pointed to the high exchange rate as having negative impact on the outlook. He noted that "further appreciation, all else constant, would cause a slower pick-up in inflation and slower progress in reducing unemployment."
On the data front
New Zealand business NZ manufacturing index dropped to 55.4 in July. Germany will release CPI final in European session. US will release July CPI later in the day.
GBP/JPY Daily Outlook
Daily Pivots: (S1) 141.12; (P) 142.22; (R1) 142.82; More
GBP/JPY reaches as low as 141.37 so far as decline from 147.76 continues. Intraday bias stays on the downside for deeper fall. Sustained trading below trend line support will pave the way to 135.58/138.65 support zone. As GBP/JPY is seen as staying in consolidation pattern from 148.42, we'd expect strong support from 135.58 to contain downside. On the upside, above 142.25 minor resistance will turn intraday bias neutral first. But near term outlook will remain bearish as long as 144.01 support turned resistance holds.
In the bigger picture, the sideway pattern from 148.42 is extending with another leg. But we'd expect strong support from 135.58 and 50% retracement of 122.36 to 148.42 at 135.39 to contain downside. Medium term rise is still expected to resume later. And break of 38.2% retracement of 196.85 to 122.36 at 150.43 will carry long term bullish implications. However, firm break of 135.58/39 will dampen the bullish view and turn focus back to 122.36 low.
Economic Indicators Update
| GMT | Ccy | Events | Actual | Forecast | Previous | Revised |
|---|---|---|---|---|---|---|
| 22:30 | NZD | Business NZ Manufacturing Index Jul | 55.4 | 56.2 | 56 | |
| 6:00 | EUR | German CPI M/M Jul F | 0.40% | 0.40% | ||
| 6:00 | EUR | German CPI Y/Y Jul F | 1.70% | 1.70% | ||
| 12:30 | USD | CPI M/M Jul | 0.20% | 0.00% | ||
| 12:30 | USD | CPI Y/Y Jul | 1.80% | 1.60% | ||
| 12:30 | USD | CPI Core M/M Jul | 0.20% | 0.10% | ||
| 12:30 | USD | CPI Core Y/Y Jul | 1.70% | 1.70% |
Market Morning Briefing: Pound Has Come Off A Bit
STOCKS
Overall the stock indices are all in a corrective mode and could possibly take some time to recover. We need to see if the supports near current levels hold for Dax, Nikkei and Nifty.
Dow (21844.01, -0.93%) fell sharply from levels near 20000. The index could possibly test 21750/00 over the next couple of sessions before again rising back towards 22000.
Dax (12014.30, -1.15%) seems to be trading near interim support and could bounce back in the next few sessions.
Shanghai (3230.61, -0.95%) is expected to maintain the sideways movement for a few more sessions before trying to rise higher. For now, trade within the 3220-3300 region looks likely.
Nikkei (19729.74, -0.05%) is also testing immediate support on the 3-day candle charts. While that holds, there is some scope of bouncing back towards 20200; else a fall towards 19400 and lower could be seen within the next 1-2 weeks.
Nifty (9820.25, -0.89%) has tested an important medium term support near 9775 yesterday and if it fails to remain above 9775 it could be indicative of a sharp fall in the coming sessions towards levels near 9600-9400. Only if it sustains above 9775, we may expect a retest of levels near 10000 in the near term.
COMMODITIES
Gold (1291) has risen in line with our expectations and broke above the immediate resistance of 1285 thus it might continue the rally towards 1300-1315. Failure to rise above 1300 may push it back to1280 and 1267 respectively. We will remain bullish on Gold while it is trading above 1260-65 regions.
Silver (17.06) is trading above the higher end of the previous range of 16.00-17.00. Immediately resistance is at 17.22 levels, where we might see some weekly profit taking.
Copper (2.88) has been taking pause for the last 2 sessions but the trend remains firmly up and the target of 3.00 and the support of 3.12 remain unchanged. Only a close below 2.78 levels could negate the short term bullish view.
Brent (51.70) and WTI (48.22) had moved lower in line with our expectations. Brent needs a break above the immediate resistance of 53.00 and WTI, above 50.50 to extend their respective rally to 56 and 54. Othwise we might see consolidation at 50/brent and 46.50/WTI levels to gather fresh buying momentum.
FOREX
Dollar Index (93.33) is trading within a narrow range between 93-94.10 and a weekly close above 94.10 could open up 95 and 96.30 levels as well. Although the larger trend is still down but we have to a little cautious beyond 94.10 region to identify the possibility of a change in trend in short term time frame.
Euro (1.1762) is still continuing its corrective behavior and a upside possibilities can be considered only on a break above 1.1800-25 regions. Till then, the downside risk for 1.1650-00 remains greater.
Dollar Yen (108.92) has broken below our important support levels near 109.50. There are chances of seeing fresh fall towards 108.10 in the next few sessions. Near term looks bearish.
Pound (1.2983) has come off a bit. 1.3050 is an important levels to watch for and while the price remains below 1.3050, we will have to allow for a fall towards 1.2930 or even 1.2850 in the coming sessions.
Aussie (0.7849) is headed towards 0.7835 which is an immediate interim support. On a break below 0.7835, we my have to consider a fall towards 0.7760 in the coming sessions.
Dollar Rupee (64.08) closed just below our initial target of 64.10/12 yesterday but on the offshore market the currency pair is trading near 64.25 that we had been looking for on a break above 64.12. Dollar rupee could open higher on the Official market but we will have to keep an eye on whether it breaks above 64.25/27 or not. A break above 64.27 could open up fresh rise on the upside.
INTEREST RATES
The US yields have fallen. The 10YR (2.21%) is down from 2.24% seen yesterday and we could see the current fall to continue towards 2.20-2.18% in the near term.
The US-Japan 10Yr (2.15%) is testing important near term support at current levels and could possibly bounce back in the next couple of sessions taking up Dollar Yen with itself. In that case some recovery is possibly in Nikkei too. Else, a break below 2.15% on the yield spread could indicate a fresh fall coming up.
The German-US 10Yr (-1.80%) has bounced back sharply and if it continues to rise towards -1.75% as expected, Euro strength could be expected in the coming sessions.
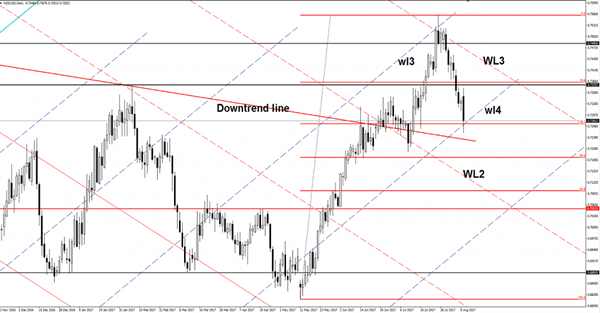
NZD/USD Is This A False Breakdown?
NZD/USD plunged and reached the 0.7251 level, but failed to stay there as the USDX has slipped lower after the poor US data. Price dropped below the confluence area formed at the intersection between the 38.2% with the fourth warning line (wl3), a valid breakdown will accelerate the sell-off, while a fake out will send the rate towards the 23.6% retracement level.
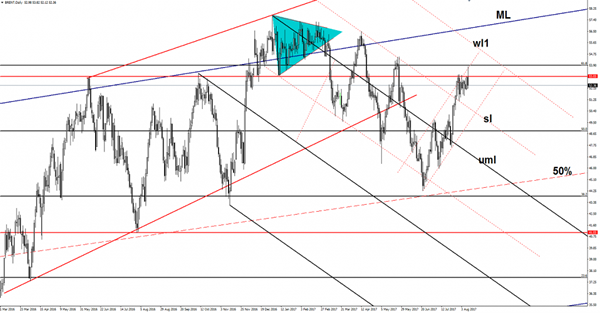
Brent False Breakout, Sell-off Favored
Price made another false breakout above the 53.03 static resistance and now is trading in the red again. Is trading near the $52.30 per barrel and could drop towards the $50.30 per barrel because the price could be attracted by the confluence area formed at the intersection between the sliding line (SL) with the uptrend line (ascending dotted line). The perspective remains bullish as long as is trading within the minor ascending channel.
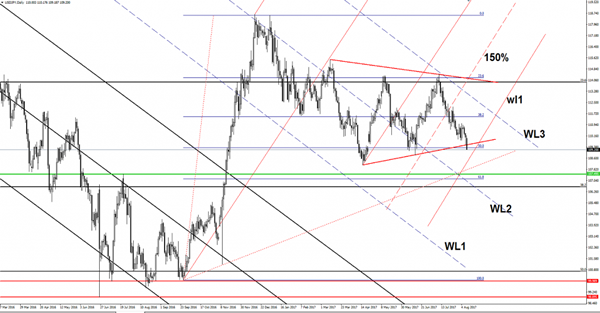
USD/JPY Poised For Valid Breakdown
Price dropped significantly on Thursday and looks determined to drop towards fresh new lows in the upcoming period. Is very heavy as the USDX slips lower after the poor US data and because the Yen is boosted by the Nikkei stock index.
I've said in the previous days that the Yen should dominate the currency market if the JP225 will take out the 19700 static support. Nikkei plunged much below the mentioned static support and looks unstoppable on the daily chart. The index could find support at 19278 or lower at the 18936 static support.
USD/JPY is going down as the greenback has taken a hit from the US high impact data, the PPI dropped by 0.1%, even if the traders have expected to see a 0.1% growth, while the Unemployment Claims increased from 241K to 244K, failing to reach the 240K jobs in the previous week.
Price is trading in the red and has managed to drop below the downside line (red line) of the symmetrical triangle and below the 50% retracement level. A valid breakdown from the chart pattern and a retest of the 50% level will confirm a further drop. Price should drop around 700 pips if will breakout from the symmetrical triangle. I don't know if it will drop so much, but a broader drop will come for sure.
Support can be found at the warning line (wl1), but a further Nikkei's drop will help the price to ignore this downside obstacle.
We have important downside targets at 61.8% retracement level, at the 38.2% retracement level and at the second warning line (WL2).
A Vexing Vix
A Vexing Vix
US political uncertainty and North Korean sabre -rattling has lit a fire under the comatose Vix volatility index which popped above 15 % overnight.The geopolitically influenced global stock market thrashing has driven investor angst into overdrive as volatility is back in vogue it seems, thanks to the escalation of North Korea-US rhetoric.
Forex markets, however, have kept their composure in the face of US 10y yield moving below 2.22% and a very soggy S & P which closed -1.45 % at the final tick
The equity markets are in risk reduction mode as investors move to secure liquidity with speculators exacerbating moves through tactical shorts. Considering the limited steps in Forex, the signals suggest we're in the midst of a global risk asset consolidation as opposed to a deeper retreat, however.
On Fed speak, most certainly the market was hoping for some upbeat assessment from Fed Bill Dudley, but it's silly to put the blame game on him when in reality the market attention was focused elsewhere. Not to mince views here, It was Trump talk that trashed the equity markets, nothing more nothing less. The Fear Index ( VIX) started creeping higher yesterday as the White House, which is a perpetual state of discord these days, appeared to contradict Secretary of State Rex Tillerson's attempt to defuse North Korean tensions.
US data didn't help as PPI and core prices have underwhelmed, but the producer indicator is a whippy measure and far too volatile to hang one's hat But traders will now focus on US CPI later today where risk is indeed tilted lower as core inflation has disappointed for four consecutive months. While a stronger print will likely buttress Fed repricing expectation, the all important CPI print could play second fiddle to risk reduction as traders will move to safe havens of flattening positions defending against possible weekend war mongering headline risk. Risk aversion looks to remain stubborn for the foreseeable future.
Japanese Yen
The market had moved below the key 109.20 level at pixel time and given the speculative flows positioning for possible YEN repatriation, we could see the psychologically significant 109.00 level give way. This week's close will be a key signal for market momentum. However, FX markets have been rather immune to the global equity swoon as we're only down 75-80 pips from yesterday's Asia levels suggesting Forex players are not entirely buying into the North Korea bluster just yet, but headline risk remains on high alert so fasten up as this could get interesting. Perhaps a Freaky Friday in the making
Euro
Pedestrian times on the EURO post these days as trade continues to be very uninspiring. The markets have trimmed their EURO bets and preparing for a consolidation phase ahead of Jackson Hole
Australian and New Zealand Dollar
It's been more of an NZD story line after the rancid ( for the NZD) whiff of intervention was espoused by the RBNZ. The trap door has been sprung, and I wouldn't be surprised to see a near term test of .7200 after all is said and done
The AUD is similarly threatening to break lower on risk aversion, but so far the market is still nervously buying dips. But with no sign of geopolitical headline risk abating, the risk sensitive Aussie dollar remains vulnerable to further global equity market swoons.
A break of .7830 ( 2016 high ) would sound off considerable alarm bells while triggering waves of stops. Given the uncertain landscape, the long Aussie is fraught with peril heading into weeks end
Governor Lowe delivered the status quo during a speech in Melbourne this morning.
Chinese Yuan Complex
It appears the long USDHKD ( HIBOR vs. LIBOR) carry trade unwind is befitting the RMB complex as repatriation flow into mainland after The HKMA announced that it would issue HKD40bn of Exchange Fund Bills to absorb excess liquidity. Yesterday's H-shares moves were likely exacerbated by fast money seeking better opportunities in PRC.
Gold Nears A Tipping Point
The war of words between Trump and Kim escalated Thursday and that sent a shudder through markets and a flight to safety that boosted gold near some key levels. The yen was the top performer while the kiwi lagged. US CPI is due on Friday. The Premium short on DAX30 was closed at 12010 for 220 pts, leaving other 2 indices trades in progress. The latest Premium video on the current and future trades is below.
Hedge fund heavyweights Ray Dalio and Jeff Gundlach touted gold this week and the chart is worth a close look. It climbed $10 to $1286 on Thursday; that's the best level since early June. It's breaking a major 6-year trendline resistance, nearing a double-top that was carved out just below $1300 in April and June. Gundlach highlighted how the chart was forming a cup-and-handle pattern. Dalio said rising political risks made a 5-10% allocation to gold necessary.
The market is spooked at the moment, but not as much as the 36 point decline in the S&P 500 would indicate. Ten-year yields were down just 4.6 bps and the FX moves are miniscule compared to US stocks, which had their second-worst day of the year.
A big part of the story is volatility. Trades betting on low volatility are far too crowded, something we've pointed out time and time again. As trouble stirred this week, the VIX jump was inevitable, but is it a squeeze? That brings us back to gold. If the fears are real and lasting, then that zone around $1300 will be a critical bellwether. A break would put the 2016 high of $1376 in clear focus.
In the background, the US dollar continues to struggle. The PPI report was soft, and it could well be a preview of Friday's CPI. The consensus is for a 1.8% y/y rise and 1.7% on core. A miss to the downside will spark serious doubts about a December hike.
Gold Rally Continues on Geopolitical Jitters
Gold continues to move higher and has posted gains in the Wednesday session. In North American trade, spot gold is trading at $1274.75, up 0.60% on the day. On the release front, inflation indicators disappointed, as PPI and Core PPI both declined 0.1%, missing their estimates of +0.1%. Unemployment claims rose to 244 thousand, higher than the estimate of 240 thousand. Inflation numbers will again be in focus on Friday, as the US releases CPI and Core CPI.
Gold prices have risen in recent weeks, as global markets are jittery, over rising tensions between North Korea and the US. With the war of words escalating between the two countries, global markets are down, as investors have dumped shares in favor of safe-haven assets, such as gold. North Korea has vowed to retaliate over new sanctions imposed by Washington and has threatened to attack Guam, which is a major US military base. President Trump and North Korean President Kim Jong-un are on a possible collision course, which has caused alarm in South Korea and Japan, strong allies of the US.
What can we expect from the Fed in the second half of 2017? The markets are looking for some clarity from the Federal Reserve, which is showing signs of backtracking on another rate hike in 2017. Earlier this year, the Fed strongly hinted that it planned to raise rates three times in this year, but so far only pressed the rate trigger twice, in March and June. After the June hike, Fed Chair Janet Yellen shrugged off concerns over low inflation, saying that it was due to "transient" factors. However, inflation has not improved and the Fed has changed its tune. Last week, St. Louis Federal Reserve President James Bullard said he opposed further Fed hikes, warning that another hike would actually delay inflation from hitting the Fed's target of 2%. The Fed appears uncertain about when to raise rates, and predictably, this hesitancy is making investors skeptical that the Fed will act. There is little chance that the Fed will make any moves at the September and November meetings, and the odds of a rate hike in December are currently at 42%. Analysts are hoping for some insight into the Fed's thinking when the Fed Reserve Dallas President Robert Kaplan and Minneapolis President Neel Kashkari deliver speeches on Friday. The markets will also be keeping a close eye on CPI, the primary gauge of consumer inflation. Weak numbers could hurt the greenback and lower the odds of a December hike.