
Sample Category Title
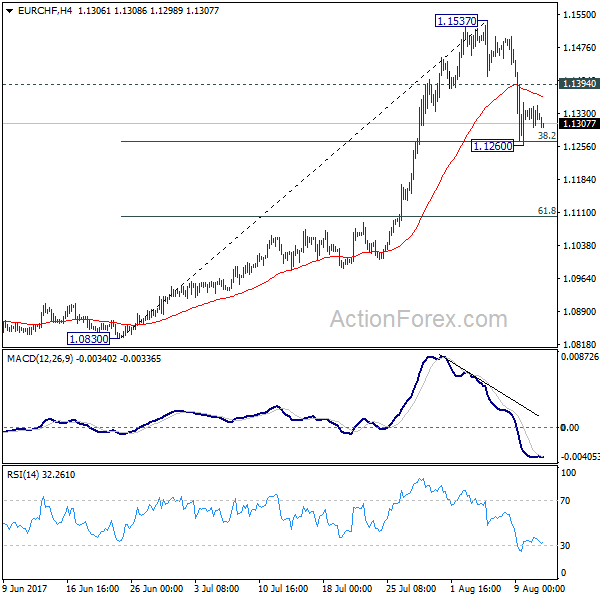
EUR/CHF Daily Outlook
Daily Pivots: (S1) 1.1304; (P) 1.1326; (R1) 1.1351; More...
Intraday bias in EUR/CHF remains neutral with a temporary low formed at 1.1260. The cross is trying to draw support from 38.2% retracement of 1.0830 to 1.1537 at 1.1267. On the upside, break of 1.1394 minor resistance will indicate that the pull back from 1.1537 has completed. In such case, intraday bias will be turned back to the upside for retesting 1.1537 first. However, firm break of 1.1267 will extend the fall and target 61.8% retracement at 1.1100.
In the bigger picture, firm break of 1.1198 key resistance confirms resumption of the long term rise from SNB spike low back in 2015. In this case, EUR/CHF would eventually head back to prior SNB imposed floor at 1.2000. For now, this will be the favored case as long as 1.1087 resistance turned support holds.

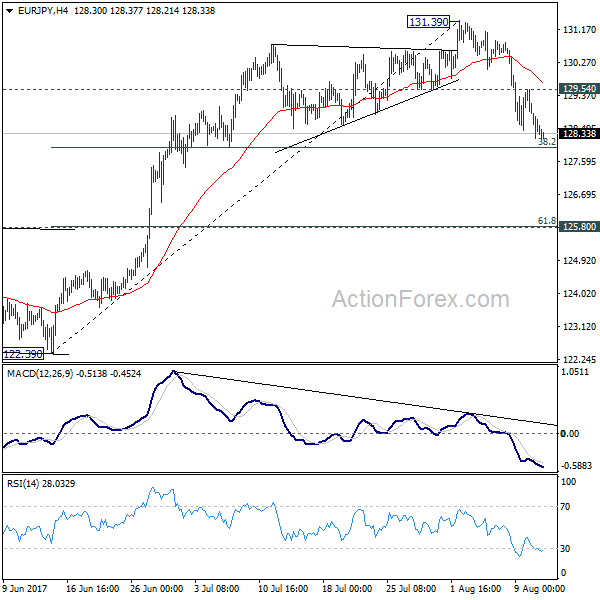
EUR/JPY Daily Outlook
Daily Pivots: (S1) 128.01; (P) 128.78; (R1) 129.33; More...
EUR/JPY's correction from 131.39 extends lower today and intraday bias remains on the downside for 38.2% retracement of 122.39 to 131.39 at 127.95. At this point, we'd expect strong support from 127.95 to contain downside and bring rebound. Above 129.54 minor resistance will turn bias back to the upside for retesting 131.39. However, firm break of 127.95 will bring deeper decline to 125.80 cluster support (61.8% retracement at 125.82) before completing the correction.
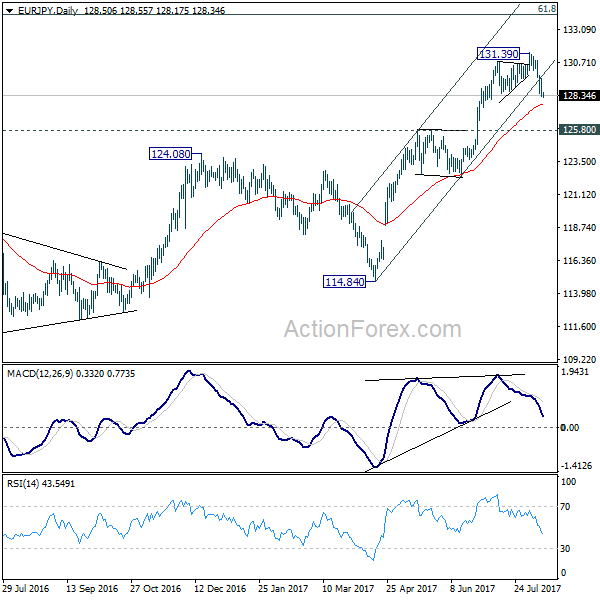
In the bigger picture, the down trend from 149.76 (2014 high) is completed at 109.03 (2016 low). Current rally from 109.03 should be at the same degree as the fall from 149.76 to 109.03. Further rise is expected to 61.8% retracement of 149.76 to 109.03 at 134.20. Sustained break there will pave the way to key long term resistance zone at 141.04/149.76. Medium term outlook will remain bullish as long as 124.08 resistance turned support holds.
European Open Briefing: Asian Equity Markets Continued Their Tumble Yet Again On Friday
Global Markets:
- Asian stock markets: Nikkei fell 0.05 %, Shanghai Composite down 1.52 %, Hang Seng dropped 1.70 %, ASX 200 fell 1.32 %
- Commodities: Gold at $1291.82 (+0.13 %), Silver at $17.06 (-0.01 % %), WTI Oil at $48.16 (-0.88 %), Brent Oil at $51.43 (-0.91 % %)
- Rates: US 10-year yield at 2.20, UK 10-year yield at 1.08, German 10-year yield at 0.40
News & Data:
- GBP Manufacturing Production m/m 0.0 % vs 0.0 % expected
- GBP Goods Trade Balance -12.7 B vs -11.0 B expected
- USD PPI m/m -0.1 % vs 0.1 % expected
- USD unemployment claims 244 K vs 240 K expected
- USD Core PPI m/m -0.1 % vs 0.2 % expected
- Fed buys $5.2 billion of mortgage bonds, sells none- RTRS
- Wall Street stock rally could be derailed by U.S.-North Korea war of words – RTRS
Markets Update:
Asian equity markets continued their tumble yet again on Friday as risk concerns were reignited in the markets following the Comments from US President Trump on North Korea in the US afternoon
USD/JPY has dropped more than 125 pips advancing to the strongest in eight weeks and closing below 108.90 in the Asian session in spite of a weak session overnight, being a Japanese holiday today, this move has been attributed to North Korea jitters
EUR/USD was little changed seen trading at $1.1776 after climbing 0.1 percent in the previous session. The US Dollar index was steady against a basket of six major currencies at 93.385 after falling 0.2 percent on Thursday.
Aussie was seen trading relatively steadily, but finally gave away 30-odd points losing 0.4 % in value and falling to lows below 0.7840 against the US Dollar. NZD/USD slipped a little with the AUD but recovered immediately and seen currently trading above 0.7270.
Upcoming Events:
- JPY Bank Holiday
- 12:30 GMT – (USD) CPI m/m
- 12:30 GMT – (USD) Core CPI m/m
- 13:40 GMT – FOMC Member Kaplan Speaks
- 15:30 GMT – FOMC Member Kashkari Speaks
Wage Growth Too Low, Interest Rates Are More Likely To Rise But Not Yet: RBA Governor
For the 24 hours to 23:00 GMT, the AUD declined 0.29% against the USD and closed at 0.7865.
LME Copper prices declined 0.8% or $48.5/MT to $6416.5/MT. Aluminium prices rose 0.3% or $6.0/MT to $2024.0/MT.
In the Asian session, at GMT0300, the pair is trading at 0.7850, with the AUD trading 0.19% lower against the USD from yesterday's close.
Overnight, the Reserve Bank of Australia's (RBA) Governor, Philip Lowe, stated that the central bank had been prepared to be “patient” on monetary policy and acknowledged low wage growth as one of the key risks to the Australian economy. Further, Lowe indicated that any move in interest rate will likely be gradual and probably to the upside.
The pair is expected to find support at 0.7825, and a fall through could take it to the next support level of 0.7801. The pair is expected to find its first resistance at 0.7888, and a rise through could take it to the next resistance level of 0.7927.
Going forward, the Reserve Bank of Australia's August meeting minutes, followed by Australia's unemployment rate data, set to release next week, will be on investors' radar.
The currency pair is trading below its 20 Hr and 50 Hr moving averages.

Euro Trading Marginally Higher, Ahead Of Germany’s Final Inflation Data
For the 24 hours to 23:00 GMT, the EUR slightly rose against the USD and closed at 1.1765.
In economic news, French industrial production dropped more-than-expected by 1.1% on a monthly basis in June, dropping by the most in four months and compared to market expectations for a fall of 0.6%. Industrial production had climbed 1.9% in the previous month.
Macroeconomic data indicated that the number of Americans filing for jobless claims for the first time unexpectedly rose to a level of 244.0K in the week ended 05 August 2017, confounding market consensus for a fall to a level of 240.0K. In the previous week, initial jobless claims had recorded a revised level of 241.0K. Additionally, the nation's producer price index (PPI) surprisingly fell 0.1% on a monthly basis in July, hitting its lowest in nearly a year. The PPI had advanced 0.1% in the previous month, while markets were anticipating for a rise of 0.1%.
In the Asian session, at GMT0300, the pair is trading at 1.1768, with the EUR trading a tad higher against the USD from yesterday's close.
The pair is expected to find support at 1.1720, and a fall through could take it to the next support level of 1.1671. The pair is expected to find its first resistance at 1.1801, and a rise through could take it to the next resistance level of 1.1833.
Going ahead, traders will closely monitor Germany's final consumer price inflation for July, slated to release in a few hours. Also, the US inflation report for July, slated to release later in the day, will pique significant amount of investor attention.
The currency pair is trading above its 20 Hr and 50 Hr moving averages.

Britain’s Total Trade Deficit Unexpectedly Widened To A 9-Month High In June
For the 24 hours to 23:00 GMT, the GBP declined 0.26% against the USD and closed at 1.2976, following disappointing economic data in the UK.
Data indicated that Britain's total trade deficit surprisingly widened to a nine-month high level of £4.56 billion in June, as exports dipped and imports surged. The nation had posted a revised deficit of £2.52 billion in the previous month, whereas market participants had envisaged for a deficit of £2.50 billion. Further, the nation's construction output recorded an unexpected drop of 0.1% on a monthly basis in June, compared to a revised fall of 0.4% in the prior month, while market participants had anticipated for a gain of 1.4%. Further, NIESR estimated UK's gross domestic product (GDP) climbed less-than-anticipated by 0.2% in the three months to July, compared to market expectations for a rise of 0.3%. In the April-June 2017 period, NIESR estimated GDP had climbed 0.3%.
In other economic news, manufacturing production in the UK remained flat on a monthly basis in June, at par with market expectations. In the prior month, manufacturing production had recorded a revised drop of 0.1%. On the other hand, the nation's industrial production climbed 0.5% on a monthly basis in June, more than market consensus for an advance of 0.1%. Industrial production had registered a revised flat reading in the previous month.
In the Asian session, at GMT0300, the pair is trading at 1.2982, with the GBP trading 0.05% higher from yesterday's close.
The pair is expected to find support at 1.2951, and a fall through could take it to the next support level of 1.2921. The pair is expected to find its first resistance at 1.3013, and a rise through could take it to the next resistance level of 1.3045.
Amid no macroeconomic releases in the UK today, investors will keep a close watch on UK's inflation figures, retail sales and ILO unemployment rate data, all scheduled to release next week.
The currency pair is showing convergence with its 20 Hr moving average and trading below its 50 Hr moving average.

Japanese Yen Trading Higher In The Asian Session
For the 24 hours to 23:00 GMT, the USD declined 0.73% against the JPY and closed at 109.16.
The Japanese Yen gained ground, amid increased risk aversion as investors continue to grapple with geopolitical tensions between the US and North Korea.
In the Asian session, at GMT0300, the pair is trading at 108.97, with the USD trading 0.17% lower against the JPY from yesterday’s close.
The pair is expected to find support at 108.59, and a fall through could take it to the next support level of 108.22. The pair is expected to find its first resistance at 109.71, and a rise through could take it to the next resistance level of 110.46.
Next week, investors will focus on Japan’s 2Q GDP data, to gauge strength in the Japanese economy.
The currency pair is trading below its 20 Hr and 50 Hr moving averages.

Swiss Franc Extends Its Gains In The Morning Session
For the 24 hours to 23:00 GMT, the USD declined 0.16% against the CHF and closed at 0.9622.
In the Asian session, at GMT0300, the pair is trading at 0.9613, with the USD trading 0.09% lower against the CHF from yesterday’s close.
The pair is expected to find support at 0.9591, and a fall through could take it to the next support level of 0.9569. The pair is expected to find its first resistance at 0.9655, and a rise through could take it to the next resistance level of 0.9697.
Going ahead, investors will look forward to Switzerland’s producer and import prices data, the sole important release next week.
The currency pair is trading below its 20 Hr and 50 Hr moving averages.

Canada’s New House Price Index Rose Less-Than-Expected In June
For the 24 hours to 23:00 GMT, the USD rose 0.35% against the CAD and closed at 1.2742.
On the data front, Canada's new housing price index registered a rise of 0.2% MoM in June, falling short of market expectations for an advance of 0.5%. The index had risen 0.7% in the previous month.
In the Asian session, at GMT0300, the pair is trading at 1.2745, with the USD trading a tad higher against the CAD from yesterday's close.
The pair is expected to find support at 1.2694, and a fall through could take it to the next support level of 1.2644. The pair is expected to find its first resistance at 1.2774, and a rise through could take it to the next resistance level of 1.2804.
Investors will keep a close watch on Canada's consumer price index and existing home sales data, both set to be released next week.
The currency pair is trading above its 20 Hr and 50 Hr moving averages.

Daily Technical Outlook And Review: EUR/USD, GBP/USD, AUD/USD, USD/JPY, USD/CAD, USD/CHF, DOW 30, GOLD
A note on lower timeframe confirming price action...
Waiting for lower timeframe confirmation is our main tool to confirm strength within higher timeframe zones, and has really been the key to our trading success. It takes a little time to understand the subtle nuances, however, as each trade is never the same, but once you master the rhythm so to speak, you will be saved from countless unnecessary losing trades. The following is a list of what we look for:
- A break/retest of supply or demand dependent on which way you're trading.
- A trendline break/retest.
- Buying/selling tails ... essentially we look for a cluster of very obvious spikes off of lower timeframe support and resistance levels within the higher timeframe zone.
- Candlestick patterns. We tend to only stick with pin bars and engulfing bars as these have proven to be the most effective.
We typically search for lower-timeframe confirmation between the M15 and H1 timeframes, since most of our higher-timeframe areas begin with the H4. Stops are usually placed 1-3 pips beyond confirming structures.
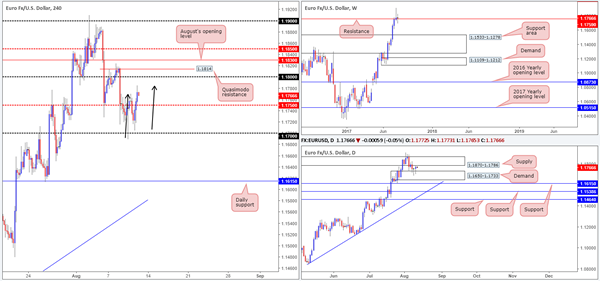
EUR/USD
Thanks to a healthy bout of buying from just ahead of the 1.17 neighborhood on Thursday, the EUR ended the day closing back above the H4 mid-level resistance pegged at 1.1750. Traders may have also noticed that the recent bid helped form a nice-looking H4 AB=CD bearish formation that completes around the 1.1785ish range (see black arrows).
Selling this Harmonic pattern may be appealing to some, given that daily price is also seen trading within striking distance of a supply noted at 1.1870-1.1786. Be that as it may, there are a few cautionary points you may want to consider:
The EUR has (and still is) entrenched within a strong uptrend.
The aforementioned daily supply suffered multiple breaks to the upside last week, thus potentially weakening the zone.
A sell on the H4 places you in direct conflict with the 1.1750 line.
Weekly price is currently trading above resistance at 1.1759.
Our suggestions: On account of the above points, selling this market is a risk that we're just not willing to take at the moment.
Although we're against selling, we're also not too fond of buying this market either. Buying into an AB=CD completion and a daily supply (despite its condition) is not something our team would label high probability.
Data points to consider: US Inflation figures scheduled for release at 1.30pm, followed closely by FOMC members Kaplan and Kashkari taking the stage at 2.40/4.30pm GMT+1.
Levels to watch/live orders:
- Buys: Flat (stop loss: N/A).
- Sells: Flat (stop loss: N/A).
GBP/USD
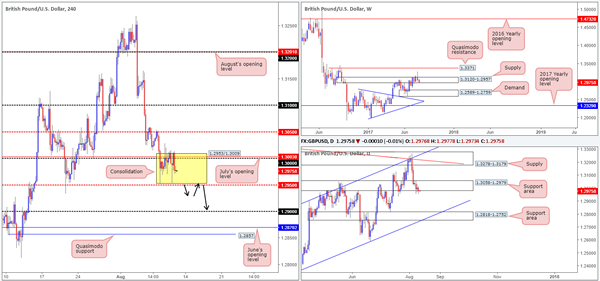
As can be seen from the H4 chart this morning, the GBP/USD appears to be in the process of chiseling out a small consolidation between 1.2953/1.3009. Supporting the top edge of this area is a large psychological band at 1.30 as well as July's opening level seen at 1.3003. Bolstering the lower edge, however, we have a H4 mid-level support coming in at 1.2950.
Over on the bigger picture, weekly sellers remain defensive from within the walls of supply drawn in at 1.3120-1.2957. Down on the daily timeframe, the support area seen at 1.3058-1.2979 is, in our opinion, now vulnerable to the downside. Not only do we have weekly sellers coercing price lower here, there has also been little to no bullish intent registered here since the area came into play. The next downside target on this timeframe does not come into view until we reach a support area at 1.2818-1.2752, which happens to be glued to the top edge of weekly demand at 1.2589-1.2759 (the next area of interest on the weekly chart) and converges beautifully with a channel support etched from the low 1.2365.
Our suggestions: The H4 range is likely going to suffer a break to the downside either today or early next week, given the bearish tone being painted on the higher timeframes right now. To that end, we're watching for a H4 close to print below the current range. This – coupled with a successful retest would, in our humble view, be enough evidence to suggest a move down to the 1.29 handle, followed closely by June's opening line at 1.2870/H4 Quasimodo support at 1.2857.
Data points to consider: US Inflation figures scheduled for release at 1.30pm, followed closely by FOMC members Kaplan and Kashkari taking the stage at 2.40/4.30pm GMT+1.
Levels to watch/live orders:
- Buys: Flat (stop loss: N/A).
- Sells: Watch for H4 price to close below the 1.2950 region and then look to trade any retest seen thereafter ([waiting for a reasonably sized bearish candle to form following the retest – in the shape of either a full, or near-full-bodied candle – is advised] stop loss: ideally beyond the candle's wick).
AUD/USD
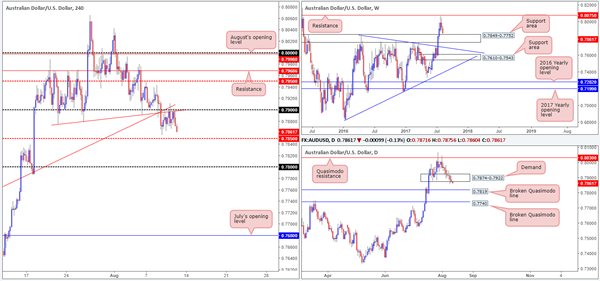
Kicking this morning's analysis off with a quick look at the weekly timeframe, we can see that price is currently trading within striking distance of a major support area at 0.7849-0.7752. With this area having been a strong zone of resistance in the past, a bullish response will likely be seen from this region. In conjunction with weekly flow, daily demand at 0.7874-0.7922 appears incredibly vulnerable at the moment. Further selling from here will likely bring the unit down to a broken daily Quasimodo line drawn from 0.7819, which is planted around the top edge of the noted weekly support area.
Across on the H4 timeframe, Aussie bears remain defensive around the 0.79 handle. What gives this number extra credibility is the two H4 trendline resistances (0.7874/0.7635). A close below the nearby H4 mid-level support at 0.7850 today will likely open up the trapdoor down to the aforesaid broken daily Quasimodo line, and maybe even the 0.78 handle.
Our suggestions: Should the unit continue to decline in value, we'll then be eyeing the 0.7819/0.78 region for potential long opportunities. Given that psychological boundaries such as 0.78 attract stop hunts, we're going to wait and see if additional H4 candle confirmation is seen before committing to a position here. In the event that a trade comes to fruition, we'll look to reduce risk to breakeven around the 0.7850 range and take partial profits at 0.7874 (the underside of the current daily demand).
Data points to consider: US Inflation figures scheduled for release at 1.30pm, followed closely by FOMC members Kaplan and Kashkari taking the stage at 2.40/4.30pm GMT+1.
Levels to watch/live orders:
- Buys: 0.78/0.7819 region ([waiting for a H4 bullish candle, preferably a full, or near-full-bodied candle, to form is advised] stop loss: ideally beyond the candle's tail).
- Sells: Flat (stop loss: N/A).
USD/JPY
Risk-off conditions, as you can see, continue to support the Japanese yen. The currency also gained momentum following the release of July's US PPI figures on Thursday, which came in lower than expected. This bearish run, however, could be tested today.
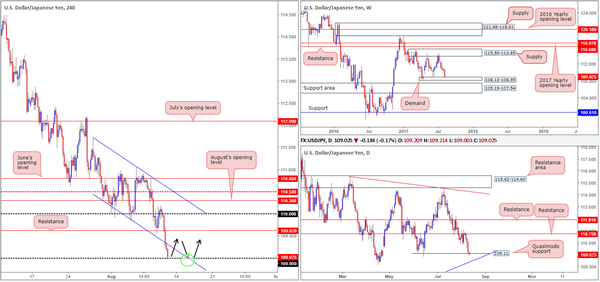
On the weekly timeframe, demand at 108.13-108.95 is now seen within shouting distance. In addition to this, a daily Quasimodo support was recently brought into the picture at 109.11, alongside the 109 handle printed on the H4 timeframe.
Our suggestions: Collectively, all three timeframes show structure suggesting a buy in this market today. The question is how does one go about finding an entry? Simply clicking the buy button, in our opinion, just won't do given the strength of the approach seen into the above said supports.
Personally, for us to commit to a long from 109, we would want to see H4 price break back into the nearby channel edge taken from the low 110.30, and then retest 109 again as support (as per the black arrows). Ultimately, we'd be looking to target 109.62 initially, followed by the 110 handle which converges with a H4 channel resistance taken from the high 111.71.
Data points to consider: US Inflation figures scheduled for release at 1.30pm, followed closely by FOMC members Kaplan and Kashkari taking the stage at 2.40/4.30pm GMT+1.
Levels to watch/live orders:
- Buys: 109 region ([waiting for a H4 bullish candle, preferably a full, or near-full-bodied candle, to form is advised] stop loss: ideally beyond the candle's tail).
- Sells: Flat (stop loss: N/A).
USD/CAD
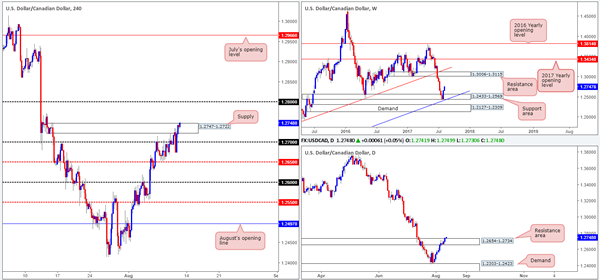
Trade update: small loss taken at 1.2723 – see Thursday's report for details.
The USD/CAD came under strong selling pressure from H4 supply at 1.2747-1.2722 in early US trading on Thursday. Although the move forced the pair below the 1.27 handle, there was little follow through generated. In fact, immediately after the bearish close registered, price was heavily bid back above 1.27 and driven into the upper extremes of the said H4 supply.
In view of the marginal close seen above the daily resistance area at 1.2654-1.2734, and the strong bullish sentiment seen on the weekly timeframe from the support area at 1.2433-1.2569, we feel further buying may be on the cards today, next week.
Our suggestions: Ultimately, what we're looking for is a decisive H4 close above the current H4 supply. This, alongside a retest would, in our view, be a valid buy signal especially considering that both weekly and daily action show room to extend much, much higher. The first area of concern, should a trade come to fruition, would be the 1.28 handle.
Data points to consider: US Inflation figures scheduled for release at 1.30pm, followed closely by FOMC members Kaplan and Kashkari taking the stage at 2.40/4.30pm GMT+1.
Levels to watch/live orders:
- Buys: Watch for H4 price to close above the current H4 supply and then look to trade any retest seen thereafter ([waiting for a reasonably sized bullish candle to form following the retest – in the shape of either a full, or near-full-bodied candle – is advised] stop loss: ideally beyond the candle's tail).
- Sells: Flat (stop loss: N/A).
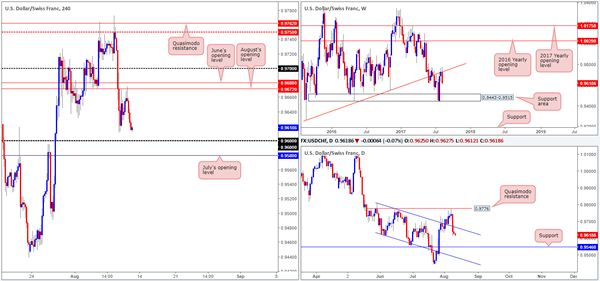
USD/CHF
For those who read Thursday's report on the USD/CHF, you may recall our desk placing emphasis on June and August's opening levels at 0.9680/0.9672 as a potential area to sell. As you can see, price reacted beautifully to this zone, and even chalked up a nice-looking H4 bearish pin bar. Well done to any of our readers who jumped aboard this move.
Technically speaking, the next hurdle on the hit list will likely be the 0.96 handle, followed closely by July's opening level at 0.9580. However, according to the weekly and daily timeframes, we could be looking at trading lower than these two structures, as the next area of support on the weekly chart comes in at 0.9443-0.9515, with a daily support seen pegged a little higher at 0.9546.
Our suggestions: Despite the higher timeframes suggesting lower prices, we would advise against selling into the 0.96 handle and nearby July opening level. The bounce from these structures could place you in unnecessary drawdown. Waiting for a break below these levels, therefore, could be an option, but by doing so you're left with little room to maneuver as the daily support mentioned above sits at 0.9546!
Data points to consider: US Inflation figures scheduled for release at 1.30pm, followed closely by FOMC members Kaplan and Kashkari taking the stage at 2.40/4.30pm GMT+1.
Levels to watch/live orders:
- Buys: Flat (stop loss: N/A).
- Sells: Flat (stop loss: N/A).
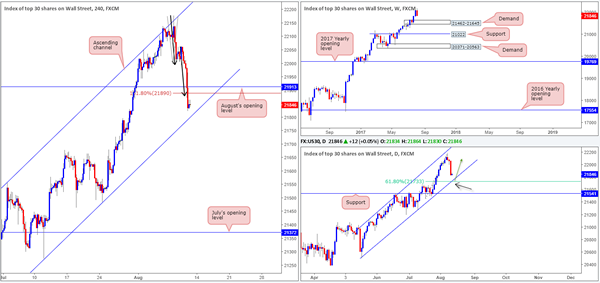
DOW 30:
The US equity market ended the day recording a rather substantial loss amid geopolitical issues between the US and North Korea. The index ran through August's opening level at 21913 and also took out the H4 AB=CD 161.8% Fib ext. point at 21890.
On the H4 timeframe, we can also see that to the downside we have a nearby channel support extended from the low 21273. More importantly, however, there's a nearby DAILY channel support seen just below this which has been drawn from the low 20494. Given how close together both channel supports are, and the fusing of a daily 61.8% Fib support at 21733 (taken from the low 21462), a bounce higher from this area is likely.
Our suggestions: In view of the technical landscape at the moment, we believe that the H4 channel support will likely suffer a minor fakeout, as traders may press for the daily channel support and its converging 61.8% Fib support for long opportunities.
Therefore, our plan of attack is simple: wait for H4 price to connect with the said daily channel line, and enter long on the basis of a reasonably sized H4 bull candle, preferably in the shape of a full, or near-full-bodied candle.
Data points to consider: US Inflation figures scheduled for release at 1.30pm, followed closely by FOMC members Kaplan and Kashkari taking the stage at 2.40/4.30pm GMT+1.
Levels to watch/live orders:
- Buys: 21733 region ([waiting for a H4 bullish candle to form, preferably either a full, or near-full-bodied candle, is advised] stop loss: ideally beyond the candle's tail).
- Sells: Flat (stop loss: N/A).
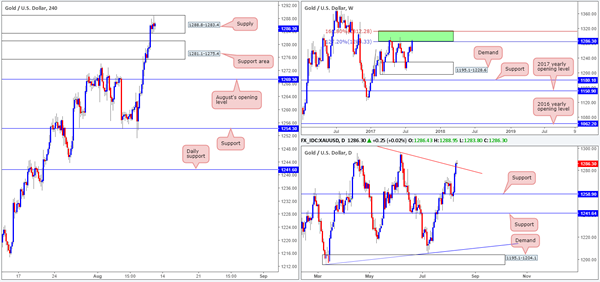
GOLD:
With the US dollar taking another hit to the mid-section, the yellow metal rose higher for a third consecutive day. This has brought the unit into an interesting area of weekly resistance (green zone) comprised of two Fibonacci extensions 161.8/127.2% at 1312.2/1284.3 taken from the low 1188.1. Weekly price has, as you can see, responded each time this area has been challenged, therefore there's a chance that we may see history repeat itself here.
Down on the daily timeframe, nevertheless, yesterday's move lifted price above a trendline resistance extended from the high 1337.3. This, at least on this scale, signals further upside could be on the horizon.
Bouncing over to the H4 candles, we can see that supply at 1281.1-1275.4 was recently taken out (now an acting support area) and saw the metal attack a nearby supply seen at 1288.8-1283.4.
Our suggestions: Judging the recent H4 candle action, sellers are active within the current supply. Whether they're strong enough to halt buying is difficult to judge. On the one hand, weekly sellers may come into the picture today/early next week, but on the other hand a great deal of daily buyers saw the recent close above the trendline resistance and will be looking to buy.
Although we're very tempted to begin hunting for sell opportunities in this market, we would prefer to see daily price close back below the said trendline resistance before taking that risk. Therefore, opting to wait on the sidelines may be the better path to take today.
Levels to watch/live orders:
- Buys: Flat (stop loss: N/A).
- Sells: Flat (stop loss: N/A).