Sample Category Title
Crude Oil Ready To Push Higher
Crude oil is trading higher. Hourly support is given at 47.86 (26/07/2017 low). Strong resistance can be found at 50.41 (31/07/2017). Expected to monitor resistance at 50.41 (31/07/2017 high).
In the long-term, crude oil has recovered after its sharp decline last year. However, we consider that further weakness are very likely. Strong support lies at 35.24 (05/04/2016) while resistance can now be found at 55.24 (03/01/2017 high)
Silver Bullish Pressures
Silver's bullish pressures are on. Hourly resistance lies at 16.94 (02/08/2017 high) has been broken. The commodity has set up a new support 16.13 (07/08/2017 high). Expected to show continued current bullish momentum.
In the long-term, the death cross indicates that further downsides are very likely. Resistance is located at 25.11 (28/08/2013 high). Strong support can be found at 11.75 (20/04/2009).
Gold Surging
Gold is consolidating. Hourly support is given at 1251 (08/08/2017 low). Stronger support lies at 1204 (10/07/2017 high). Hourly resistance at 1274 (01/08/2017 high) has been broken. The road is wide open towards strong resistance at 1296 (06/06/2017 high).
In the long-term, the technical structure suggests that there is a growing upside momentum. A break of 1392 (17/03/2014) is necessary ton confirm it, A major support can be found at 1045 (05/02/2010 low)
EUR/CHF Selling Pressures Are Back
EUR/CHF has consolidated and short-term selling pressures are definitely back on. Hourly support is now located at 1.1260 (04/08/2017 low). Expected to show continued weakness.
In the longer term, the technical structure has reversed. Strong resistance at 1.1200 (04/02/2015 high) has been broken. Yet,the ECB's QE programme is likely to cause persistent selling pressures on the euro, which should weigh on EUR/CHF. Supports can be found at 1.0184 (28/01/2015 low) and 1.0082 (27/01/2015 low).
EUR/GBP Consolidating Below 0.9100
EUR/GBP is trading around its highest levels of the year despite ongoing consolidation. Hourly resistance lies at 0.9087 (08/08/2017 high). Hourly support is given at a distance at 0.8742 (16/06/2017 low). Downside risks are nonetheless important.
In the long-term, the pair has largely recovered from recent lows in 2015. The technical structure suggests a growing upside momentum. The pair is trading above from its 200 DMA. Strong resistance can be found at 0.9500 psychological level.
EUR/GBP Elliott Wave Analysis
EUR/GBP – 0.9010
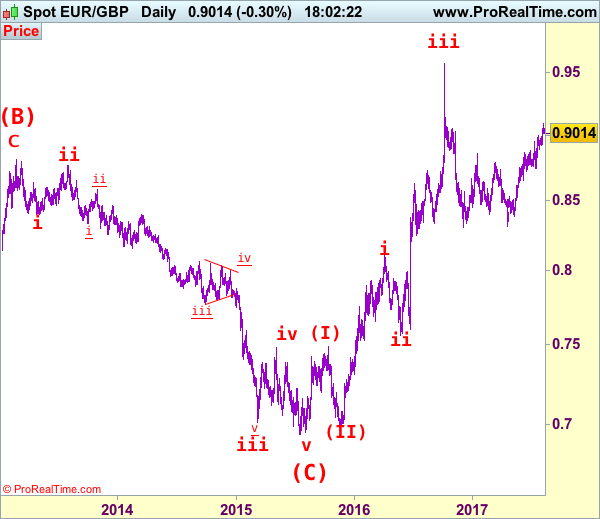
As the single currency has retreated after rising to 0.9088 earlier this week, suggesting consolidation below this level would be seen and initial downside risk is for pullback to 0.8930-40, however, reckon support at 0.8891 would limit downside and 0.8830-35 should hold, bring another rise later, above said resistance at 0.9088 would extend recent rise from 0.8304 (Dec 2016) to previous resistance at 0.9142. Looking ahead, only break there would signal the retreat from 0.9576 top (2016 high) has ended at 0.8304, bring subsequent upmove to 0.9200-10.
Our latest preferred count is that the wave V of a 5-wave series from 0.5682 ended at 0.9805 earlier and major from there has possibly ended at 0.8067 as A-B-C-X-A-B-C. We are keeping our view that the entire correction from 0.9805 has possibly ended at 0.7756 and as labeled as the attached daily chart and impulsive move from 0.9084 has ended at 0.7756 as a 5-waver which marked either the (C) wave or the A leg of (C), a daily close above resistance at 0.8831 would suggest (C) leg has ended and headway towards 0.9084.
On the downside, whilst initial pullback to 0.8945-50 cannot be rule out, reckon 0.8880 would limit downside and bring another rise later. A daily close below 0.8780-85 would defer and suggest a temporary top is possibly formed, bring test of support at 0.9743 but break there is needed to add credence to this view, bring retracement of recent upmove to 0.8700, then towards previous support at 0.8652 which is likely to hold from here.
Recommendation: Buy at 0.8880 for 0.9080 with stop below 0.8780
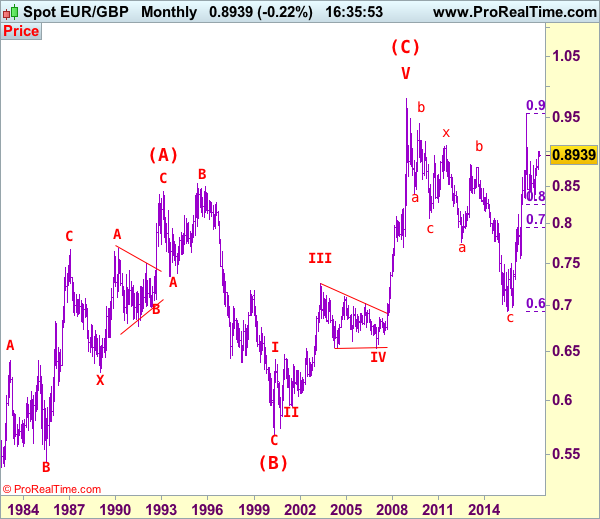
Euro's long term uptrend started in Feb 1981 at 0.5039 and is unfolding as a (A)-(B)-(C) move with (A): 0.8433 (Feb 1993), (B): 0.5682 (May 2000) and impulsive wave (C) should have ended at 0.9805 with wave III ended at 0.7254 (May 2003), triangle wave IV at 0.6536 (23 Jan 2007) and wave V as well as wave (C) has ended at 0.9805.
We are keeping an alternate count that only wave III ended at 0.9805 and the correction from there is the wave IV and may extend weakness to 0.7700, however, it is necessary to see a daily close above resistance at 0.9143 would change this to be the preferred count.
USD/CAD Elliott Wave Analysis
USD/CAD – 1.2727
The greenback has rebounded after falling to 1.2414 late last month, retaining our view that further consolidation above this level would be seen and initial upside risk remains for corrective bounce to 1.2770-75, however, reckon previous support at 1.2859 would cap upside and bring another decline later, below 1.2550-60 would suggest top is possibly formed, bring weakness to 1.2500, then 1.2451, break of latter level would signal the rebound from 1.2414 has ended, bring retest of this level. Having said that, break there is needed to confirm recent wave c decline has resumed for weakness to 1.2350, then 1.2300 but loss of momentum should prevent sharp fall below 1.2200-10 and price should stay well above 1.2000 level, bring rebound later. We are keeping our bearish count that wave b ended at 1.3794 and wave c has commenced for further fall to aforesaid downside targets.
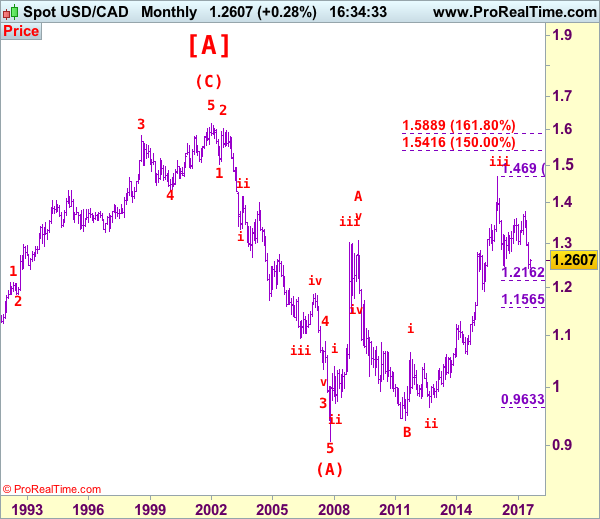
We are keeping our view that the wave b from 1.0657 (a leg top) has possibly ended at 0.9633 with (a): 0.9800, wave (b): 1.0447 and wave c at 0.9633, the subsequent rise from there is now treated as wave c exceeded indicated upside target at 1.3770-80 and 1.4000 and wave (3) has possibly ended at 1.4690 and wave (4) correction has commenced for retracement back to 1.2410-20, then towards 1.2200.
On the daily chart, our latest preferred count remains that the A of (B) rally from 0.9059 low (7 Nov 2007) unfolded into an impulsive wave with i: 0.9059-1.0380, ii ended at 0.9819, iii at 1.3019 followed by triangle wave iv at 1.2026 , then wave v formed a top at 1.3066 and also ended the wave A. The wave B is unfolding as an double three a-b-c-x-a-b-c and is sub-divided as a: 1.2192, b: 1.2716 and wave c at 1.0784, followed by wave x at 1.1725, another set of a-b-c unfolded with 2nd a at 0.9931, 2nd b at 1.0674. the 2nd c has possibly ended at 0.9407, therefore, consolidation with upside bias is seen for major correction, indicated target at 1.3900 had been met and gain to 1.4700 would follow.
On the upside, whilst initial recovery to 1.2770-75 cannot be ruled out, reckon upside would be limited to 1.2800–10 and renewed selling interest should emerge there, bring another decline to aforesaid downside targets. Above previous support at 1.2859 would defer and risk a stronger rebound to resistance at 1.2944 but upside should be limited to psychological resistance at 1.3000 and price should falter well below another previous support at 1.3165 (now resistance), bring another decline later.
Recommendation: Sell at 1.2800 for 1.2500 with stop above 1.2900.

Longer term - The selloff from 1.6194 (21 Jan 2002) to 0.9059 (07 Nov 2007) is viewed as (A) wave which is a 5-waver as labeled on the monthly chart as below, the subsequently rally is labeled as (B) with impulsive A leg of (B) ended at 1.3066, wave B of (B) is unfolding which has either ended at 0.9407 or would extend one more fall but downside should be limited to 0.9200 and 0.9000 should hold.
AUD/USD Growing Selling Pressures
AUD/USD's short-term technical structure is bearish. Hourly resistance is given at 0.8066 (27/07/2017 high) while hourly support can be found at 0.7875 (21/07/2017 low). Expected to continued decline.
In the long-term, we are waiting for further signs that the current downtrend is ending. Key supports stand at 0.6009 (31/10/2008 low) . A break of the key resistance at 0.8295 (15/01/2015 high) is needed to invalidate our long-term bearish view.
USD/CAD Short-Term Bullish Momentum Continues
USD/CAD's short-term bullish momentum continues. The road is wide open for further increase. Hourly support is given at a distance at 1.2414 (27/07/2017 low). Expected to show continued increase.
In the longer term, the pair has broken longterm support that can be found at 1.2461 (16/03/2015 low) before bouncing back. Strong resistance is given at 1.4690 (22/01/2016 high). The pair should head further lower
USD/CHF Growing Selling Pressures
USD/CHF is having some weakness after the pair failed to monitor resistance at 0.9771 (15/06/2017 high). Hourly support at 0.9631 (01/08/2017 low) has been broken. Expected to to show further downside pressures.
In the long-term, the pair is still trading in range since 2011 despite some turmoil when the SNB unpegged the CHF. Key support can be found 0.8986 (30/01/2015 low). The technical structure favours nonetheless a long term bullish bias since the unpeg in January 2015.