Sample Category Title
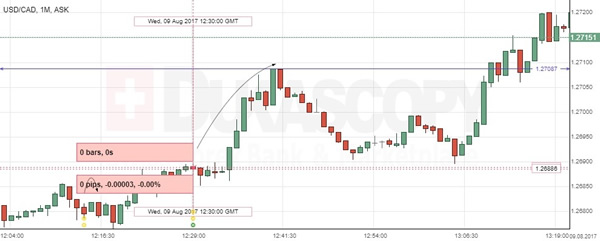
USD/CAD: Building Permits
A stronger-than-anticipated increase in Canadian building permits had a mixed impact on the USD/CAD exchange rate, as data came in simultaneously with the US preliminary quarterly reports. The Canadian Dollar fell against the US Dollar to touch 1.2686, albeit some minutes later the currency pair started an upmove to reach Wednesday session's highs far above the 1.2708 level. Statistic Canada reported that the value of the country's building permits rose 2.5% in June, beating expectations for a 1.8% decline. The report showed that intentions to build single-family homes fell, while commercial construction plans surged. Moreover, an increase in housing starts confirmed no slowdown in the sector despite government measures to curb prices growth.
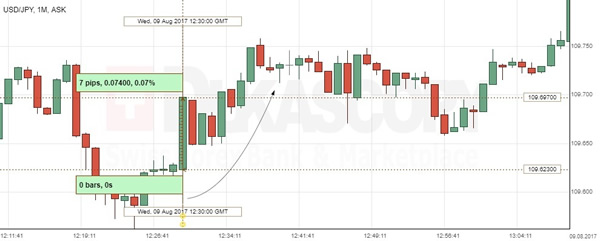
USD/JPY: Nonfarm Productivity Q/Q
The report on the US worker productivity, which revealed a higher-than-anticipated increase in the Q2, resulted in a jump of the USD/JPY currency pair. The Greenback appreciated against the Yen by 0.07% to be seen trading above the 109.69 level after data were published. The Labour Department showed that the nonfarm productivity rose at a 0.9% annual growth pace in the June quarter, above expectations for a 0.7% rise. Experts suggested that an upward move was supported by higher volume of hours worked, but the overall trend was seen weak, raising doubts that the robust US economic growth nearing 3% year-over-year would be achieved even despite Trump's tax cuts, regulatory rollbacks and higher infrastructure spending.
Forex Technical Analysis: EUR/USD, USD/JPY, GBP/USD
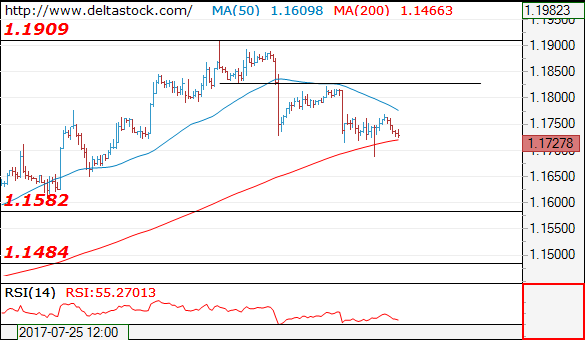
EUR/USD
Current level - 1.1727
The overall outlook remains bearish after the recent low at 1.1687, for a slide towards 1.1580 major support zone. Intraday, there is a risk of a brief spike to 1.1780 area.
| Resistance | Support | ||
| intraday | intraweek | intraday | intraweek |
| 1.1780 | 1.1909 | 1.1650 | 1.1580 |
| 1.1825 | 1.2000 | 1.1580 | 1.1480 |
USD/JPY
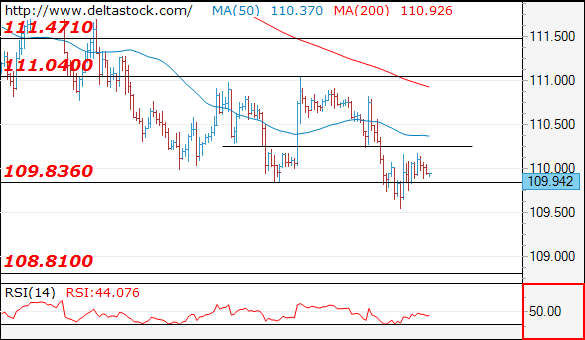
Current level - 109.94
The bias is still bearish below 110.30 minor resistance, for a dive towards 108.80 zone.
| Resistance | Support | ||
| intraday | intraweek | intraday | intraweek |
| 110.25 | 112.20 | 109.50 | 108.80 |
| 111.04 | 114.50 | 108.80 | 108.10 |
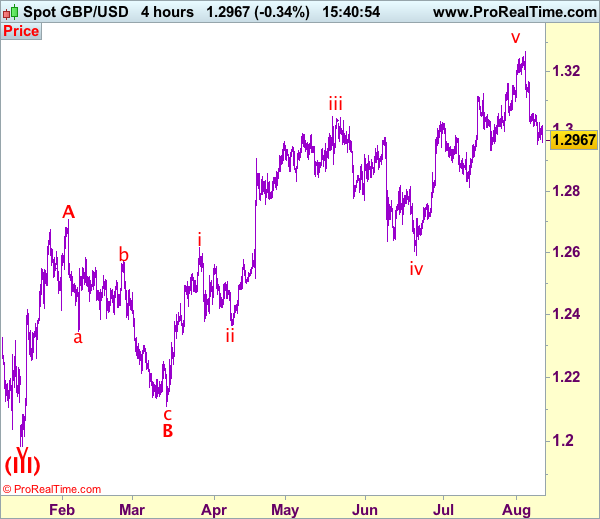
GBP/USD
Current level - 1.2971
The consolidation pattern above 1.2950 is running out of steam, so 1.3050 resistance is expected to cap the upside and to provoke another leg downwards, to 1.2810 area.
| Resistance | Support | ||
| intraday | intraweek | intraday | intraweek |
| 1.3050 | 1.3260 | 1.2930 | 1.2930 |
| 1.3100 | 1.3500 | 1.2810 | 1.2810 |

Daily Technical Analysis: EUR/USD – Two Breakout Points Outside The Equidistant Channel
The EUR/USD has perfectly rejected from both POCs after the setup and analysis shown on Weekly Recap and at this time it is very clear that the equidistant channel is trapping the price keeping the range bound market still in play. After a fake-out that happened yesterday 1.1720-1.1690 (which was still good to trade as a breakout trade, and what I showed during the Live Trading webinar) we can see two POC zones within the equidistant channel that might push or tank the price. If the price spikes above 1.1778 (EMA89, D H3, channel high) the target is 1.1798 and 1.1825. Above 1.1832 we should see a continuation towards 1.1875 and 1.1910. Below 1.1668 (D L5, ATR projection low, channel low), the price could drop to 1.1584.
RBNZ: Less Cautious Than Expected, But Wheeler Drags NZD Down
The RBNZ kept its policy unchanged overnight, as was widely anticipated. The Bank acknowledged that CPI inflation softened in Q2, but noted that it still remains within the target range. Importantly, officials did not push back the timing of their first planned rate hike (Q1 2020), as may have been anticipated in the face of softer data. They did, however, express a greater discomfort about the recent strength of the Kiwi, indicating that 'a lower New Zealand dollar is needed”. In the previous statement they only noted that 'a lower New Zealand dollar would help”. Nonetheless, the language around the economic outlook as well as the currency may have been less dovish than what was expected by investors, evident by the spike higher in NZD on the decision.
The Kiwi did not hold on to its gains for long though, with the currency turning back down to trade much lower in the following hours. We think this reversal may have been due to some remarks by Governor Wheeler, who said that the option of FX intervention is 'always open”.
Moving forward, we think that the outlook for NZD remains cautiously negative. The market is currently pricing in the first RBNZ hike in one year's time (Q3 2018), according to New Zealand's OIS, while the Bank's own forecasts suggest that this is far too early. The market could push its expectations back in the foreseeable future to be more in line with those of the Bank, especially if the recent softness in economic indicators persists. What's more, policymakers clearly want a weaker Kiwi, implying they could continue to jawbone it, should it continue to trade at undesirable levels for the Bank. Finally, the recent rise in geopolitical risks also argues for a weaker NZD, as the currency tends to underperform when risk appetite is low.
NZD/USD spiked higher on the RBNZ rate decision to hit resistance at 0.7370 (R1). However, the pair was quick to give back those gains and trade even lower on Governor's Wheeler's reference to intervention. At the time of writing, the rate is testing the 0.7300 (S1) line, and given that the short-term trend remains negative, we would expect a clear dip below that level to initially aim for the 0.7260 (S2) support, marked by the low of the 18th of July. Another break below 0.7260 (S2) may set the stage for extensions towards our next key support of 0.7200 (S3). As for the bigger picture, we stick to our guns that the dip back below 0.7400 (R2) combined with the negative divergence between our daily oscillators and the price action increase the likelihood for the pair to continue drifting lower in the foreseeable future.
Today's highlights:
During the European day, Norway's CPIs for July will be in focus. The forecast is for both the headline and the core rates to have declined notably. Even though something like that could reverse some of the NOK's recent gains, we doubt that it will cause the Norges Bank to shift to a more dovish bias, considering that the Bank already expects inflation to continue drifting lower in the months ahead. We also get industrial production data for June from both Sweden and the UK. In the US, the PPI rate for July and initial jobless claims for the week ended on the 4th of August are due out.
We have only one speaker on the agenda: the influential President of the New York Fed, William Dudley. It would be very interesting to hear his view on inflation. His most recent comments on the subject were back in June, when he said that even though inflation is a bit low, it should rebound alongside wages as the labor market continues to improve. Considering that inflation has remained subdued since then, we think Dudley could change tune (as Yellen did) and indicate that the recent softness in inflation may not be entirely transitory. Any such comments could bring USD under renewed selling interest.
USD/JPY fell below 109.90 (S1) yesterday, the lower bound of the range that had been containing the price action since the 28th of July. Nevertheless, in the early US session, the rate rebounded back above that barrier. Although the brief dip painted a lower low on the 4-hour chart, we prefer to wait for a decisive close below the crossroads of the 109.90 (S1) level and the upside support line taken from the low of the 17th of April before we get confident on larger downside extensions. The catalyst for such a move may be inflation concerns by NY Fed President Dudley.
NZD/USD
Support: 0.7300 (S1), 0.7260 (S2), 0.7200 (S3)
Resistance: 0.7370 (R1), 0.7400 (R2), 0.7460 (R3)
USD/JPY
Support: 109.90 (S1), 109.45 (S2), 109.00 (S3)
Resistance: 110.25 (R1), 111.00 (R2), 111.30 (R3)
Flight To Safety Subsides, Attention Shifts To Data
The war of words between Trump and North Korea, has largely dictated the direction of the market for the past 24 hours. Safe havens, were the primary beneficiaries over the increased tensions, with Gold, the Swiss Franc, the Japanese Yen, and U.S. Treasuries rising across the board. While some investors decided to take some risk off the table, the scale of the moves was limited, this is a clear sign that markets aren't overly concerned about the situation yet. Despite the 25% surge in the volatility index (VIX), the Dow Jones Industrial Average only declined 36 points, and if Walt Disney and Boeing stocks losses were eliminated, the index would have been up 16 points.
It appears that markets are listening to U.S. secretary of State Rex Tillerson, more than Donald Trump or Kim Jong-un. Tillerson said that Americans should sleep well at night and have no concerns about this particular rhetoric of the past few days, and investors seemed to have followed his advice.
These tensions are not news to investors, as the relationship between the two countries has see-sawed for decades. Geopolitical tensions shock markets for a short time frame, until the situation settles, and if Trump scaled down his angry tweets, investors wouldn't have reacted as strongly.
I believe that real risks of missile attacks remain low, and investors should avoid emotional reactions. However, caution is warranted, and traders should use stop losses carefully.
With stocks remaining near record highs, markets are likely to shift their attention to monetary policy. According to Chicago Fed President, Charles Evans, the Fed should begin trimming the balance sheet in September- despite lower inflation. However, he stated that if inflation remains low, another interest rate hike should be delayed. We'll also get to hear fro m New York Fed President William Dudley today, at a press briefing on employment trends and wage inequality. This makes Friday's Consumer Price Index release of particular interest, as it could either lessen or strengthen the case for an interest rate hike in December. Producer prices due later today,could shape up the expectation for tomorrows CPI, however, the reaction on the U.S. dollar will likely be limited.
It's also an important day for the pound, with June's industrial and manufacturing production, construction, and trade balances under the traders' radar.
Lingering US-North Korea Tensions Continue To Constrain Markets, Kiwi Falls On RBNZ
Intensifying turmoil between the US and North Korea continued to strain forex markets across the globe and to lift demand for assets perceived as safe havens for the second day. The yen and gold continued rising, while the Swiss franc took a breather against the dollar (last trading at 0.9660 francs) and the euro, but kept most of its yesterday’s hefty gains.
North Korea went further with its threat to the US by providing detailed plans about how it plans to launch missile strikes on the US-Pacific territory of Guam. The country plans to fly four missiles over Japan and land them 30-40km from Guam. While North Korea often threatens to attack the US, the revelation of this plan was unusual. At the same time, North Korea dismissed threats by President Trump as a lot of “nonsense”.
Looking at currency movements during the Asian session, the yen continued strengthening against the dollar, with the pair trading below the 110 level at 109.96 ahead of European trading. The yen also gained against the euro, with euro/yen dropping to 129.03. The dollar index was up 0.15% to 93.68 as both the euro and sterling weakened against the greenback.
The kiwi came off a three-week low immediately upon the release of the Reserve Bank of New Zealand monetary policy statement. As widely expected, the bank kept its official cash rate unchanged at 1.75% and did not sound as dovish as investors expected. Specifically, the RBNZ tempered its language on concerns around the kiwi appreciation. However, the early gains were short-lived as the New Zealand dollar tumbled to the lowest since July 18 to last trade at $0.7278. Retail sales through credit cards in New Zealand disappointed as the July figure grew only 2% annually, down from 4.5% in the prior month. Monthly, the same figure fell 0.5% coming in well below expectations of a 0.3% gain.
The euro fell a quarter-of-a-percent against the dollar to trade at $1.1728 as European markets opened. Disappointment around worse French monthly industrial production in June added negative pressure to the euro. The figure showed a decline of 1.1% versus expectations for a 0.5% drop and reversing from a 1.9% gain in May. There are no other major economic data releases scheduled for the eurozone later in the day.
Sterling slid against the dollar below the $1.3000 mark. The Royal Institution of Chartered Surveyors announced earlier today that UK house balance was only 1% positive against expectations of an 8% positive figure. Traders will be focusing on figures detailing manufacturing activity in the UK that are due to be released at 8:30 GMT.
Later in the session dollar traders will be busy monitoring producer prices in the US, ahead of the key inflation figure tomorrow.
Oil prices rose almost half a percent in today’s trading following a bigger-than-expected drop in US crude inventories. EIA reported that US crude inventories fell last week as refineries boosted output to the highest percentage of capacity in 12 years. WTI was last trading at $49.74 a barrel while Brent was at $52.95.
Gold was up for the third day, hitting an intra-day high of $1,280.38 an ounce that was last recorded mid-June.
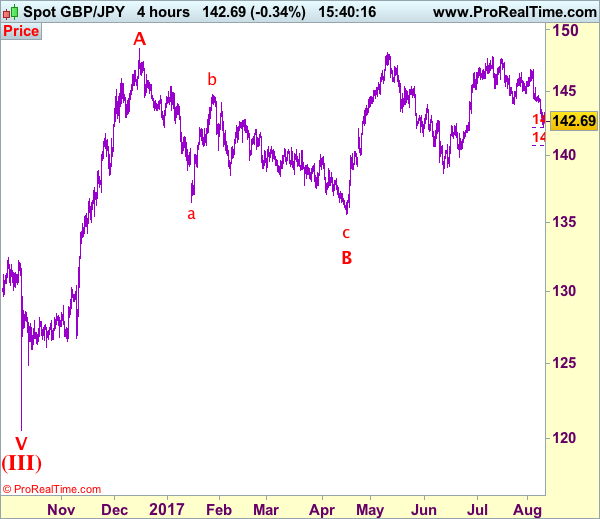
Trade Idea: GBP/USD – Sell at 1.3055
GBP/USD – 1.2960
Recent wave: Wave V of larger degree wave (III) has ended at 1.1986 and major correction has commenced from there for gain to 1.3000 and 1.3140-50
Trend: Near term up
Original strategy :
Sell at 1.3090, Target: 1.2890, Stop: 1.3150
Position: -
Target: -
Stop: -
New strategy :
Sell at 1.3055, Target: 1.2860, Stop: 1.3115
Position: -
Target: -
Stop:-
As cable has fallen again after brief recovery, adding credence to our bearish view and suggesting the fall from 1.3269 top is still in progress for retracement of recent upmove, hence further weakness to previous support at 1.2933 would be seen, break there would extend decline to 1.2890-00 and possibly towards 1.2850-60, however, previous support at 1.2812 would hold from here, bring another rebound later.
In view of this, would be prudent to sell cable on subsequent recovery as resistance at 1.3059 should limit upside and bring another decline. Only above previous support at 1.3112 (now resistance) would abort and signal the fall from 1.3269 has ended instead, bring a stronger rebound to indicated resistance at 1.3165 first.
Our preferred count on the daily chart is that cable's rebound from 1.3500 (wave (A) trough) is unfolding as a wave (B) with A ended at 1.7043, followed by triangle wave B and wave C as well as wave (B) has ended at 1.7192, the subsequent selloff is the larger degree wave (C) which is still unfolding with minor wave (III) of larger degree wave 3 ended at 1.1986, hence wave (IV) correction is in progress which could either be a triangle wave (IV) of a complex formation but upside should be limited to 1.3500 and price should falter well below 1.4000, bring another decline in wave (V) of 3 for weakness to 1.1500, then 1.1200.
Euro Forming Major Top At 131.40 Vs Japanese Yen
Key Highlights
- The Euro is carving a major top near 131.40 against the Japanese Yen.
- There was a break below two important bullish trend lines at 130.50 on the daily chart of EUR/JPY.
- Japan’s Machinery New orders in June 2017 declined by 1.9% (MoM) compared with the +3.7% forecast.
- The US Initial Jobless Claims for the week ending Aug 5 2017 will be released today. The forecast is of no change from the last 240K.
EURJPY Technical Analysis
The Euro surged higher in June and July 2017 against the Japanese Yen above 131.00. August 2017 seems to be a bearish month for EUR/JPY, as the pair is carving a top near 131.40.
Looking at the daily chart of EUR/JPY, there are clear bearish candles near 131.00-131.40. There was also a break below two important bullish trend lines at 130.50.
The pair has moved below the 23.6% Fib retracement level of the last wave from the 122.39 low to 131.40 high. So, there are high chances of EUR/JPY trading further lower towards 127.00.
The next major support sits at 50% Fib retracement level of the last wave from the 122.39 low to 131.40 high. There is a bullish trend line at 127.00 positioned, which might act as a support on the downside.
On the upside, the broken trend line support at 130.50 can act as a hurdle if the pair attempts a recovery in the short term.
Japan’s Machinery New Orders
Recently in Japan, the Machinery New orders for June 2017 was released by the Cabinet Office. The market was aligned for an increase of 3.7% compared with the previous month.
However, the actual result was completely opposite, as there was a decline of 1.9% in the orders. The yearly change reading was even worse, as there was a decline of 5.2% in the orders. The market forecast was 1% decline and the last reading was +0.6%.
The report added that:
Private-sector machinery orders, excluding volatile ones for ships and those from electric power companies, decreased a seasonally adjusted by 1.9% in June, and showed fell by 4.7% in April-June period.
The EUR/JPY pair remains under bearish pressure and likely to extend declines towards 128.00 or even 127.00 in the near term.
Economic Releases to Watch Today
- US Initial Jobless Claims – Forecast 240K, versus 240K previous.
- US Producer Price Index July 2017 (MoM) – Forecast +0.1%, versus +0.1% previous.
- Producer Price Index July 2017 (YoY) – Forecast +2.2%, versus +2.0% previous.
Trade Idea: EUR/JPY – Hold short entered at 129.50
EUR/JPY - 128.95
Recent wave: wave v of (C) ended at 94.12 and major correction in wave A has ended at 149.79
Trend: Near term up
Original strategy:
Sold at 129.50, Target: 127.50, Stop: 130.10
Position: - Short at 129.50
Target: - 127.50
Stop: - 130.10
New strategy :
Hold short entered at 129.50, Target: 127.50, Stop: 129.50
Position: - Short at 129.50
Target: - 127.50
Stop:- 129.50
Although the single currency rebounded after falling to 128.43 yesterday, reckon upside would be limited and bring another decline later, below said support at 128.43 would extend the fall from 131.40 top for retracement of early upmove to 128.00, then towards previous support at 127.44, however, near term oversold condition should limit downside to 127.00.
In view of this, we are holding on to our short position entered at 129.50. Only break of indicated previous support at 130.09 would abort and suggest low is formed instead, bring a stronger rebound to 130.50-60 but price should falter below resistance at 131.12 and bring another decline later.
Our latest preferred count is that wave (ii) is ABC-X-ABC which ended at 123.33 and wave (iii) is unfolding with wave iii ended at 100.77, followed by wave iv at 111.57 and wave v as well as the wave (iii) has ended at 97.04, followed by wave (iv) at 111.43 and wave (v) has ended at 94.12 which is also the end of the larger degree v, this also implied the major wave (C) has also ended there, hence major correction has commenced from there with (A) leg unfolding in its lower degree wave c which has possibly ended at 145.69. Under this count, A-B-C wave (B) has commenced with A leg ended at 136.23, wave B at 143.79 and wave C has possibly ended at 149.79.
Our larger degree count is that the decline from 139.26 is wave (C) and is sub-divided into a diagonal triangle i-ii-iii-iv-v with wave i - 105.44, wave ii- 123.33, wave iii - 97.03, wave iv - 111.43, followed by the final wave v as well as the end of wave (C) at 94.12, this also mark the bottom of larger degree wave B. Under this count, major rise in wave C has commenced as an impulsive wave with minor wave III ended at 145.69, wave V is still in progress for further gain to 150.00. Having said that, this so-called wave V could well be the first leg of larger degree 5-waver wave C and this wave C should bring at least a retest of wave A top at 169.97 (July 2008).